The potential of UV-visible spectroscopy and chemometrics for determination of
geographic origin of three specialty coffees in Indonesia
Diding Suhandy, and Meinilwita Yulia
Citation: AIP Conference Proceedings2021, 040001 (2018); doi: 10.1063/1.5062745 View online: https://doi.org/10.1063/1.5062745
The Potential of UV-Visible Spectroscopy and
Chemometrics for Determination of Geographic Origin of
Three Specialty Coffees in Indonesia
Diding Suhandy
1, a)and Meinilwita Yulia
2, b)1Spectroscopy Research Group (SRG), Laboratory of Bioprocess and Postharvest Engineering, Department of
Agricultural Engineering, Faculty of Agriculture, University of Lampung, Jalan Prof. Dr. Soemantri 10 Brojonegoro, Bandar Lampung, 35145, Indonesia.
2Department of Agricultural Technology, Lampung State Polytechnic, Jalan Soekarno Hatta 10, Rajabasa, Bandar
Lampung, 35141, Indonesia.
a)Corresponding author: [email protected] b)[email protected]
Abstract. The growing global trading market for specialty coffee increases the need for better coffee quality evaluation methods. Several Arabica coffees in Indonesia have high commercial value. For this reason, the development of analytical methods with high sensitivity and accuracy for detection of its adulteration was important. This research evaluated the potential of UV-visible spectroscopy and partial least squares discriminant analysis (PLS-DA) for determining the geographic origin of three specialty coffees (Gayo, Kintamani and Wamena) in Indonesia. In this research, 296 coffee samples from three different origins (Gayo, Kintamani and Wamena) were used. All coffee samples were ground using a home-coffee-grinder. We sieved all coffee samples through a nest of US standard sieves (mesh number of 40) on a Meinzer II sieve shaker for 10 minutes to obtain a particle size of 420 μm. All samples were extracted with distilled water and then filtered. For each sample, 3 mL of extracted sample then was pipetted into 10 mm cuvettes for spectral data acquisition. The spectral data were acquired using a Genesys 10s UV-visible spectrometer in the range of 190-1100 nm. A PLS-DA classification model was estimated to classify the origin of specialty coffees by their UV-visible spectra. The best PLS-DA model accurately classified the specialty coffee samples of the prediction sample set with prediction ability of 100% of correct classification for Gayo, Kintamani and Wamena, respectively. The results demonstrate that UV-visible spectroscopy coupled with PLS-DA provides a sensitive and accurate analytical method to distinguish ground roasted coffee samples geographically.
Keywords: Coffee, geographic origin, partial least squares discriminant analysis, UV-visible spectroscopy.
INTRODUCTION
Several types of coffee beans in Indonesia coming from certain regions, such as Arabica Gayo coffee (Aceh), Arabica Kintamani coffee (Bali) and Arabica Wamena coffee (Papua), have been classified as specialty coffee. Those coffees are very special and unique in taste. For this reason, the prices are higher than for other, non-specialty coffee. In order to protect the authenticity of those specialty coffees, the Indonesian government has developed the
concept of “geographical indication” or GIs since regulated in Law No. 20/2016 on Trademarks (TM) and
are 19 products that have been registered and granted the GIs. For example, Arabica Gayo coffee is registered and received the GI number ID G 000000005, and Arabica Kintamani coffee has the GI number ID G 000000001.
Most of those specialty coffees are traded in the form of ground roasted coffee (powder), as it is ready and easier for consumers to prepare for daily usage. However, when it is in the form of ground roasted coffee, it is almost not feasible to discriminate between specialty coffee coming from one origin and specialty coffee from another origin with the naked eye. For this reason, adulteration of specialty coffee could become a serious problem. Food adulteration is one types of food fraud which can be defined as lowering the quality of food by intentional or unintentional substitution of food with some inferior foreign material or by removal of some value added food substitute from the main food item.1,2 The risk of food adulteration is a major concern in the food industry not only
for economic but also for safety reasons.1 To avoid the serious problem of food adulteration, there is a need to
develop a food authentication system to ensure and protect the authenticity of high-priced products (including specialty coffee).
One important issue in the area of food authentication is development of the method for authentication. Authentication itself can be defined as the process that verifies that a food is in compliance with its label description. Several methods have been reported to assess the authenticity of food products, including spectroscopy (UV-visible, NIR, MIR and Raman), chromatography (HPLC, GC, GC–MS, GC-FTIR, and GC-TOFMS) and the electronic nose and electronic tongue.2-4 For authentication of coffee, several different analytical methods have been used such as
near infrared spectroscopy, mid infrared spectroscopy and gas chromatography.5-8 However, no reported work has
been done on the authentication of ground roasted coffees produced in different regions in Indonesia. In addition, although UV-visible spectroscopy has been used for quality evaluation of ground roasted coffee, no record has been found in the literature on its application for the discrimination of Indonesian ground roasted coffees.9-11 Therefore,
the main objective of the current research was to develop a supervised classification method using partial least squares discriminant analysis (PLS-DA) capable of discriminating coffees produced in Indonesia according to their origin using UV-visible spectroscopy.
MATERIALS AND METHODS
Coffee Samples
Indonesian specialty Arabica coffees (Gayo, Kintamani and Wamena) were purchased from a local market in Bandar Lampung, Lampung, Indonesia (roasted coffee bean). Sample preparation including grinding and sieving was performed based on the procedure described in previous published works [9-10]. Altogether, 296 samples (each sample consist of 1 g weight) of either Gayo, Kintamani or Wamena were prepared. A standard aqueous extraction of the coffee samples was then performed in accordance to previous works [9-11]. After cooling to room temperature (for 20 min), all extracts were then diluted in a 1:20 (mL: mL) proportion with distilled water.
Spectral Acquisition
Spectral data of aqueous coffee samples were recorded using a UV-visible spectrometer (Genesys™ 10S UV -Vis, Thermo Scientific, USA). Spectra were obtained in transmittance mode and performed at room temperature (27-28°C). Spectral data were collected over the range 190 to 1100 nm with 1 nm of wavelength accuracy. All the spectral data were then imported into The Unscrambler® X (30 days trial version – CAMO Software, Oslo, Norway).
Spectral Treatment
Data Analysis
The dataset (spectral data) was randomly divided into two subsets: a calibration set (240 samples) and prediction set (56 samples). The calibration set was used to develop classifier model based on the PLS-DA method. Prediction set was used to evaluate the performance of the developed PLS-DA model.
Development of PLS-DA Model
The PLS-DA model was developed using the PLS algorithm with the matrix Y (variable Y) containing information about the sample classes (Gayo, Kintamani and Wamena class). For each class, the value is assumed to be 0 or 1, depending on whether or not it belongs to the class represented for that column.9 For this reason,
evaluation of the PLS-DA model was conducted in a manner similar to PLS model evaluation using the following parameters: coefficient of determination (R2) both in calibration and validation, root mean square error of calibration
(RMSEC), and root mean square error of cross-validation (RMSECV).12 A calibration model with R2 value greater
than 0.91 is considered to be an excellent calibration, while an R2 value between 0.82 and 0.90 results in good
prediction [12]. To avoid over-fitting cases in the PLS-DA model, a small difference between RMSEC and RMSECV is required [13-14]. To evaluate the performance of the PLS-DA model, the percentage of correct classifications (%CC) was calculated based on the previous work.15
RESULTS AND DISCUSSION
Spectral Analysis of Specialty Coffees with Different Origins
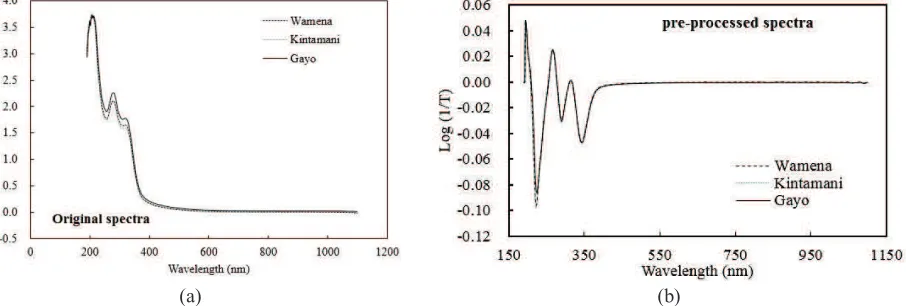
Figure 1 shows the average original spectra (left) and pre-processed spectra (right) of the aforementioned three specialty coffees. In general, the absorbance intensity was high in the range of 190-400 nm. This spectral range is associated with nߡȧ* electronic transition of caffeine, chlorogenic acids, and trigonelline molecules.16 In next step,
we used spectral data in the range of 250-450 nm for principal components analysis (PCA) and PLS-DA analysis.
(a) (b)
FIGURE 1. The original and pre-processed spectral data (average) of three different specialty coffees in the range of 190-1100 nm. Original spectra (a) Pre-processed spectra (b).
Unsupervised Classification Using Principal Component Analysis
The result of the PCA is plotted in Figure 2 (a). PC1 explained 69% of the total variance in the data set, while PC2 explained 24%. The cumulative percentage of variance (CPV) explained of the first two principal components was 93% of the total variance in the whole spectral dataset, which meets the general requirements of CPV more than 70%–85% for PCA analysis.17 Kintamani coffee samples were well separated from the Wamena and Gayo coffee
Figure 2 (b) shows the loadings of PCA about the sample groups for specialty coffee samples. The PCA loading elucidates the data structure in terms of correlations between the modeled variables. In this study, we identified three relevant wavelengths with high loadings values for coffee sample discrimination to explain the variance of the model. The first wavelength is around 275 nm, which corresponds to the C=O chromophore absorbance of caffeine.16 The second wavelength is 325 nm, and it corresponds to the absorbance of trigonelline and caffeic acid.16
The third important wavelength is 350 nm, and it is close related to the absorbance of chlorogenic acid (CGA).9
(a) (b)
FIGURE 2. The PCA score plots of the three different coffee samples groups based on pre-processed spectral data (a) and loading plot of first two PCs (PC1 and PC2) from PCA analysis (b).
Supervised Classification using PLS-DA Method
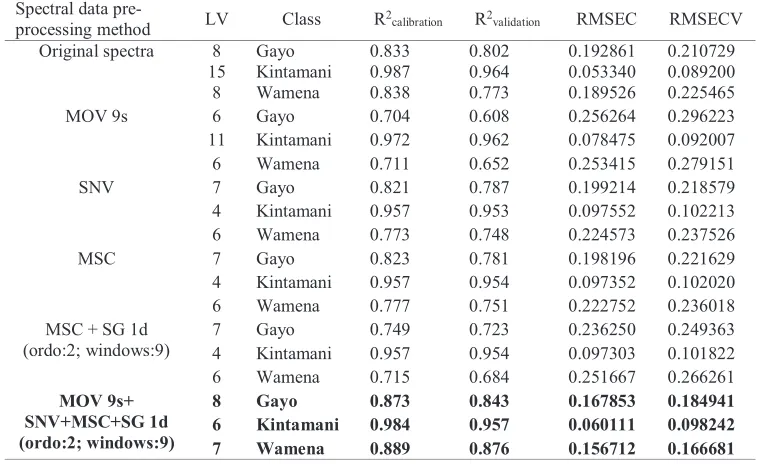
The PLS-DA model was developed for each spectral type (original and pre-processed spectra) in the range of 250-450 nm. The results are summarized in Table 1. It can be seen that the best PLS-DA model was obtained using pre-processed spectra (combination of MOV+SNV+MSC+SG 1d) with eight, six and seven latent variables (LVs) for the Gayo, Kintamani and Wamena class, respectively. The PLS-DA model for the Kintamani class had the highest quality with R2 = 0.984 for calibration and R2 = 0.957 for validation.
TABLE 1. PLS-DA result for geographical origin using original and pre-processed spectra in the range of 250-450 nm using calibration and validation sample set (240 samples). The best model is marked in bold.
Spectral data
Classification of Geographical Origin using PLS-DA
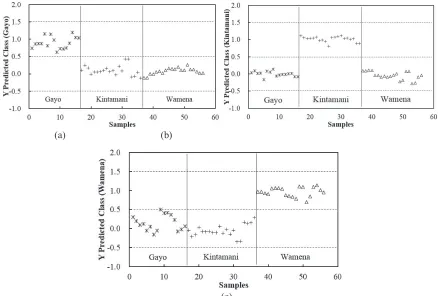
Figure 3 shows the results of prediction obtained by PLS-DA for the Gayo class, Kintamani class and Wamena class, respectively. For the Gayo class, the predicted Y values close to one (between 0.5 and 1.5) indicate that the samples belong to the Gayo class, while the predicted Y values close to zero (between -0.5 and 0.5) point out that the samples belong to the not Gayo class (Kintamani and Wamena coffee). For the Kintamani class, the predicted Y values close to one (between 0.5 and 1.5) indicate that the samples belong to the Kintamani class, while the predicted Y values close to zero (between -0.5 and 0.5) indicate that the samples belong to the not Kintamani class (Gayo and Wamena coffee). For the Wamena class, the predicted Y values close to one (between 0.5 and 1.5) indicate that the samples belong to the Wamena class, while the predicted Y values close to zero (between -0.5 and 0.5) point that the samples belong to the not Wamena class (Gayo and Kintamani coffee). If the predicted Y value is not located in the zone between -0.5 to 1.5, the sample cannot be identified. We found that although there is one sample in Wamena class located on the border line in the predicted set, the classification using PLS-DA is accurate (100% the percentages of correct classification for all samples), as shown in Figure 3.
(a) (b)
(c)
FIGURE 3. PLS-DA classification for Y predicted class. (a) Gayo (ѽ), (b) Kintamani (), and (c) Wamena (Ѭ).
SUMMARY
ACKNOWLEDGMENTS
The research was financially supported by Ministry of Research, Technology and Higher Education, Republic of Indonesia (Kemenristekdikti) under Research Grant PENELITIAN STRATEGIS NASIONAL INSTITUSI (PSNI) (Grant Number: 393/UN26.21/PN/2018).
REFERENCES
1. L. Manning, Curr. Opin. Food Sci.10, 16–21 (2016).2. K. M. Sørensen, B. Khakimov and S. B. Engelsen, Curr. Opin. Food Sci.10, 45–51 (2016).
3. C. Fanali, L. Dugo and L.Mondello, “Advances in Chromatographic Techniques for Food Authenticity Testing,” in Advances in Food Authenticity Testing, edited by G. Downey (Elsevier, Amsterdam, 2016), pp.
253–284.
4. M. Perisa and L. Escuder-Gilabert, Trends Food Sci. Technol.58, 40–54 (2016).
5. J. V. Link, A. L. G. Lemes, I. Marquetti, M. B. dos Santos Scholz and E. Bona, Food Res. Int. 59, 1–7 (2014).
6. J. V. Link, A. L. G. Lemes, I. Marquetti, M. B. dos Santos Scholz and E. Bona, Chemometr. Intell. Lab. Syst.135, 150–156 (2014).
7. J. H. D. S. Taveira, F. M. Borém, L. P. Figueiredo, N. Reis, A. S. Franca, S. A. Harding and C. J. Tsai,
Food Res. Int.61, 75–82 (2014).
8. P. R. A. B. Toledo, M. M. R. Melo, H. R. Pezza, A. T. Toci, L. Pezza and C. M. Silva, Food Control73, 164–174 (2017).
9. D. Suhandy and M. Yulia, Int. J. Food Prop.20, S331–S339 (2017). 10. D. Suhandy and M. Yulia, Int. J. Food Sci. 1-7 (2017).
11. M. Yulia and D. Suhandy, J. Phys.: Conf. Ser. 835, 1–6 (2017).
12. D. Suhandy, T. Suzuki, Y. Ogawa, N. Kondo, H. Naito, T. Ishihara, Y. Takemoto and W. Liu, Eng. in Agric. Environ. Food5, 90–95 (2012).
13. D. Suhandy, M. Yulia, Y. Ogawa and N. Kondo, Eng. in Agric. Environ. Food5, 152–158 (2012). 14. M. Yulia, D. Suhandy, Y. Ogawa and N. Kondo, Eng. in Agric. Environ. Food7, 148–154 (2014).
15. O. Galtier, O. Abbas, Y. Le Dréau, C. Rebufa, J. Kister, J. Artaud and N. Dupuy, Vib. Spectrosc.55, 132–
140 (2011).
16. U. T. C. P. Souto, M. F. Barbosa, H. V. Dantas, A. S. de Pontes, W. S. Lyra, P. H. G. D. Diniz, M. C. U. Araújo and E. C. da Silva, LWT-Food Sci. Technol.63, 1037–1041 (2015).