Big Data Essentials
Copyright © 2016 by Anil K. Maheshwari, Ph.D.
By purchasing this book, you agree not to copy or distribute the book by any
means, mechanical or electronic.
No part of this book may be copied or transmitted without written permission.
Other books by the same author:
Data Analytics Made Accessible
the #1 Bestseller in Data Mining
Preface
Big Data is a new, and inclusive, natural phenomenon. It is as messy as nature itself. It requires a new kind of Consciousness to fathom its scale and scope, and its many opportunities and challenges. Understanding the essentials of Big Data requires suspending many conventional expectations and assumptions about data … such as completeness, clarity, consistency, and conciseness. Fathoming and taming the multi-layered Big Data is a dream that is slowly becoming a reality. It is a rapidly evolving field that is growing exponentially in value and capabilities.
There is a growing number of books being written on Big Data. They fall mostly in two categories. The first kind focus on business aspects, and discuss the strategic internal shifts required for reaping the business benefits from the many opportunities offered by Big Data. The second kind focus on particular technology platforms, such as Hadoop or Spark. This book aims to bring together the business context and the technologies in a seamless way.
This book was written to meet the needs for an introductory Big Data course. It is meant for students, as well as executives, who wish to take advantage of emerging opportunities in Big Data. It provides an intuition of the wholeness of the field in a simple language, free from jargon and code. All the essential Big Data technology tools and platforms such as Hadoop, MapReduce, Spark, and NoSql are discussed. Most of the relevant
programming details have been moved to Appendices to ensure readability. The short chapters make it easy to quickly understand the key concepts. A complete case study of developing a Big Data application is included.
Thanks to Maharishi Mahesh Yogi for creating a wonderful university whose
consciousness-based environment made writing this evolutionary book possible. Thanks to many current and former students for contributing to this book. Dheeraj Pandey assisted with the Weblog analyzer application and its details. Suraj Thapalia assisted with the
Hadoop installation guide. Enkhbileg Tseeleesuren helped write the Spark tutorial. Thanks to my family for supporting me in this process. My daughters Ankita and Nupur reviewed the book and made helpful comments. My father Mr. RL Maheshwari and brother Dr. Sunil Maheshwari also read the book and enthusiastically approved it. My colleague Dr. Edi Shivaji too reviewed the book.
May the Big Data Force be with you!
Contents
Preface
Chapter 1 – Wholeness of Big Data Introduction
Understanding Big Data
CASELET: IBM Watson: A Big Data system Capturing Big Data
Ingesting streams at an extremely fast pace
Handling a variety of forms and functions of data Processing data at huge speeds
Conclusion and Summary
Organization of the rest of the book Review Questions
Liberty Stores Case Exercise: Step B1 Section 1
Chapter 2 - Big Data Applications Introduction
CASELET: Big Data Gets the Flu Big Data Sources
Social Media
Liberty Stores Case Exercise: Step B2 Chapter 3 - Big Data Architecture
Introduction
Chapter 4: Distributed Computing using Hadoop
Reading and Writing Local Files into HDFS Reading and Writing Data Streams into HDFS Sequence Files
YARN Conclusion
Review Questions
RDBMS Vs NoSQL
Review Questions
Chapter 9 – Cloud Computing Primer Introduction
Cloud Computing Characteristics In-house storage
Cloud storage
Cloud Computing: Evolution of Virtualized Architecture Cloud Service Models
Cloud Computing Myths
Conclusion
Review Questions Section 3
Chapter 10 – Web Log Analyzer application case study Introduction Scala Spark code for log analysis Sample Log data
Sample Input Data:
Sample Output of Web Log Analysis Conclusion and Findings
Review Questions
Chapter 10: Data Mining Primer Gathering and selecting data Data cleansing and preparation Outputs of Data Mining
Mining Big Data
Appendix 1: Hadoop Installation on Amazon Web Services (AWS) Elastic Compute Cluster (EC2)
Creating Cluster server on AWS, Install Hadoop from CloudEra Step 1: Creating Amazon EC2 Servers.
Step 2: Connecting server and installing required Cloudera distribution of Hadoop Step 3: WordCount using MapReduce
Appendix 2: Spark Installation and Tutorial Step 1: Verifying Java Installation
Step 7: Verifying the Spark Installation Step 8: Application: WordCount in Scala Additional Resources
Chapter 1 – Wholeness of Big Data
Introduction
Big Data is an all-inclusive term that refers to extremely large, very fast, diverse, and complex data that cannot be managed with traditional data management tools. Ideally, Big Data would harness all kinds of data, and deliver the right information, to the right person, in the right quantity, at the right time, to help make the right decision. Big Data can be managed by developing infinitely scalable, totally flexible, and evolutionary data
architectures, coupled with the use of extremely cost-effective computing components. The infinite potential knowledge embedded within this cosmic computer would help connect everything to the Unified Field of all the laws of nature.
Understanding Big Data
Big Data can be examined on two levels. On a fundamental level, it is data that can be analyzed and utilized for the benefit of the business. On another level, it is a special kind of data that poses unique challenges. This is the level that this book will focus on.
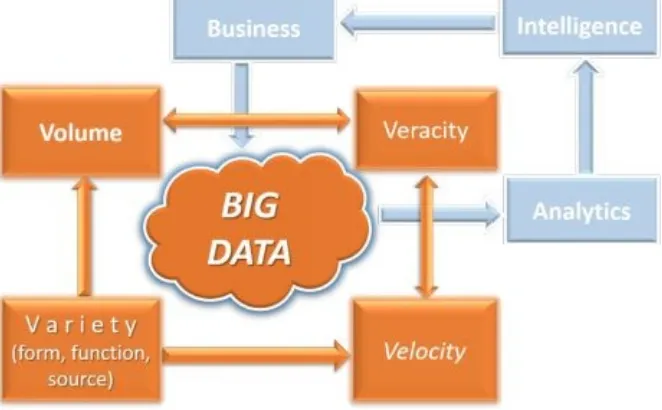
Figure 1‑1: Big Data Context
At the level of business, data generated by business operations, can be analyzed to
generate insights that can help the business make better decisions. This makes the business grow bigger, and generate even more data, and the cycle continues. This is represented by the blue cycle on the top-right of Figure 1.1. This aspect is discussed in Chapter 10, a primer on Data Analytics.
On another level, Big Data is different from traditional data in every way: space, time, and function. The quantity of Big Data is 1,000 times more than that of traditional data. The speed of data generation and transmission is 1,000 times faster. The forms and functions of Big Data are much more diverse: from numbers to text, pictures, audio, videos, activity logs, machine data, and more. There are also many more sources of data, from individuals to organizations to governments, using a range of devices from mobile phones to
computers to industrial machines. Not all data will be of equal quality and value. This is represented by the red cycle on the bottom left of Figure 1.1. This aspect of Big Data, and its new technologies, is the main focus of this book.
Big Data is mostly unstructured data. Every type of data is structured differently, and will have to be dealt with differently. There are huge opportunities for technology providers to innovate and manage the entire life cycle of Big Data … to generate, gather, store,
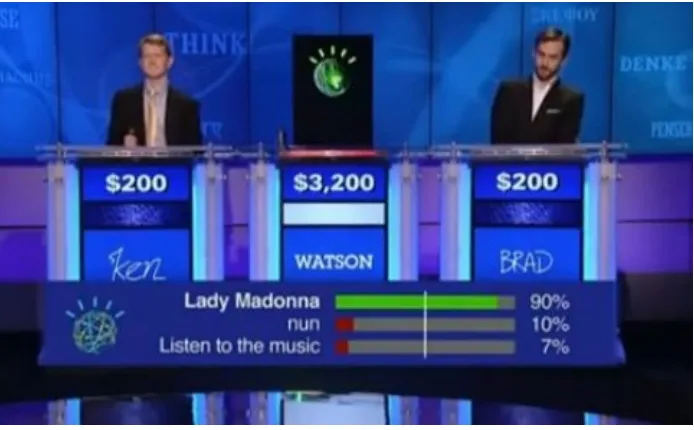
CASELET: IBM Watson: A Big Data system
IBM created the Watson system as a way of pushing the boundaries of
Artificial Intelligence and natural language understanding technologies.
Watson beat the world champion human players of Jeopardy (quiz style TV
show) in Feb 2011. Watson reads up on data about everything on the web
including the entire Wikipedia. It digests and absorbs the data based on
simple generic rules such as: books have authors; stories have heroes; and
drugs treat ailments. A jeopardy clue, received in the form of a cryptic
phrase, is broken down into many possible potential sub-clues of the
correct answer. Each sub-clue is examined to see the likeliness of its
answer being the correct answer for the main problem. Watson calculates
the confidence level of each possible answer. If the confidence level
reaches more than a threshold level, it decides to offer the answer to the
clue. It manages to do all this in a mere 3 seconds.
Watson is now being applied to diagnosing diseases, especially cancer.
Watson can read all the new research published in the medical journals to
update its knowledge base. It is being used to diagnose the probability of
various diseases, by applying factors such as patient’s current symptoms,
health history, genetic history, medication records, and other factors to
recommend a particular diagnosis. (Source: Smartest machines on Earth:
youtube.com/watch?v=TCOhyaw5bwg)
Figure 1.2: IBM Watson playing Jeopardy
Q1: What kinds of Big Data knowledge, technologies and skills are
required to build a system like Watson? What kind of resources are
needed?
Capturing Big Data
If data were simply growing too large, OR only moving too fast, OR only becoming too diverse, it would be relatively easy. However, when the four Vs (Volume, Velocity, Variety, and Veracity) arrive together in an interactive manner, it creates a perfect storm. While the Volume and Velocity of data drive the major technological concerns and the costs of managing Big Data, these two Vs are themselves being driven by the 3rd V, the
Variety of forms and functions and sources of data.
Volume of Data
The quantity of data has been relentlessly doubling every 12-18 months. Traditional data is measured in Gigabytes (GB) and Terabytes (TB), but Big Data is measured in Petabytes (PB) and Exabytes (1 Exabyte = 1 Million TB).
This data is so huge that it is almost a miracle that one can find any specific thing in it, in a reasonable period of time. Searching the world-wide web was the first true Big Data application. Google perfected the art of this application, and developed many of the path-breaking technologies we see today to manage Big Data.
The primary reason for the growth of data is the dramatic reduction in the cost of storing data. The costs of storing data have decreased by 30-40% every year. Therefore, there is an incentive to record everything that can be observed. It is called ‘datafication’ of the world. The costs of computation and communication have also been coming down,
similarly. Another reason for the growth of data is the increase in the number of forms and functions of data. More about this in the Variety section.
Velocity of Data
If traditional data is like a lake, Big Data is like a fast-flowing river. Big Data is being generated by billions of devices, and communicated at the speed of the internet. Ingesting all this data is like drinking from a fire hose. One does not have control over how fast the data will come. A huge unpredictable data-stream is the new metaphor for thinking about Big Data.
The primary reason for the increased velocity of data is the increase in internet speed. Internet speeds available to homes and offices are now increasing from 10MB/sec to 1 GB/sec (100 times faster). More people are getting access to high-speed internet around the world. Another important reason is the increased variety of sources that can generate and communicate data from anywhere, at any time. More on that in the Variety section.
Big data is inclusive of all forms of data, for all kinds of functions, from all sources and devices. If traditional data, such as invoices and ledgers were like a small store, Big Data is the biggest imaginable shopping mall that offers unlimited variety. There are three major kinds of variety.
1. The first aspect of variety is the form of data. Data types range in order of simplicity and size from numbers to text, graph, map, audio, video, and others. There could be a composite of data that includes many elements in a single file. For example, text documents have text and graphs and pictures embedded in them. Video can have charts and songs embedded in them. Audio and video have
different and more complex storage formats than numbers and text. Numbers and text can be more easily analyzed than an audio or video file. How should
composite entities be stored and analyzed?
2. The second aspect is the variety of function of data. There are human chats and conversation data, songs and movies for entertainment, business transaction records, machine operations performance data, new product design data, old data for backup, etc. Human communication data would be processed very differently from operational performance data, with totally different objectives. A variety of applications are needed to compare pictures in order to recognize people’s faces; compare voices to identify the speaker; and compare handwritings to identify the writer.
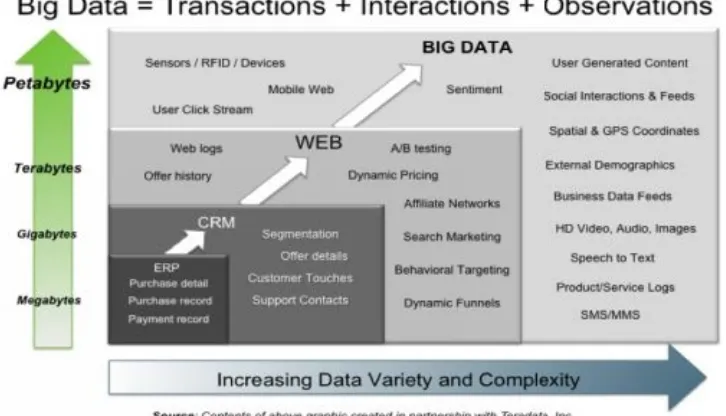
3. The third aspect of variety is the source of data. Mobile phones and tablet devices enable a wide series of applications or apps to access data and generate data from anytime anywhere. Web access logs are another new and huge source of
diagnostic data. ERP systems generate massive amounts of structured business transactional information. Sensors on machines, and RFID tags on assets, generate incessant and repetitive data. Broadly speaking, there are three broad types of sources of data: Human-human communications; human-machine
Figure 1.3 Sources of Big Data (Source: Hortonworks.com)
Veracity of Data
Veracity relates to the believability and quality of data. Big Data is messy. There is a lot of misinformation and disinformation. The reasons for poor quality of data can range from human and technical error, to malicious intent.
1. The source of information may not be authoritative. For example, all websites are not equally trustworthy. Any information from whitehouse.gov or from
nytimes.com is more likely to be authentic and complete. Wikipedia is useful, but not all pages are equally reliable. The communicator may have an agenda or a point of view.
2. The data may not be received correctly because of human or technical failure. Sensors and machines for gathering and communicating data may malfunction and may record and transmit incorrect data. Urgency may require the transmission of the best data available at a point in time. Such data makes reconciliation with later, accurate, records more problematic.
3. The data provided and received, may however, also be intentionally wrong, for competitive or security reasons.
Benefitting from Big Data
Data usually belongs to the organization that generates it. There is other data, such as social media data, that is freely accessible under an open general license. Organizations can use this data to learn about their consumers, improve their service delivery, and design new products to delight their customers and to gain a competitive advantage. Data is also like a new natural resource. It is being used to design new digital products, such as on-demand entertainment and learning.
Organizations may choose to gather and store this data for later analysis, or to sell it to other organizations, who might benefit from it. They may also legitimately choose to discard parts of their data for privacy or legal reasons. However, organizations cannot afford to ignore Big Data. Organizations that do not learn to engage with Big Data, could find themselves left far behind their competition, landing in the dustbin of history.
Innovative small and new organizations can use Big Data to quickly scale up and beat larger and more mature organizations.
Big Data applications exist in all industries and aspects of life. There are three major types of Big Data applications: Monitoring and Tracking, Analysis and Insight, and new digital product development.
Monitoring and Tracking Applications: Consumer goods producers use monitoring and tracking applications to understand the sentiments and needs of their customers. Industrial organizations use Big Data to track inventory in massive interlinked global supply chains. Factory owners use it to monitor machine performance and do preventive maintenance. Utility companies use it to predict energy consumption, and manage demand and supply. Information Technology companies use it to track website performance and improve its usefulness. Financial organizations use it to project trends better and make more effective and profitable bets, etc.
Figure1.4: The first Big Data President
Management of Big Data
Many organizations have started initiatives around the use of Big Data. However, most organizations do not necessarily have a grip on it. Here are some emerging insights into making better use of Big Data.
1. Across all industries, the business case for Big Data is strongly focused on addressing customer-centric objectives. The first focus on deploying Big Data initiatives is to protect and enhance customer relationships and customer experience.
2. Solve a real pain-point. Big Data should be deployed for specific business objectives in order to have management avoid being overwhelmed by the sheer size of it all.
3. Organizations are beginning their pilot implementations by using existing and newly accessible internal sources of data. It is better to begin with data under one’s control and where one has a superior understanding of the data.
4. Put humans and data together to get the most insight. Combining data-based analysis with human intuition and perspectives is better than going just one way. 5. Advanced analytical capabilities are required, but lacking, for organizations to get
the most value from Big Data. There is a growing awareness of building or hiring those skills and capabilities.
6. Use more diverse data, not just more data. This would provide a broader perspective into reality and better quality insights.
7. The faster you analyze the data, the more its predictive value. The value of data depreciates with time. If the data is not processed in five minutes, then the immediate advantage is lost.
8. Don’t throw away data if no immediate use can be seen for it. Data has value beyond what you initially anticipate. Data can add perspective to other data later on in a multiplicative manner.
9. Maintain one copy of your data, not multiple. This would help avoid confusion and increase efficiency.
10. Plan for exponential growth. Data is expected to continue to grow at exponential rates. Storage costs continue to fall, data generation continues to grow, data-based applications continue to grow in capability and functionality.
Organizing Big Data
Good organization depends upon the purpose of the organization.
Given huge quantities, it would be desirable to organize the data to speed up the search process for finding a specific, a desired thing in the entire data. The cost of storing and processing the data, too, would be a major driver for the choice of an organizing pattern. Given the fast speed of data, it would be desirable to create a scalable number of ingest points. It will also be desirable to create at least a thin veneer of control over the data by maintaining count and averages over time, unique values received, etc.
Given the variety in form factors, data needs to be stored and analyzed differently. Videos need to be stored separately and used for serving in a streaming mode. Text data may be combined, cleaned, and visualized for themes and sentiments.
Analyzing Big Data
Big Data can be analyzed in two ways. These are called analyzing Big Data in motion or Big Data at rest. First way is to process the incoming stream of data in real time for quick and effective statistics about the data. The other way is to store and structure the data and apply standard analytical techniques on batches of data for generating insights. This could then be visualized using real-time dashboards. Big Data can be utilized to visualize a flowing or a static situation. The nature of processing this huge, diverse, and largely unstructured data, can be limited only by one’s imagination.
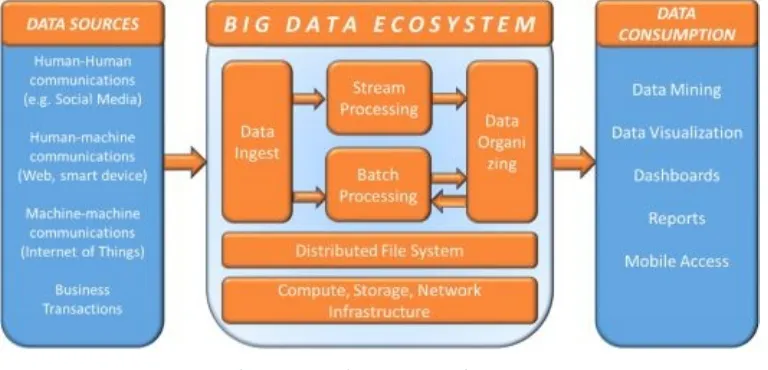
Figure 1.5: Big Data Architecture
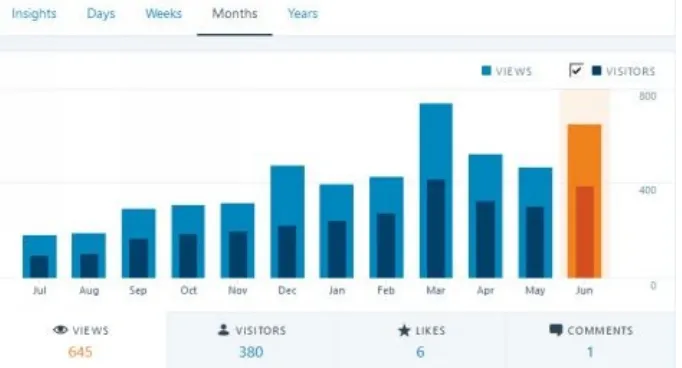
Figure 1.6: Real-time Dashboard for website performance for the author’s blog
Text Data could be combined, filtered, cleaned, thematically analyzed, and visualized in a wordcloud. Here is wordcloud from a recent stream of tweets (ie Twitter messages) from US Presidential candidates Hillary Clinton and Donald Trump. The larger words implies greater frequency of occurrence in the tweets. This can help understand the major topics of discussion between the two.
Technology Challenges for Big Data
There are four major technological challenges, and matching layers of technologies to manage Big Data.
Storing Huge Volumes
The first challenge relates to storing huge quantities of data. No machine can be big enough to store the relentlessly growing quantity of data. Therefore, data needs to be stored in a large number of smaller inexpensive machines. However, with a large number of machines, there is the inevitable challenge of machine failure. Each of these commodity machines will fail at some point or another. Failure of a machine could entail a loss of data stored on it.
The first layer of Big Data technology helps store huge volumes of data, while avoiding the risk of data loss. It distributes data across the large cluster of inexpensive commodity machines, and ensures that every piece of data is stored on multiple machines to guarantee that at least one copy is always available. Hadoop is the most well-known clustering
technology for Big Data. Its data storage pattern is called Hadoop Distributed File System (HDFS). This system is built on the patterns of Google’s File systems, designed to store billions of pages and sort them to answer user search queries.
Ingesting streams at an extremely fast pace
The second challenge relates to the Velocity of data, i.e. handling torrential streams of data. Some of them may be too large to store, but must still be ingested and monitored. The solution lies in creating special ingesting systems that can open an unlimited number of channels for receiving data. These queuing systems can hold data, from which
consumer applications can request and process data at their own pace.
Big Data technology manages this velocity problem, using a special stream-processing engine, where all incoming data is fed into a central queueing system. From there, a fork-shaped system sends data to batch processing as well as to stream processing directions. The stream processing engine can do its work while the batch processing does its work. Apache Spark is the most popular system for streaming applications.
Handling a variety of forms and functions of data
storing the data in non-relational systems that relax many of the stringent conditions of the relational model. These are called NoSQL (Not Only SQL) databases.
HBase and Cassandra are two of the better known NoSQL databases systems. HBase, for example, stores each data element separately along with its key identifying information. This is called a key-value pair format. Cassandra stores data in a document format. There are many other variants of NoSQL databases. NoSQL languages, such as Pig and Hive, are used to access this data.
Processing data at huge speeds
The fourth challenge relates to moving large amounts of data from storage to the
processor, as this would consume enormous network capacity and choke the network. The alternative and innovative mode would be to move the processor to the data.
The second layer of Big Data technology avoids the choking of the network. It distributes the task logic throughout the cluster of machines where the data is stored. Those machines work, in parallel, on the data assigned to them, respectively. A follow-up process
consolidates the outputs of all the small tasks and delivers the final results. MapReduce, also invented by Google, is the best-known technology for parallel processing of
distributed Big Data.
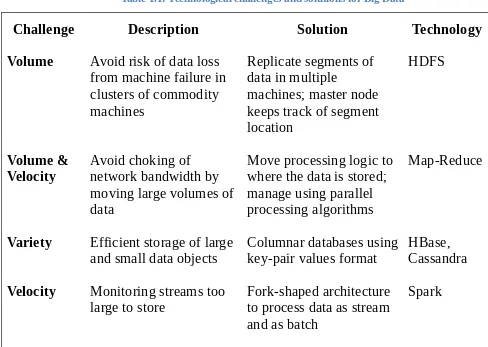
Table 1.1: Technological challenges and solutions for Big Data
Challenge Description Solution Technology
Volume Avoid risk of data loss from machine failure in
Velocity Avoid choking ofnetwork bandwidth by moving large volumes of
and small data objects Columnar databases usingkey-pair values format HBase,Cassandra
Velocity Monitoring streams too
large to store Fork-shaped architectureto process data as stream and as batch
Conclusion and Summary
Big Data is a major phenomenon that impacts everyone, and is an opportunity to create new ways of working. Big Data is extremely large, complex, fast, and not always clean, it is data that comes from many sources such as people, web, and machine communications. It needs to be gathered, organized and processed in a cost-effective way that manages the volume, velocity, variety and veracity of Big Data. Hadoop and Spark systems are popular technological platforms for this purpose. Here is a list of the many differences between traditional and Big Data.
Table 1.2: Comparing Big Data with Traditional Data
Feature Traditional Data Big Data
Representative
Structure Lake / Pool Flowing Stream / river
Primary Purpose Manage businessactivities Communicate, Monitor
Source of data Business transactions,documents Social media, Web access logs,machine generated
Volume of data Gigabytes, Terabytes Petabytes, Exabytes
Velocity of data Ingest level is controlled Real-time unpredictable ingest
Variety of data Alphanumeric Audio, Video, Graphs, Text
Veracity of data Clean, more trustworthy Varies depending on source
Structure of data Well-Structured Semi- or Un-structured
Physical Storage of
Data In a Storage AreaNetwork Distributed clusters of commoditycomputers
Database
organization Relational databases NoSQL databases
Data Access SQL NoSQL such as Pig
Data Manipulation Conventional dataprocessing Parallel processing
Data Visualization Variety of tools measures
Database Tools Commercial systems Open-source - Hadoop, Spark
Total Cost of
Organization of the rest of the book
This book will cover applications, architectures, and the essential Big Data technologies. The rest of the book is organized as follows.
Section 1 will discuss sources, applications, and architectural topics. Chapter 2 will
discuss a few compelling business applications of Big Data, based on the understanding of the different sources and formats of data. Chapter 3 will cover some examples of
architectures used by many Big Data applications.
Section 2 will discuss the six major technology elements identified in the Big Data Ecosystem (Figure 1.5). Chapter 4 will discuss Hadoop and how its Distributed File system (HDFS) works. Chapter 5 will discuss MapReduce and how this parallel processing algorithm works. Chapter 6 will discuss NoSQL databases to learn how to structure the data into databases for fast access. Pig and Hive languages, for data access, will be included. Chapter 7 will cover streaming data, and the systems for ingesting and processing this data. This chapter will cover Spark, an integrated, in-memory processing toolset to manage Big Data. Chapter 8 will cover Data ingest system, with Apache Kafka. Chapter 9 will be a primer on Cloud Computing technologies used for renting storage and computers at third party locations.
Section 3 will include Primers and tutorials. Chapter 10 will present a case study on the web log analyzer, an application that ingests a log of a large number of web request entries every day and can create summary and exception reports. Chapter 11 will be a primer on data analytics technologies for analyzing data. A full treatment can be found in my book,
Data Analytics Made Accessible. Appendix 1 will be a tutorial on installing Hadoop
Review Questions
Q1. What is Big Data? Why should anyone care? Q2. Describe the 4V model of Big Data.
Q3. What are the major technological challenges in managing Big Data? Q4: What are the technologies available to manage Big Data?
Q5. What kind of analyses can be done on Big Data?
Q6: Watch Cloudera CEO present the evolution of Hadoop at
https://www.youtube.com/watch?v=S9xnYBVqLws . Why did people not pay attention to Hadoop and MapReduce when it was introduced? What implications does it have to
Liberty Stores Case Exercise: Step B1
Liberty Stores Inc. is a specialized global retail chain that sells organic food, organic clothing, wellness products, and education products to enlightened LOHAS
(Lifestyles of the Healthy and Sustainable) citizens worldwide. The company is 20 years old, and is growing rapidly. It now operates in 5 continents, 50 countries, 150 cities, and has 500 stores. It sells 20000 products and has 10000 employees. The company has revenues of over $5 billion and has a profit of about 5% of its revenue. The company pays special attention to the conditions under which the products are grown and produced. It donates about one-fifth (20%) from its pre-tax profits from global local charitable causes.
Section 1
This section covers three important high-level topics.
Chapter 2 will cover big data sources, and many applications in many
industries.
Chapter 2 - Big Data Applications
Introduction
If a traditional software application is a lovely cat, then a Big Data application is a powerful tiger. An ideal Big Data application will take advantage of all the richness of data and produce relevant information to make the organization responsive and successful. Big Data applications can align the organization with the totality of natural laws, the
source of all success.
Companies like the consumer goods giant, Proctor & Gamble, have inserted Big Data into all aspects of its planning and operations. The industrial giant, Volkswagen, asks all its business units to identify some realistic initiative using Big Data to grow their unit’s sales. The entertainment giant, Netflix, processes 400 billion user actions every day, and these are some of the biggest users of Big Data.
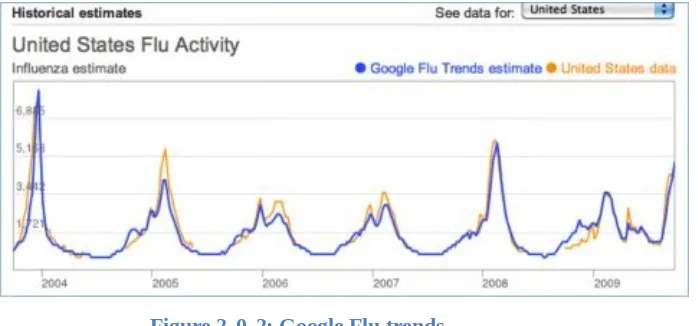
CASELET: Big Data Gets the Flu
Google Flu Trends was an enormously successful influenza forecasting service, pioneered by Google. It employed Big Data, such as the stream of search terms used in its ubiquitous Internet search service. The program aimed to better predict flu outbreaks using data and information from the U.S. Centers for Disease
Control and Prevention (CDC). What was most amazing was that this application was able to predict the onset of flu, almost two weeks before CDC saw it coming. From 2004 till about 2012 it was able to successfully predict the timing and
geographical location of the arrival of the flu season around the world.
Figure 2‑0‑2: Google Flu trends
However, it failed spectacularly to predict the 2013 flu outbreak. Data used to predict Ebola’s spread in 2014-15 yielded wildly inaccurate results, and created a major panic. Newspapers across the globe spread this application’s worst-case scenarios for the Ebola outbreak of 2014.
Google Flu Trends failed for two reasons: Big Data hubris, and algorithmic
dynamics, (a) The quantity of data does not mean that one can ignore foundational issues of measurement and construct validity and reliability and dependencies among data and (b) Google Flu Trends predictions were based on a commercial search algorithm that frequently changes, based on Google’s business goals. This uncertainty skewed the data in ways even Google engineers did not understand, even skewing the accuracy of predictions. Perhaps the biggest lesson is that there is far less information in the data, typically available in the early stages of an outbreak, than is needed to parameterize the test models.
Q1: What lessons would you learn from the death of a prominent and highly successful Big Data application?
Big Data Sources
Big Data is inclusive of all data about all activities everywhere. It can, thus, potentially transform our perspective on life and the universe. It brings new insights in real-time and can make life happier and make the world more productive. Big Data can, however, also bring perils—in terms of violation of privacy, and social and economic disruption.
People to People Communications
People and corporations increasingly communicate over electronic networks. Distance and time have been annihilated. Everyone communicates through phone and email. News travels instantly. Influential networks have expanded. The content of communication has become richer and multimedia. High-resolution cameras in mobile phones enable people to take pictures and videos, and instantly share them with friends and family. All these communications are stored in the facilities of many intermediaries, such as telecom and internet service providers. Social media is a new, but particularly transformative type of human-human communications.
Social Media
Social media platforms such as Facebook, Twitter, LinkedIn, YouTube, Flickr, Tumblr, Skye, Snapchat, and others have become an increasingly intimate part of modern life. These are among the hundreds of social media that people use and they generate huge streams of text, pictures, videos, logs, and other multimedia data.
People share messages and pictures through social media such as Facebook and YouTube. They share photo albums through Flickr. They communicate in short asynchronous
messages with each other on Twitter. They make friends on Facebook, and follow others on Twitter. They do video conferencing, using Skype and leaders deliver messages that sometimes go viral through social media. All these data streams are part of Big Data, and can be monitored and analyzed to understand many phenomena, such as patterns of
communication, as well as the gist of the conversations. These media have been used for a wide variety of purposes with stunning effects.
People to Machine Communications
Sensors and web are two of the kinds of machines that people communicate with. Personal assistants such as Siri and Cortana are the latest in man-machine communications as they try to understand human requests in natural language, and fulfil them. Wearable devices such as FitBit and smart watch are smart devices that read, store and analyze people’s personal data such as blood pressure and weight, food and exercise data, and sleep
patterns. The world-wide web is like a knowledge machine that people interact with to get answers for their queries.
Web access
The world-wide-web has integrated itself into all parts of human and machine activity. The usage of the tens of billions of pages by billions of web users generates huge amount of enormously valuable clickstream data. Every time a web page is requested, a log entry is generated at the provider end. The webpage provider tracks the identity of the
requesting device and user, and time and spatial location of each request. On the requester side, there are certain small pieces of computer code and data called cookies which track the webpages received, date/time of access, and some identifying information about the user. All the web access logs, and cookie records, can provide web usage records that can be analyzed for discovering opportunities for marketing purposes.
Machine to Machine (M2M) Communications
M2M communications is also sometimes called the Internet of Things (IoT). A trillion devices are connected to the internet and they communicate with each other or some master machines. All this data can be accessed and harnessed by makers and owners of those machines.
Machines and equipment have many kinds of sensors to measure certain environmental parameters, which can be broadcast to communicate their status. RFID tags and sensors embedded in machines help generate the data. Containers on ships are tagged with RFID tags that convey their location to all those who can listen. Similarly, when pallets of goods are moved in warehouses or large retain stores, those pallets contain electromagnetic (RFID) tags that convey their location. Cars carry an RFID transponder to identify themselves to automated tollbooths and pay the tolls. Robots in a factory, and internet-connected refrigerators in a house, continually broadcast a ‘heartbeat’ that they are functionally normally. Surveillance videos using commodity cameras are another major source of machine-generated data.
Automobiles contain sensors that record and communicate operational data. A modern car can generate many megabytes of data every day, and there are more than 1 billion motor vehicles on the road. Thus the automotive industry itself generate huge amounts of data. Self-driving cars would only add to the quantity of data generated.
RFID tags
An RFID tag is a radio transmitter with a little antenna that can respond to and
communicate essential information to special readers through Radio Frequency (RF) channel. A few years ago, major retailers such as Walmart decided to invest in RFID technology to take the retail industry to a new level. It forced their suppliers to invest in RFID tags on the supplied products. Today, almost all retailers and manufacturers have implemented RFID-tags based solutions.
Figure 2‑0‑4: A small passive RFID tag
active RFID tag has its own battery and storage, and can store and communicate a lot more information. Every reading of message from an RFID tag by an RF reader creates a log entry. Thus there is a steady stream of data from every reader as it records information about all the RFID tags in its area of influence. The records may be logged regularly, and thus there will be many more records than are necessary to track the location and
movement of an item. All the duplicate and redundant records is removed, to produce clean, consolidated data about the location and status of items.
Sensors
A sensor is a small device that can observe and record physical or chemical parameters. Sensors are everywhere. A photo sensor in the elevator or train door can sense if someone is moving and to thus keep the door from closing. A CCTV camera can record a video for surveillance purposes. A GPS device can record its geographical location every moment.
Figure 2‑0‑5: An embedded sensor
Big Data Applications
Monitoring and Tracking Applications
Public Health Monitoring
The US government is encouraging all healthcare stakeholders to establish a national platform for interoperability and data sharing standards. This would enable secondary use of health data, which would advance Big Data analytics and personalized holistic
precision medicine. This would be a broad-based platform like the Google Flu Trends case.
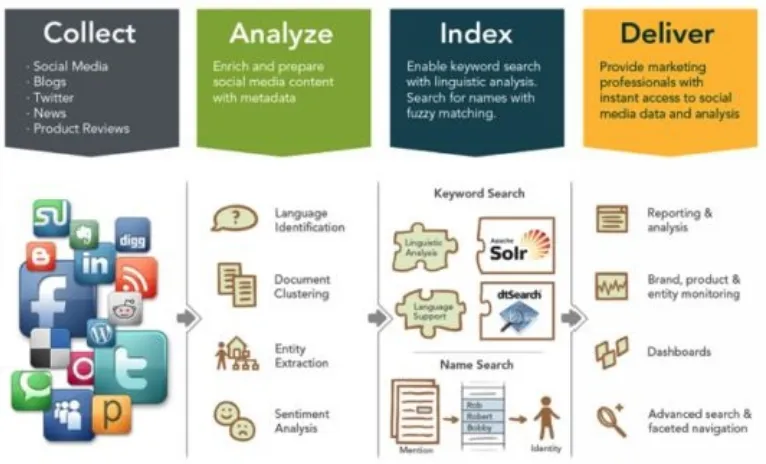
Consumer Sentiment Monitoring
Social Media has become more powerful than advertising. Many consumer goods companies have moved a bulk of their marketing budgets from traditional advertising media into social media. They have set up Big Data listening platforms, where Social Media data streams (including tweets and Facebook posts and blog posts) are filtered and analyzed for certain keywords or sentiments, by certain demographics and regions.
Actionable information from this analysis is delivered to marketing professionals for appropriate action, especially when the product is new to the market.
Figure 2‑0‑6: Architecture for a Listening Platform (source: Intelligenthq.com)
Asset tracking
The US Department of Defense is encouraging the industry to devise a tiny RFID chip that could prevent the counterfeiting of electronic parts that end up in avionics or circuit
the dashboard, as well as stored for later detailed analysis. Working with communicating devices, these sensors can produce a torrent of data.
Theft by visitors, shoppers and even employees, is a major source of loss of revenue for retailers. All valuable items in the store can be assigned RFID tags, and the gates of the store are equipped with RF readers. This helps secure the products, and reduce leakage (theft), from the store.
Supply chain monitoring
All containers on ships communicate their status and location using RFID tags. Thus, retailers and their suppliers can gain real-time visibility to the inventory throughout the global supply chain. Retailers can know exactly where the items are in the warehouse, and so can bring them into the store at the right time. This is particularly relevant for seasonal items that need to be sold on time, or else they will be sold at a discount. With item-level RFID tacks, retailers also gain full visibility of each item and can serve their customers better.
Electricity Consumption Tracking
Electric utilities can track the status of generating and transmission systems, and also measure and predict the consumption of electricity. Sophisticated sensors can help
monitor voltage, current, frequency, temperature, and other vital operating characteristics of huge and expensive electric distribution infrastructure. Smart meters can measure the consumption of electricity at regular intervals of one hour or less. This data is analyzed to make real-time decisions to maximize power capacity utilization and the total revenue generation.
Preventive Machine Maintenance
All machines, including cars and computers, will fail sometime, because one or more or their components will fail. Any precious equipment could be equipped with sensors. The continuous stream of data from the sensors data could be monitored and analyzed to forecast the status of key components, and thus, monitor the overall machine’s health. Preventive maintenance can be scheduled to reduce the cost of downtime.
Analysis and Insight Applications
Big Data can be structured and analyzed using data mining techniques to produce insights and patterns that can be used to make business better.
The Los Angeles Police Department (LAPD) invented the concept of Predictive Policing. The LAPD worked with UC Berkeley researchers to analyze its large database of 13 million crimes recorded over 80 years, and predicted the likeliness of crimes of certain types, at certain times, and in certain locations. They identified hotspots of crime where crimes had occurred, and where crime was likely to happen in the future. Crime patterns were mathematically modeled after a simple insight borrowed from a metaphor of
earthquakes and its aftershocks. In essence, it said that once a crime occurred in a location, it represented a certain disturbance in harmony, and would thus, lead to a greater
likelihood of a similar crime occurring in the local vicinity in the near future. The model showed for each police beat, the specific neighborhood blocks and specific time slots, where crime was likely to occur.
Figure 2‑0‑7: LAPD officer on predicting policing (Source: nbclosangeles.com)
By including the police cars’ patrol schedules in accordance with the model’s predictions, the LAPD was able to reduce crime by 12% to 26% for different categories of crime. Recently, the San Francisco Police Department released its own crime data for over 2 years, so data analysts could model that data and prevent future crimes.
Winning Political Elections
The US President, Barack Obama, was the first major political candidate to use Big Data in a significant way, in the 2008 elections. He is the first Big Data president. His campaign gathered data about millions of people, including supporters. They invented the “Donate Now” button for use in emails to obtain campaign contributions from millions of
using interactive applications. Obama himself used his twitter account to communicate his messages directly with his millions of followers.
After the elections, Obama converted the list of supporters to an advocacy machine that would provide the grassroots support for the President’s initiatives. Since then, almost all campaigns use Big Data. Senator Bernie Sanders used the same Big Data playbook to build an effective national political machine powered entirely by small donors. Analyst, Nate Silver, created sophistical predictive models using inputs from many political polls and surveys to win pundits to successfully predict winners of the US elections. Nate was however, unsuccessful in predicting Donald Trump’s rise, and that shows the limits of Big Data.
Personal Health
Correct diagnosis is the sine qua non of effective treatment. Medical knowledge and technology is growing by leaps and bounds. IBM Watson is a Big Data Analytics engine that ingests and metabolizes all the medical information in the world, and then applies it intelligently to an individual situation. Watson can provide a detailed and accurate medical diagnosis using current symptoms, patient history, medication history, and environmental trends, and other parameters. Similar products might be offered as an App to licensed doctors, and even individuals, to improve productivity and accuracy in health care.
New Product Development
These applications are totally new concepts that did not exist earlier.
Flexible auto insurance
An auto insurance company can use the GPS data from cars to calculate the risk of
Figure 2‑0‑8: GPS based tracking of vehicles Location-based retail promotion
A retailer, or a third-party advertiser, can target customers with specific promotions and coupons based on location data obtained through GPS, the time of day, the presence of stores nearby, and mapping it to the consumer preference data available from social media databases. Ads and offers can be delivered through mobile apps, SMS, and email. These are examples of mobile apps.
Recommendation service
Ecommerce is a fast growing industry in the last couple of decades. A variety of products are sold and shared over the internet. Web users’ browsing and purchase history on
ecommerce sites is utilized to learn about their preferences and needs, and to advertise relevant product and pricing offers in real-time. Amazon uses a personalized
recommendation engine system to suggest new additional products to consumers based on affinities of various products. Netflix also uses a recommendation engine to suggest
Conclusion
Review Questions
Q1: What are the major sources of Big Data? Describe a source of each type.
Q2: What are the three major types of Big Data applications? Describe two applications of each type.
Q3: Would it be ethical to arrest someone based on a Big Data Model’s prediction of that person likely to commit a crime?
Q4: An auto insurance company learned about the movements of a person based on the GPS installed in the vehicle. Would it be ethical to use that as a surveillance tool?
Liberty Stores Case Exercise: Step B2
The Board of Directors asked the company to take concrete and effective steps to become a data-driven company. The company wants to understand its customers better. It wants to improve the happiness levels of its customers and employees. It wants to innovate on new products that its customers would like. It wants to relate its charitable activities to the interests of its customers.
Q1: What kind of data sources should the company capture for this?
Chapter 3 - Big Data Architecture
Introduction
Big Data Application Architecture is the configuration of tools and modules to accomplish the whole task. An ideal architecture would be resilient, secure, cost-effective, and
CASELET: Google Query Architecture
Google invented the first Big Data architecture. Their goal was to gather all the information on the web, organize it, and search it for specific queries from millions of users. An additional goal was to find a way to monetize this service by serving relevant and prioritized online advertisements on behalf of clients. Google developed web crawling agents which would follow all the links in the web and make a copy of all the content on all the webpages it visited.
Google invented cost-effective, resilient, and fast ways to store and process all that exponentially growing data. It developed a scale-out architecture in which it could linearly increase its storage capacity by inserting additional computers into its computing network. The data files were distributed over the large number of machines in the cluster. This distributed files system was called the Google File system, and was the precursor to HDFS.
Google would sort or index the data thus gathered so it can be searched efficiently. They invented the key-pair NoSQL database architecture to store variety of data objects. They developed the storage system to avoid updates in the same place. Thus the data was written once, and read multiple times.
Figure 3‑0‑1: Google Query Architecture
The Hadoop ecosystem of data management tools like Hadoop distributed file system (HDFS), columnar database system like HBase, a querying tool such as Hive, and more, emerged from Google’s inventions. Storm is a streaming data technologies to produce instant results. Lambda Architecture is a Y-shaped
architecture that branches out the incoming data stream for batch as well as stream processing.
Q1: Why should Google publish its File System and the MapReduce parallel programming system and send it into open-source system?
Standard Big data architecture
Here is the generic Big Data Architecture introduced in Chapter 1. There are many sources of data. All data is funneled in through an ingest system. The data is forked into two sides: a stream processing system and a batch processing system. The outcome of these
processing can be sent into NoSQL databases for later retrieval, or sent directly for consumption by many applications and devices.
Figure 3‑0‑2: Big Data Application Architecture
A big data solution typically comprises these as logical layers. Each layer can be represented by one or more available technologies.
Big data sources: The sources of data for an application depends upon what data is required to perform the kind of analyses you need. The various sources of Big data were described in chapter 2. The data will vary in origin, size, speed, form, and function, as described by the 4 Vs in chapter 1. Data sources can be internal or external to the
organization. The scope of access to data available could be limited. The level of structure could be high or low. The speed of data and its quantity will also by high or low
depending upon the data source.
Data ingest layer: This layer is responsible for acquiring data from the data sources. The data is through a scalable set of input points that can acquire at various speeds and in various quantities. The data is sent to a batch processing system, a stream processing system, or directly to a storage file system (such as HDFS). Compliance regulations and governance policies impact what data can be stored and for how long.
that would work on that data, and the format of the desired outcomes. The output of this layer could be sent for instant reporting, or stored in a NoSQL databases for an on-demand report, for the client.
Streaming Processing layer: This layer receives data directly from the ingest point. Data is processed using parallel programming techniques (such as MapReduce) to process it in real time, and produce the desired results. This layer thus needs to understand the data sources and data types extremely well, and the super-light algorithms that would work on that data to produce the desired results. The outcome of this layer too could be stored in the NoSQL Databases.
Data Organizing Layer: This layer receives data from both the batch and stream
processing layers. Its objective is to organize the data for easy access. It is represented by NoSQL databases. SQL-like languages like Hive and Pig can be used to easily access data and generate reports.
Data Consumption layer: This layer consumes the output provided by the analysis layers, directly or through the organizing layer. The outcome could be standard reports, data analytics, dashboards and other visualization applications, recommendation engine, on mobile and other devices.
Infrastructure Layer: At bottom there is a layer that manages the raw resources of storage, compute, and communication. This is increasingly provided through a cloud computing paradigm.
Big Data Architecture examples
Every major organization and applications has a unique optimized infrastructure to suit its specific needs. Here below are some architecture examples from some very prominent users and designers of Big Data applications.
IBM Watson
IBM Watson uses Spark to manage incoming data streams. It also uses Spark’s Machine Learning library (MLLib) to analyze data and predict diseases.
Netflix
This is one of the largest providers of online video entertainment. They handle 400 Billion online events per day. As a cutting-edge user of big data technologies, they are constantly innovating their mix of technologies to deliver the best performance. Kafka is the common messaging system for all incoming requests. They host the entire infrastructure on
(Source: Netflix)
Ebay
Ebay is the second-largest Ecommerce company in the world. It delivers 800 million listings from 25 million sellers to 160 million buyers. To manage this huge stream of activity, EBay uses a stack of Hadoop, Spark, Kafka, and other elements. They think that Kafka is the best new thing for processing data streams.
VMWare
The Weather Company
The Weather company serves weather data globally through websites and mobile apps. It uses streaming architecture using Apache Spark.
TicketMaster
The goal of this professional networking company is to maintain an efficient system for processing the streaming data and make the link options available in real-time.
Paypal
CERN
Conclusion
Review Questions
Q1: Describe the Big Data processing architecture.
Q2: What are Google’s contributions to Big data processing?
Liberty Stores Case Exercise: Step B3
The wants to build a scalable and futuristic platform for its Big Data.
Section 2
This section covers the important Big Data technologies defined in the Big
Data architecture specified in chapter 3.
Chapter 4 will cover Hadoop and its Distributed File System (HDFS)
Chapter 5 will cover the parallel processing algorithm, MapReduce.
Chapter 6 will NoSQL databases such as HBase and Cassandra. It will also
cover Pig and Hive languages used for accessing those databases.
Chapter 7 will cover Spark, a fast and integrated streaming data management
platform.
Chapter 4: Distributed Computing using Hadoop
Introduction
Hadoop Framework
The Apache Hadoop distributed computing framework is composed of the following modules:
1. Hadoop Common – contains libraries and utilities needed by other Hadoop modules
2. Hadoop Distributed File System (HDFS) – a distributed file-system that stores data on commodity machines, providing very high aggregate bandwidth across the cluster
3. YARN – a resource-management platform responsible for managing computing resources in clusters and using them for scheduling of users’ applications, and 4. MapReduce – an implementation of the MapReduce programming model for large
scale data processing.
HDFS Design Goals
The Hadoop distributed file system (HDFS) is a distributed and scalable file-system. It is designed for applications that deal with large data sizes. It is also designed to deal with mostly immutable files, i.e. write data once, but read it many times.
HDFS has the following major design goals:
1. Hardware failure management – it will happen, and one must plan for it. 2. Huge volume – create capacity for large number of huge file sizes, with fast
read/write throughput
3. High speed – create a mechanism to provide low latency access to streaming applications
4. High variety – Maintain simple data coherence, by writing data once but reading many times.
5. Open-source – Maintain easy accessibility of data using any hardware, software, and database platform
Master-Slave Architecture
Hadoop is an architecture for organizing computers in a master-slave relationship that helps achieve great scalability in processing. An HDFS cluster has two types of nodes operating in a master−worker pattern: a single master node (called NameNode), and a large number of slave worker nodes (called DataNodes).A small Hadoop cluster includes a single master and multiple worker nodes. A large Hadoop cluster would consist of a
master and thousands of small ordinary machines as worker nodes.
Figure 4‑0‑1: Master-Slave Architecture
The master node manages the overall file system, its namespace, and controls the access to files by clients. The master node is aware of the data-nodes: i.e. what blocks of which file are stored on which data node. It also controls the processing plan for all applications running on the data on the cluster. There is only one master node. Unfortunately, that makes it a single point of failure. Therefore, whenever possible, the master node has a hot backup just in case the master node dies unexpectedly. The master node uses a transaction log to persistently record every change that occurs to file system metadata.
Figure 4‑0‑2: Hadoop Architecture (Source: Hadoop.apache.org)
The Namenode stores all relevant information about all the DataNodes, and the files stored in those DataNodes. The NameNode will contain:
- For every DataNode, its name, Rack, Capacity, and Health
- For every File, its Name, replicas, Type, Size, TimeStamp, Location, Health, etc.
It a DataNode fails, there is no serious problem. The data on the failed dataNode will be accessed from its replicas on other DataNodes. The failed DataNode can be automatically recreated on another machine, by writing all those file blocks of from the other healthy replicas. Each data-node sends a heartbeat message to the name-node periodically. Without this message, the DataNode is assumed to be dead. The DataNode replication effort would automatically kick-in to replace the dead data-node.
The file system has a set of features and capabilities to completely hide the splintering and scattering of data, and enable the user to deal with the data at a high, logical level.
The NameNode tries to ensure that files are evenly spread across the data-nodes in the cluster. That balances the storage and computing load, and also limits the extent of loss from the failure of a node. The NameNode also tries to optimize the networking load. When retrieving data or ordering the processing, the NameNode tries to pick Fragments from multiple nodes to balance the processing load and speed up the totally processing effort. The NameNode also tries to store fragments of files on the same node for speed of read and writing. Processing is done on the node where the file fragment is stored.
Block system
HDFS stores large files (typically gigabytes to terabytes) by storing segments (called blocks) of the file across multiple machines. A block of data is the fundamental storage unit in HDFS. Data files are described, read and written in block-sized granularity. All storage capacity and file sizes are measured in blocks. A block ranges from 16-128MB in size, with a default block size of 64MB. Thus, an HDFS file is chopped up into 64 MB chunks, and if possible, each chunk will reside on a different DataNode.
Every data file takes up a number of blocks depending upon its size. Thus a 100 MB file will occupy two blocks (100MB divided by 64MB), with some room to spare. Every storage disk can accommodate a number of blocks depending upon the size of the disk. Thus a 1 Terabyte storage will have 16000 blocks (1TB divided by 64MB).
Ensuring Data Integrity
Hadoop ensures that no data will be lost or corrupted, during storage or processing. The files are written only once, and never updated in place. They can be read many times. Only one client can write or append to a file, at a time. No concurrent updates are allowed. If a data is indeed lost or corrupted, or if a part of the disk gets corrupted, a new healthy replica for that lost block will be automatically recreated by copying from the replicas on other data-nodes. At least one of the replicas is stored on a data-node on a different rack. This guards against the failure of the rack of nodes, or the networking router, on it.
Installing HDFS
It is possible to run Hadoop on an in-house cluster of machines, or on the cloud
inexpensively. As an example, The New York Times used 100 Amazon Elastic Compute Cloud (EC2) instances (DataNodes) and a Hadoop application to process 4 TB of raw image TIFF data stored in Amazon Simple Storage Service (S3) into 11 million finished
PDFs in the space of 24 hours at a computation cost of about $240 (not including
bandwidth). See Chapter 9 for a primer on Cloud Computing. See Appendix 1 for a step-by-step tutorial on installing Hadoop on Amazon EC2.
Hadoop is written in Java. Hadoop also requires a working Java installation. Installing Hadoop takes a lot of resources. For example, all information about fragments of files needs to be in Name-node memory. A thumb rule is that Hadoop needs approximately 1GB memory to manage 1M file fragments. Many easy mechanisms exist to install the entire Hadoop stack. Using a GUI such as Cloudera Resources Manager to install a Cloudera Hadoop stack is easy. This stack includes, HDFS, and many other related components, such as HBase, Pig, YARN, and more. Installing it on a cluster on a cloud services provider like AWS is easier than installing Java Virtual Machines (JVMs) on HDFS can be installed by using Cloudera GUI Resources Manager. If doing from command line, download Hadoop from one of the Apache mirror sites
Hadoop is written in Java. And most access to files is provided through Java abstract class org.apache.hadoop.fs.FileSystem. HDFS can be mounted directly with a Filesystem in Userspace (FUSE) virtual file system on Linux and some other Unix systems. File access can be achieved through the native Java application programming interface (API).
Another API, called Thrift, helps to generate a client in the language of the users’ choosing (such as C++, Java, Python). When the Hadoop command is invoked with a classname as the first argument, it launches a Java virtual machine (JVM) to run the class, along with the relevant Hadoop libraries (and their dependencies) on the classpath.
HDFS has a UNIX-like command like interface (CLI). Use sh shell to communicate with Hadoop. HDFS has UNIX-like permissions model for files and directories. There are three progressively increasing levels of permissions: read (r), write (w), and execute (x). Create a hduser, and communicate using ssh shell on the local machine.
% hadoop fs -help ## get detailed help on every command.
Reading and Writing Local Files into HDFS
input/output stream. Copying a file from the local filesystem to HDFS can be done by: % hadoop fs -copyFromLocal path/filename
Reading and Writing Data Streams into HDFS
Read a file from HDFS by using a java.net.URL object to open a stream to read the data requires a short script, as below.
InputStream in = null; Start {
instream = new URL(“hdfs://host/path”).openStream(); // details of process in } Finish { IOUtils.closeStream(instream); }
A simple method to create a new file is as follows:
public FSDataOutputStream create(Path p) throws IOException Data can be appended to an existing file using the append() method:
public FSDataOutputStream append(Path p) throws IOException A directory can be created by a simple method:
public boolean mkdirs(Path p) throws IOException List the contents of a directory using:
public FileStatus[] listStatus(Path p) throws IOException
Sequence Files
The incoming data files can range from very small to extremely large, and with different structures. Big Data files are therefore organized quite differently to handle the diversity of file sizes and type. Large files are stored as HDFS files, with FileFragments distributed across the cluster. However, smaller files should be bunched together into single segment for efficient storage.
Sequence Files are a specialized data structure within Hadoop to handle smaller files with smaller record sizes. Sequence File uses a persistent data structure for data available in key-value pair format. These help efficiently store smaller objects. HDFS and
MapReduce are designed to work with large files, so packing small files into a Sequence File container, makes storing and processing the smaller files more efficient for HDFS and MapReduce.
Sequence files are row-oriented file formats, which means that the values for each row are stored contiguously in the file. This formats are appropriate when a large number of
YARN
YARN (Yet Another Resource Negotiator) is the architectural center of Hadoop, It is often characterized as a large-scale, distributed operating system for big data applications.
YARN manages resources and monitors workloads, in a secure multi-tenant
environment, while ensuring high availability across multiple Hadoop clusters. YARN also brings great flexibility as a common platform to run multiple tools and applications such as interactive SQL (e.g. Hive), real-time streaming (e.g. Spark), and batch processing (MapReduce), to work on data stored in a single HDFS storage platform. It brings clusters more scalability to expand beyond 1000 nodes, it also improves cluster utilization through dynamic allocation of cluster resources to various applications.
Figure 4‑0‑3: Hadoop Distributed Architecture including YARN
The Resource Manager in YARN has two main components: Scheduler and Applications Manager.
YARN Scheduler allocates resources to the various requesting applications. It does so based on an abstract notion of a resource Container which incorporates elements such as Memory, CPU, Disk storage, Network, etc. Each machine also has a NodeManager that manages all the Containers on that machine, and reports status on resources and
Containers to the YARN Scheduler.
YARN Applications Manager accepts new job submissions from the client. It then
requests a first resource Container for the application-specific ApplicationMaster program, and monitors the health and execution of the application. Once running, the
Conclusion
Review Questions
Q1: How does Hadoop differ from a traditional file system? Q2: What are the design goals for HDFS?