ISBN 978-602-74702-2-4
OUTLOOK ENERGI
INDONESIA ENERGY OUTLOOK 2017
Inisiatif Pengembangan Teknologi Energi Bersih
Clean Energy Technology Development Initiatives
Editor:
Ira Fitriana
Anindhita
Agus Sugiyono
Laode M.A. Wahid
Adiarso
This publication is available on the WEB at:
www.bppt.go.id
PUSAT TEKNOLOGI SUMBER DAYA ENERGI DAN INDUSTRI KIMIA
CENTER FOR TECHNOLOGY OF ENERGY RESOURCES AND CHEMICAL
BADAN PENGKAJIAN DAN PENERAPAN TEKNOLOGI
AGENCY FOR THE ASSESSMENT AND APPLICATION OF TECHNOLOGY
ii
OUTLOOK ENERGI INDONESIA 2017
INDONESIA ENERGY OUTLOOK 2017
Inisiatif Pengembangan Teknologi Energi Bersih
Clean Energy Technology Development Initiatives
ISBN 978-602-74702-2-4
© Hak cipta dilindungi oleh undang-undang /
© All rights reserved
Boleh dikutip dengan menyebut sumbernya / May be cited with crediting the source
Diterbitkan oleh /
Published by
Pusat Teknologi Sumber Daya Energi dan Industri Kimia (PTSEIK)
Center for Technology of Energy Resources and Chemical Industry
Badan Pengkajian dan Penerapan Teknologi (BPPT)
Agency for the Assessment and Application of Technology
Gedung BPPT II, Lantai 11
BPPT Building II, 11th floor
Jl. M.H. Thamrin 8, Jakarta 10340
Telp. : (021) 7579-1357
Fax
: (021) 7579-1357
email : [email protected]
Perpustakaan Nasional RI: Katalog Dalam Terbitan (KDT)
Library of Congress Cataloging-in-Publication Data
Outlook energi indonesia 2017 : inisiatif
pengembangan teknologi energi bersih = Indonesia energy
outlook 2017 : clean energy technology development
initiatives / editor, Ira Fitriana ... [et al.]. -- Jakarta : Pusat
Teknologi Sumberdaya Energi dan Industri Kimia BPPT, 2017.
83 hlm. ; 29 cm.
ISBN 978-602-74702-2-4
1. Indonesia -- Politik energi. I. Ira Fitriana.
iii
OUTLOOK ENERGI INDONESIA 2017Pemerintah terus berupaya untuk meningkatkan pemanfaatan energi bersih dalam rangka mendukung
Paris
Agreement
serta untuk memenuhi komitmen yang tertuang dalam
Nationally Determined Contribution
(NDC).
Sejalan dengan komitmen tersebut, Badan Pengkajian dan Penerapan Teknologi (BPPT) dalam penerbitan buku
Outlook Energi Indonesia 2017 (BPPT-OEI 2017) tahun ini mengambil tema khusus “Inisiatif Pengembangan
Teknologi Energi Bersih”. Tema ini akan membahas peran sektor energi dalam turut serta menciptakan
pembangunan rendah karbon di Indonesia melalui pemanfaatan energi bersih.
Buku Outlook Energi Indonesia setiap tahun secara rutin diterbitkan oleh BPPT dan tahun ini merupakan terbitan
yang kesembilan. Buku ini tidak hanya berisi proyeksi kebutuhan dan penyediaan energi untuk jangka panjang,
tetapi juga membahas berbagai opsi untuk pertumbuhan ekonomi dengan skenario dasar dan skenario tinggi
dan opsi-opsi untuk pemanfaatan teknologi. Pembahasan dimulai dengan kondisi sektor energi saat ini serta
tren ke depan. Berdasarkan kondisi tersebut diproyeksikan kebutuhan energi serta pasokan energi fosil dan
energi baru terbarukan. Ketenagalistrikan dibahas dalam bab tersendiri karena merupakan sektor penting yang
terkait dengan kualitas hidup yang lebih baik. Sesuai dengan tema tahun ini, juga dibahas analisis biaya dan
manfaat pemanfaatan energi bersih seperti: pembangkit listrik energi terbarukan, bahan bakar nabati, mobil
listrik, industri hijau dan bangunan hijau serta indikator-indikator penting mengenai pemanfaatan energi bersih.
Mudah-mudahan buku BPPT-OEI 2017 ini dapat menjadi bahan acuan bagi Pemerintah dan masyarakat luas
dalam pengembangan dan pengelolaan energi di Indonesia. Saran dan kritik yang membangun dari para
pembaca saya harapkan sebagai masukan untuk kesempurnaan pada penerbitan buku berikutnya. Saya juga
mengucapkan terima kasih kepada Tim Penyusun dan semua pihak yang telah memberi bantuan sehingga buku
ini dapat diterbitkan.
Jakarta, Oktober 2017
Badan Pengkajian dan Penerapan Teknologi
Kepala
Dr. Ir. Unggul Priyanto, M.Sc.
iv
FOREWORD
The Government is continuously working to improve the utilization of clean energy in order to support the Paris Agreement and
to fulfill the commitments set forth in the Nationally Determined Contribution (NDC). In line with the commitment, the Agency for the Assessment and Application of Technology (BPPT) in the publication of Outlook Energy Indonesia 2017 (BPPT-OEI 2017) took the special theme “Clean Energy Technology Development Initiatives”. This theme discussed role of energy sector in low-carbon development in Indonesia through the utilization of clean energy.
The Indonesia Energy Outlook book is annually published by BPPT and this year is the ninth edition. This book not only consists
of long term projection of energy demand and supply but also discusses various options for economic growth with base scenario
and high scenario as well as options for technology utilization. The discussion begins with the current condition of energy sector and the future trend. Based on these conditions, the energy demand and supply are projected for both fossil and renewable energy. Electricity is discussed in a separate chapter as it is an important sector related to a better quality of life. In line with this year’s theme, we also discussed cost and benefits analysis of clean energy utilization such as renewable energy power plant, biofuels, electric vehicles, green industry, green building and important indicators of clean energy utilization.
I am confident that BPPT-OEI 2017 can be a reference for the Government and the community in the area of energy development and management in Indonesia. Suggestions and constructive criticisms as input to enhance the publication would be greatly appreciated. I also would like to thank the drafting team and all parties who have provided assistance so that this book can be published.
Jakarta, October 2017
Agency for the Assessment and
Application of Technology
Chairman,
v
OUTLOOK ENERGI INDONESIA 2017PENGARAH / STEERING COMMITTEE
Kepala BPPT Chairman of BPPT
Dr. Ir. Unggul Priyanto, M.Sc.
Deputi Kepala BPPT Bidang Teknologi Informasi, Energi dan Material (TIEM) Deputy Chairman for Information, Energy and Material Technology
Dr. Ir. Hammam Riza, M.Sc.
PENANGGUNGJAWAB / PERSON IN CHARGE
Direktur Pusat Teknologi Sumber Daya Energi dan Industri Kimia (PTSEIK) Director of Center for Technology of Energy Resources and Chemical Industry Dr. Adiarso
Kepala Bagian Program dan Anggaran / Head of Program and Budget Division Dr. Edi Hilmawan, B.Eng., M.Eng.
Kepala Program Bioenergi / Head of Bioenergy Program Dr. Sri Djangkung Sumbogo Murti, B.Eng.
KOORDINATOR / COORDINATOR
Ketua Kelompok Perencanaan Energi / Group Leader of Energy Planning Ira Fitriana, S.Si, M.Sc.
TIM PENYUSUN / AUTHORS
Kebijakan Energi : Ir. Agus Sugiyono, M.Eng.
Energy Policy Ratna Etie Puspita Dewi, S.T., M.Sc. Kebutuhan dan Penyediaan Energi : Ira Fitriana, S.Si, M.Sc.
Energy Demand and Supply Dra. Nona Niode Minyak dan Gas Bumi : Ir. Erwin Siregar
Oil and Gas Ari Kabul Paminto, S.T.
Batubara : Ir. Irawan Rahardjo, M.Eng.
Coal Ir. Endang Suarna, M.Sc.
Ketenagalistrikan : Drs. Yudiartono, M.M.
Electricity Prima Zuldian, S.T., M.T.
Energi Bersih : Ir. La Ode M. Abdul Wahid
Clean Energy Prima Trie Wijaya, S.Kom., M.Kom.
Desy Septriana, S.T. Database dan Pemodelan : Anindhita, S.Si, M.S. Database and Modelling Ira Fitriana, S.Si, M.Sc.
Drs. Yudiartono, M.M. Grafik dan Layout : Nini Gustriani, S.E.
Layout and Graphic
INFORMASI / INFORMATION
Program Perencanaan Energi
Pusat Teknologi Sumber Daya Energi dan Industri Kimia (PTSEIK) Badan Pengkajian dan Penerapan Teknologi (BPPT)
Gedung 625, Klaster Energi, Kawasan Puspiptek, Kota Tangerang Selatan Telp./Fax. (021) 7579-1357
Email: [email protected]
TIM PENYUSUN
vi
Kami mengucapkan terima kasih kepada para
profesional di bawah ini yang telah bersedia menjadi
narasumber maupun memberikan data-data terkini.
• Ir. Agus Cahyono Adi, M.T., Kepala Biro Perencanaan, Kementerian Energi dan Sumber Daya Mineral.
• Ir. Susiani Juliati, Kepala Bidang Energi, Dinas Energi dan Sumber Daya Mineral, Provinsi Kalimantan Barat.
• Bapak Gurit Bagaskoro, Kepala Sub-Divisi Perencanaan Sistem, PLN Wilayah Kalimantan Barat.
• Ir. Brahmantyo K. Gunawan, M.Eng., Manajer Senior Keteknikan Geologi dan Geofisika Minyak dan Gas Bumi Konvensional dan Non Konvensional, SKK Migas.
• Ir. Bayu Wahyudiono, M.M., Kepala Sub Direktorat Pengembangan Wilayah Kerja Migas Non Konvensional, Direktorat Jenderal Migas, Kementerian ESDM.
• Gema Wahyudi Purnama, M.T., PT Pertamina Hulu Energi.
• Dr. Djarot Tri Wardhono, ST. MT., Kepala Bidang Pengelolaan Lingkungan Hidup Transportasi, Pusat Pengelolaan Transportasi Berkelanjutan, Kementerian Perhubungan.
• Ir. Imran Rasyid, MBA, Kepala Pusat Penelitian dan Pengembangan Perhubungan Antarmoda, Kementerian Perhubungan.
• Bapak Arief Sugiyanto, System Planning Division, Deputy Manager, PT PLN (Persero).
• Ibu Erlyana Anggita Sari, Green Building Council Indonesia.
• Ir. Maritje Hutapea, Direktur Aneka Energi Baru dan Terbarukan, Kementerian ESDM.
UCAPAN TERIMA KASIH
ACKNOWLEDGMENT
We would like to express appreciation to the following
professionals who have shared their valuable
knowledge and providing the latest data.
• Ir. Agus Cahyono Adi, M.T., Head of Planning
Bureau, MEMR.
• Ir. Susiani Juliati, Head of Energy Division,
Regional Office of Energy and Mineral Resources,
West Kalimantan Province.
• Mr. Gurit Bagaskoro, Head of System Planning
Sub-Division, PLN Region West Kalimantan.
• Ir. Brahmantyo K. Gunawan, M.Eng., Senior
Manager for Engineering and Geophysics of
Conventional and Non-Conventional Oil and Gas,
SKK Migas.
• Ir. Bayu Wahyudiono, M.M., Head of
Sub-Directorate of Working Areas Development for
Non-Conventional Oil and Gas, Directorate
General of Oil and Gas, MEMR.
• Gema Wahyudi Purnama, M.T., PT Pertamina
Hulu Energi.
• Dr. Djarot Tri Wardhono, ST. MT., Head of
Transportation Environmental Management
Division, Center for Sustainable Transportation
Management, Ministry of Transportation.
• Ir. Imran Rasyid, MBA, Head of Center for R&D
of Inter-modal Transportation, Ministry of
Transportation.
• Mr. Arief Sugiyanto, System Planning Division,
Deputy Manager, PT PLN (Persero).
• Mrs. Erlyana Anggita Sari, Green Building Council
Indonesia.
vii
OUTLOOK ENERGI INDONESIA 2017Sambutan /
Foreword
.
.
.
.
.
.
.
.
.
.
Tim Penyusun /
Authors
.
.
.
.
.
.
.
.
.
.
Ucapan Terima Kasih /
Acknowledgment
.
.
.
.
.
.
.
Daftar Isi /
Table of Contents
.
.
.
.
.
.
.
.
.
Bab 1 Pendahuluan
/
Introduction
.
.
.
.
.
.
.
.
1.1
Latar Belakang /
Background
.
.
.
.
.
.
.
1.2
Kebijakan Energi Saat Ini /
Current Energy Policies
.
.
.
.
.
1.3
Model, Skenario, dan Kasus /
Model, Scenarios, and Cases
.
.
.
.
1.3.1 Model Kebutuhan Energi /
Energy Demand Model
.
.
.
.
1.3.2 Model Penyediaan Energi /
Energy Supply Model
.
.
.
.
Bab 2 Kebutuhan Energi
/
Energy Demand
.
.
.
.
.
.
.
2.1
Kebutuhan Energi Per Jenis /
Energy Demand by Type
.
.
.
.
2.2
Kebutuhan Energi Per Sektor /
Energy Demand by Sector
.
.
.
.
Bab 3 Penyediaan Energi
/
Energy Supply
.
.
.
.
.
.
.
3.1
Potensi Sumber Daya Energi /
Energy Resource Potential
.
.
.
3.1.1
Energi Fosil /
Fossil Energy
.
.
.
.
.
.
3.1.2
Energi Baru dan Terbarukan /
New and Renewable Energy
.
.
.
3.2
Minyak Bumi dan BBM /
Crude Oil and Oil Fuels
.
.
.
.
.
3.2.1
Neraca Minyak Bumi /
Crude Oil Balance
.
.
.
.
.
3.2.2
Neraca Bahan Bakar Minyak /
Oil Fuels Balance
.
.
.
.
3.2.3
Pemanfaatan Bahan Bakar Minyak /
Oil Fuels Utilization
.
.
.
3.3
Gas Bumi, LNG dan LPG /
Natural Gas, LNG and LPG
.
.
.
.
3.3.1
Gas Bumi /
Natural Gas
.
.
.
.
.
.
.
3.3.2
LPG
.
.
.
.
.
.
.
.
.
3.4
Batubara /
Coal
.
.
.
.
.
.
.
.
.
3.4.1
Neraca Batubara /
Coal Balance .
.
.
.
.
.
3.4.2
Pemanfaatan Batubara /
Coal Utilization
.
.
.
.
.
3.4.3
Kasus Pembatasan Ekspor Batubara /
Case of Coal Export Restrictions
.
3.4.4
Kasus Pengurasan Cadangan Batubara /
Case of Coal Resource Depletion
.
3.5
Energi Baru dan Terbarukan /
New and Renewable Energy .
.
.
.
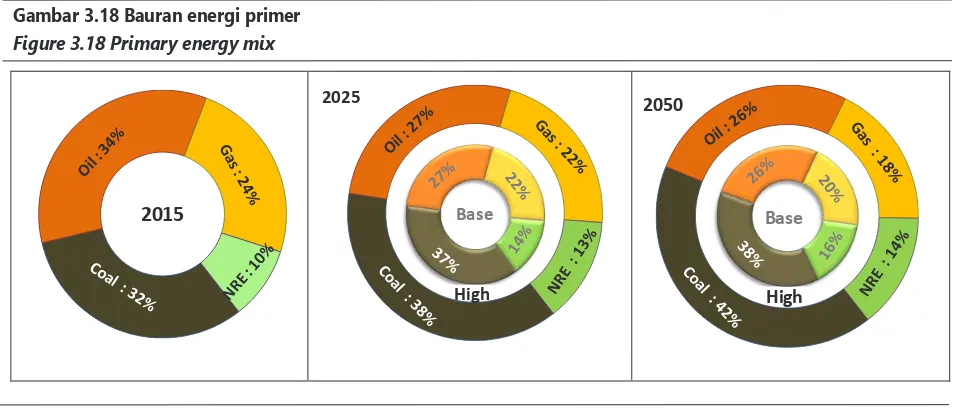
3.6
Energi Primer /
Primary Energy
.
.
.
.
.
.
.
3.6.1
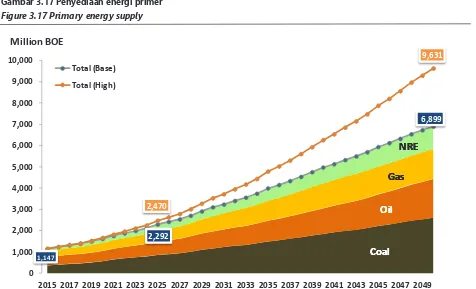
Penyediaan Energi Primer /
Primary Energy Supply
.
.
.
.
3.6.2
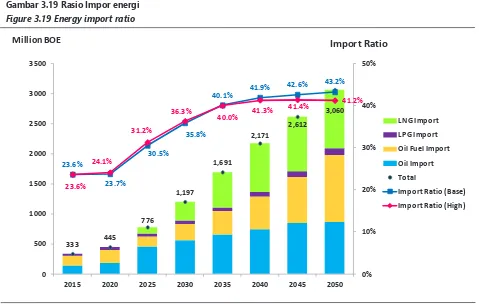
Rasio Impor Energi /
Energy Import Ratio
.
.
.
.
.
3.6.3
Neraca Energi Primer /
Primary Energy Balance
.
.
.
.
Bab 4 Ketenagalistrikan
/
Electricity
.
.
.
.
.
.
.
.
4.1
Total Produksi dan Kebutuhan Listrik Per Sektor /
Total Production and Demand of
Electricity by Sector
.
.
.
.
.
.
.
.
4.2
Kapasitas Pembangkit Listrik Jangka Pendek/
Short Term Generating Capacity
.
.
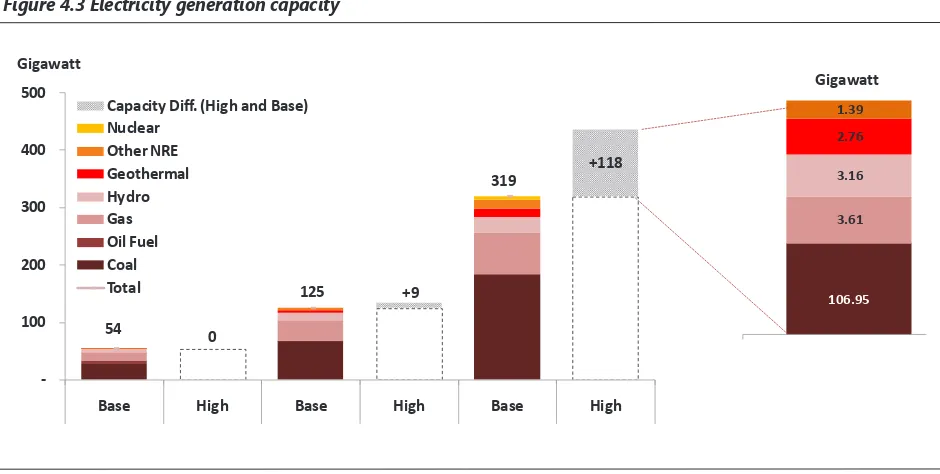
4.3
Kapasitas Pembangkit Listrik /
Power Plant Capacity
.
.
.
.
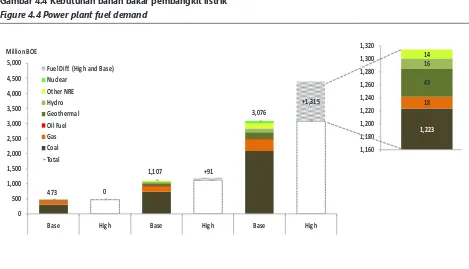
4.4
Kebutuhan Bahan Bakar Pembangkit Listrik /
Power Plant Fuel Demand
.
.
.
DAFTAR ISI
TABLE OF CONTENTS
iii
v
vi
vii
1
2
3
5
5
6
9
10
12
17
18
18
19
21
21
22
24
25
25
28
29
29
30
30
32
33
35
35
36
37
41
viii
4.5
Tambahan Kapasitas Pembangkit Listrik /
Additional Capacity of Power Plant
.
Bab 5 Inisiatif Pengembangan Teknologi Energi Bersih
/
Clean Energy Technology
Development Initiative
.
.
.
.
.
.
.
.
.
5.1 Kebijakan Pengembangan Energi Bersih /
Clean Energy Development Policy
.
.
5.2
Melacak Perkembangan Energi Bersih /
Tracking Clean Energy Progress
.
.
5.3
Analisis Pemanfaatan Energi Bersih /
Analysis of Clean Energy Utilization .
.
5.3.1
Kasus Optimalisasi Pembangkit Listrik EBT /
Case of NRE Power
Plant Optimization
.
.
.
.
.
.
.
5.3.2
Kasus Peningkatan Pemanfaatan Bahan Bakar Nabati
/ Case of
Increasing Biofuel Utilization
.
.
.
.
.
.
5.3.3
Kasus Penerapan Kendaraan Listrik /
Case of Electric Vehicles
Application
.
.
.
.
.
.
.
.
5.3.4
Kasus Penerapan Industri Hijau di Industri Pulp dan Kertas serta Industri
Semen /
Case of Green Industry Implementation in Pulp and Paper
Industry, and Cement Industry .
.
.
.
.
.
5.3.5
Kasus Penerapan Bangunan Hijau di Sektor Komersial /
Case of
Green Building Implementation in Commercial Sector
.
.
.
5.4
Emisi Gas Rumah Kaca /
Greenhouse Gas Emission .
.
.
.
.
5.4.1
Emisi GRK Skenario Dasar dan Skenario Tinggi /
Base Scenario
High Scenario GHG Emission
.
.
.
.
.
.
5.4.2
Emisi GRK dari Pemanfaatan Energi Bersih / GHG Emission from
Clean Energy Utilization .
.
.
.
.
.
.
5.5
Ketergantungan Impor Energi /
Energy Import Dependency .
.
.
.
5.6
Indeks Energi Bersih /
Clean Energy Index .
.
.
.
.
.
Bab 6 Penutup
/
Closing
.
.
.
.
.
.
.
.
.
Daftar Pustaka /
References
.
.
.
.
.
.
.
.
.
46
47
48
50
51
51
54
57
61
65
70
70
Introduction
21.1 Latar Belakang
Background
Konferensi Tingkat Tinggi Perubahan Iklim Dunia atau UNFCCC COP21 yang dilaksanakan tahun 2015 di Paris bertujuan untuk menjaga kenaikan suhu rata-rata dunia dibawah 2°C, dibandingkan suhu sebelum masa Revolusi Industri, dan mendorong upaya lebih lanjut hingga kenaikan suhu tidak lebih dari 1,5°C. Pada konferensi tersebut Indonesia berkomitmen untuk menurunkan emisi gas rumah kaca (GRK) pada tahun 2020 sebesar 26% dengan upaya sendiri, dan hingga 41% dengan bantuan internasional yang dituangkan dalam NDC (Nationally Determined Contribution). Pemerintah sudah mengeluarkan berbagai kebijakan “transisi energi” dengan isu utama meningkatkan penggunaan teknologi energi rendah karbon atau yang sering disebut teknologi energi bersih. Namun seberapa besar dampak kebijakan ini terhadap target penurunan emisi GRK perlu dikaji mendalam. Lebih lanjut, jenis teknologi bersih apa saja yang layak diterapkan di Indonesia juga perlu dianalisis.
Selain emisi, ketergantungan Indonesia terhadap minyak bumi dan batubara yang masih sangat besar patut mendapat perhatian. Keterbatasan sumberdaya energi fosil menjadikan peralihan ke energi baru dan terbarukan suatu keharusan, bukan hanya sekedar pilihan. Gas non konvensional seperti shale gas dan CBM (Coal Bed Methane)
adalah contoh energi baru yang mempunyai potensi untuk
memperkuat divesifikasi dan ketahanan energi nasional.
Buku Outlook Energi Indonesia (BPPT-OEI) 2017 dengan tema “Inisiatif Pengembangan Teknologi Energi Bersih” berusaha menyajikan analisis yang komprehensif tentang upaya mitigasi emisi GRK dengan mengoptimalkan penerapan berbagai teknologi energi bersih di Indonesia. Penyusunan asumsi skenario dan kasus di model yang digunakan dalam BPPT-OEI 2017 menyediakan kerangka pikir untuk menjawab pertanyaan “what-if” tentang berbagai kemungkinan di masa depan. Walau tidak mungkin menggambarkan fenomena dunia nyata secara sempurna, model ini memungkinkan kita untuk memprediksi dan menemukan sesuatu yang baru. Mengutip ucapan ahli statistik ternama dari Inggris George E.P. Box, “All models are wrong, but some are useful”.
The United Nations Climate Change Conferences 2015 or UNFCCC COP21 that held in Paris aims to prevent 2°C
increase in global average temperature and to pursue efforts
to limit the temperature increase to 1.5°C above pre-industrial levels. Indonesia is pledged to reduce its greenhouse gas (GHG) emissions by 26% (41% with international support) by 2020 as outlined in the Nationally Determined Contribution. The Government has issued various “energy transition” policies to increase the use of low-carbon energy technology or so-called clean energy technology. However, impact of these policies on the target of GHG emission reduction needs an in-depth study. Furthermore, types of feasible clean technology to be applied in Indonesia are also needs to be analyzed.
In addition, Indonesia’s high dependency on oil and coal should be given attention. The limitation of fossil energy resources makes switching to new and renewable energy not just an option but a necessity. Non-conventional gases such as shale gas and CBM (Coal Bed Methane) are examples of new energies that have the potential to reinforce national
energy diversification and energy resilience.
Outlook Energy Indonesia (BPPT-OEI) 2017 with the theme “Clean Energy Technology Development Initiatives” attempts to present a comprehensive analysis of GHG emission
mitigation efforts by optimizing the implementation of clean
Pendahuluan
3OUTLOOK ENERGI INDONESIA 2017
1.2 Kebijakan Energi Saat Ini
Current Energy Policies
Terkait dengan penurunan emisi GRK, pemerintah Indonesia sudah mempunyai Rencana Aksi Nasional (RAN-GRK) yang tertuang dalam Perpres 61/2011. Namun rencana ini disusun berdasarkan Rencana Pembangunan Jangka Menengah Nasional (RPJMN) 2010 dan jauh sebelum ada Kesepakatan Paris 2015. Oleh karena itu pemerintah akan segera memperbaharui Perpres tersebut yang tidak hanya akan membahas penurunan emisi saja tapi secara komprehensif dengan target pembangunan yang sejalan dengan dinamika pengendalian perubahan iklim dunia.
Selain RAN-GRK, Pemerintah juga mengeluarkan Kebijakan Energi Nasional (KEN) dalam PP 79/2014. Di dalam KEN ditetapkan target optimal baruan energi baru dan terbarukan (EBT) yaitu 23% di 2025 dan 31% di 2050. Untuk menggenjot penetrasi EBT di sektor ketenagalistrikan, Kementerian ESDM mengeluarkan Permen 12/2017 yang mengatur Feed-in Tariffs (FiT) untuk pembangkit energi terbarukan. FiT yang sebelumnya berdasarkan biaya produksi investor berubah jadi tergantung pada perbandingan antara Biaya Pokok Penyediaan (BPP) setempat dan nasional dengan nilai maksimal 85% dari BPP setempat. Hal ini dilakukan untuk menjamin pembelian listrik oleh PLN. Namun melihat data bahwa di beberapa wilayah ada pembangkit energi terbarukan yang biaya investasinya diatas 85% dari BPP setempat, diperlukan kebijakan pendukung dan langkah–langkah strategis untuk mensukseskan kebijakan Permen ESDM 12/2017 ini.
Disisi migas, Pemerintah mengeluarkan PP 27/2017 yang merupakan revisi dari PP 79/2010 tentang biaya operasi yang dapat dikembalikan dan perlakuan pajak penghasilan di bidang usaha hulu minyak dan gas bumi. Dalam PP ini, kontraktor, pada tahap eksplorasi, diberikan fasilitas perpajakan seperti pembebasan pungutan bea masuk untuk impor barang terkait operasi perminyakan dan pembebasan PPN serta pajak penjualan atas barang mewah untuk objek pajak tertentu. Diharapkan kebijakan ini mampu meningkatkan penemuan cadangan migas nasional, menggerakkan iklim investasi serta lebih memberikan kepastian hukum pada kegiatan usaha hulu minyak dan gas bumi.
Indonesian Government already has a National Action Plan (RAN-GRK) as stipulated in Presidential Regulation 61/2011. However, the plan is based on the National Long-Term Development Plan (RPJMN) 2010, long before the COP21 Paris 2015. Therefore the Government will soon renew the Presidential Regulation which will not only focusses on emissions reductions but also comprehensively with infrastructure development in line with the dynamics of world climate change policy.
In addition to RAN-GRK, the Government also issued a National Energy Policy (KEN) in Government Regulation 79/2014. Within the KEN, the optimum target of new and renewable energy (NRE) is set at 23% in 2025 and 31% in 2050. To boost NRE penetration in electricity sector, the Ministry of Energy and Mineral Resources (MEMR) issues a
Ministerial Regulation 12/2017 regulating Feed-in Tariffs
(FiT) for renewable energy generation. FiT that previously based on the investor’s cost of production is changed so it varies depending on the comparison of Basic Supply Cost for Electricity (BPP) between local and national with a maximum value of 85% of the local BPP. This is applied to guarantee the purchase of electricity by PLN. However in some areas, the investment cost of renewable energy generation is above 85% of local BPP. Hence the support from policies and strategic steps are needed to actualize the MEMR regulation 12/2017.
Introduction
4Gross Production
Cost Recovery
Profit Share
Government Share Contractor Share
Income Tax First Tranche
Petroleum
(a) Production Sharing Contract (b) Gross Split
Gross Production
Government Share Contractor Share
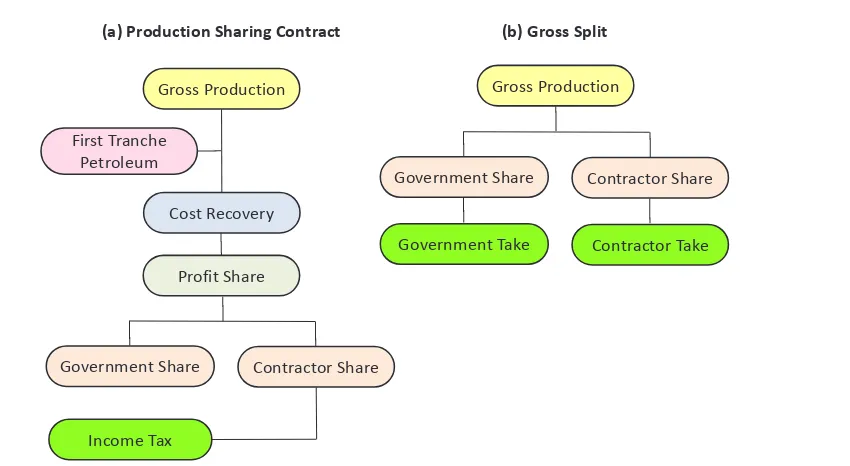
Government Take Contractor Take yang mengatur mekanisme kontrak bagi hasil gross
split untuk kegiatan usaha hulu minyak dan gas bumi nasional. Gross split yang sebelumnya hanya berlaku untuk pengembangan migas non konvensional sebagaimana tercantum dalam Permen ESDM 38/2015 kini juga sudah berlaku untuk migas konvensional. Cost recovery yang biasanya menjadi beban APBN dihapuskan dan seluruh biaya operasi ditanggung oleh kontraktor. Kepemilikan sumber daya alam tetap di tangan pemerintah dengan pengendalian operasi oleh SKK Migas
Kontrak bagi hasil gross split menggunakan mekanisme bagi hasil awal (base split) yang kemudian dapat disesuaikan berdasarkan komponen variabel dan komponen progresif. Besaran bagi hasil awal untuk minyak bumi adalah 57% negara dan 43% kontraktor. Sedangkan pembagian untuk gas bumi adalah 52% negara dan 48% kontraktor. Komponen variabel yang dapat merubah bagi hasil awal tersebut antara lain status wilayah kerja, lokasi lapangan, kedalaman reservoir, ketersediaan infrastruktur pendukung serta kandungan CO2 dan H2S. Sementara komponen progresif yang dimaksud adalah harga minyak bumi, harga gas bumi, dan jumlah kumulatif produksi migas.
Mekanisme gross split mendorong efisiensi dan
penyederhanaan administrasi dan manajemen kontraktor agar lebih baik. Namun di sisi lain, karena proses pengadaan barang dan jasa diserahkan kepada kontraktor maka skema ini berpotensi menurunkan pemenuhan Tingkat Komponen Dalam Negeri (TKDN).
Ministerial Regulation 8/2017) governing the mechanism of gross split for national upstream oil and gas businesses. Gross splits that was only applicable to non-conventional oil and gas development as set forth in MEMR Regulation 38/2015 is now also applicable to conventional oil and gas. The cost recovery that usually becomes the burden of the state budget is eliminated and all operating costs are borne by the contractor. Ownership of natural resources remains in the hands of Government with SKK Migas as the operation regulatory control body.
Gross split uses a base split mechanism that can then be customized based on variable components and progressive
components. The initial profit-sharing for petroleum is 57%
Government and 43% contractors as for natural gas is 52% Government and 48% contractors. Variable components that can change the initial share includes work area status,
field location, reservoir depth, availability of supporting
infrastructure also CO2 and H2S content. While the progressive components in question is the price of petroleum, price of natural gas, and the cumulative amount of oil and gas production.
The gross split mechanism encourages the efficiency and simplification of contractor administration and
management for better performance. On the other hand, since the procurement process of goods and services is left to the contractor, this scheme has the potential to reduce the
fulfillment of Domestic Component Level (TKDN).
Gambar 1.1 Skema kontrak bagi hasil dan gross split
Figure 1.1 Scheme of production sharing contract and gross split
Pendahuluan
5OUTLOOK ENERGI INDONESIA 2017
1.3.1 Model Kebutuhan Energi
Proyeksi kebutuhan energi dilakukan dengan menggunakan model BPPT-MEDI (Model of Energy Demand for Indonesia). Secara umum, kebutuhan energi dalam model BPPT-MEDI dihitung dengan mengalikan aktivitas dan intensitas energi. Jenis aktivitas dan intensitas energi bergantung pada sektor kebutuhan energi. Sektor kebutuhan dibagi dalam lima sektor, yaitu sektor industri, rumah tangga, transportasi, komersial, dan lainnya. Asumsi-asumsi yang dipakai dalam model adalah sebagai berikut:
• Tahun dasar yang dipakai adalah 2015 dan periode proyeksi adalah hingga 2050.
• Data konsumsi energi tahun dasar diperoleh dari
Handbook of Energy and Economic Statistics of Indonesia 2016, Kementerian ESDM.
• Harga minyak bumi tahun 2017-2025 mengikuti proyeksi Bank Dunia sementara untuk tahun 2026-2050 disesuaikan dengan tren pertumbuhan sebelumnya.
• Harga batubara tahun 2017-2025 mengikuti proyeksi batubara Australia dari Bank Dunia sementara untuk tahun 2026-2050 disesuaikan dengan tren pertumbuhan harga minyak bumi.
• Harga LNG tahun 2017-2025 mengikuti proyeksi CIF Jepang dari Bank Dunia sementara untuk tahun 2026-2050 disesuaikan dengan tren pertumbuhan harga minyak bumi
• Pertumbuhan penduduk dan laju urbanisasi untuk periode 2015-2035 mengikuti proyeksi jangka panjang dari Bappenas-BPS-UNFPA, sedangkan pertumbuhan untuk periode 2036-2050 disesuaikan dengan tren pertumbuhan sebelumnya. Satu rumah tangga diasumsikan terdiri dari empat orang dan berlaku konstan hingga 2050.
• Rasio elektrifikasi dan elastisitas kebutuhan listrik
untuk periode 2017-2026 mengikuti Rencana Usaha Penyediaan Tenaga Listrik (RUPTL) PT. PLN (Persero).
Rasio elektrifikasi pulau Jawa diasumsikan akan
mencapai 100% tahun 2025 sedangkan untuk wilayah lainnya diasumsikan mencapai 100% tahun 2050.
• Kebutuhan kayu bakar di sektor rumah tangga tidak dipertimbangkan.
1.3 Model, Skenario dan Kasus
Model, Scenarios, and Cases
1.3.1 Energy Demand Model
Projection of energy demand is done by using model of BPPT-MEDI (Model of Energy Demand for Indonesia). In general, energy demand in the BPPT-MEDI model is calculated by multiplying the activity and energy intensity. Type of activity and energy intensity depend on the energy demand sectors.
The demand sectors are divided into five sectors, namely
industry, household, transportation, commercial, and others. The assumptions used in the model are as follows:
• The base year is 2015 and projection period is up to 2050.
• Energy consumption data for base year is obtained from Handbook of Energy and Economic Statistics of Indonesia 2016, MEMR.
• Crude oil price in 2017-2025 follows the projection of World Bank and for 2026-2050 it is adjusted to the previous growth trend.
• Coal price for 2017-2025 follows the projection of Australia’s coal price from World Bank, while for 2026-2050 it is adjusted to the trend of crude oil price growth.
• LNG price in 2017-2025 follows the projection of CIF Japan from World Bank, while for 2026-2050 it is adjusted to the trend of crude oil price growth.
• Population growth and urbanization rates for period 2015-2035 follow the long-term projections of Bappenas-BPS-UNFPA, while growth for 2036-2050 is adjusted to previous growth trends. One household is assumed to consist of four people.
• Electrification ratio and elasticity of electricity demand
for period 2016-2025 follow the Power Supply Business
Plan (RUPTL) PT. PLN (Persero). Electrification ratio of
Java is assumed to reach 100% in 2025 while for other regions it is assumed to reach 100% by 2050.
• Demand for firewood in household sector is not
Introduction
6penumpang maupun barang) mengikuti rencana PT. KAI.
• Angkutan masal yang dipertimbangkan adalah Mass Rapid Transit (MRT) dengan asumsi mulai beroperasi tahun 2019. Proyeksi pertambahannya mengikuti rencana PT. MRT Jakarta.
• Kebutuhan BBM tidak dibedakan antara BBM subsidi dan non subsidi.
• Konservasi energi sudah dipertimbangkan.
freight train) follows the plan of PT. KAI.
• Mass transportation considered in the model is Mass Rapid Transit (MRT) that is assumed to start operating in 2019 and its addition follows the plan of PT. MRT Jakarta.
• Demand for petroleum fuel is not differentiated
between subsidized and non-subsidized one.
• Energy conservation is considered.
Skenario / Scenario
Skenario adalah satu set asumsi dalam model yang dampaknya dianalisis terhadap keseluruhan sistem energi. Untuk mempermudah analisis, biasanya perbedaan asumsi antara satu skenario dengan yang lain terletak hanya disatu variabel. Dalam BPPT-OEI 2017, dua skenario dijalankan untuk melihat dampak pertumbuhan ekonomi terhadap sistem energi Indonesia. Perbedaan kedua skenario ini terletak pada asumsi pertumbuhan PDB.
Scenario is a set of assumptions used in running the model whose effects are analyzed for the entire energy system. To simplify the analysis, the difference between scenarios usually lies only in one variable. In BPPT-OEI 2017, two scenarios are run to see the economic impacts on Indonesia’s energy system. The difference between these two
scenarios lies in GDP growth.
Skenario Dasar / Base Scenario
Pertumbuhan rata-rata PDB untuk kurun waktu 2015-2050 diasumsikan meningkat sebesar 6% per tahun dimana pertumbuhan pada periode 2016-2020 mengikuti batas bawah RAPBN 2017.
The average GDP growth for period 2015-2050 is assumed to increase by 6% per year where the growth in period 2016-2020 follows the lower limit of the Draft State Budget (RAPBN) of 2017.
Skenario Tinggi / High Scenario
Pertumbuhan rata-rata PDB untuk kurun waktu 2015-2050 diasumsikan meningkat sebesar 7% per tahun dimana pertumbuhan pada periode 2016-2020 mengikuti batas atas RAPBN 2017.
The average GDP growth for period 2015-2050 is assumed to increase by 7% per year where the growth in period 2016-2020 follows the upper limit of the Draft State Budget (RAPBN) of 2017.
1.3.2 Model Penyediaan Energi
Untuk memenuhi kebutuhan energi, sumber-sumber energi primer yang ada di Indonesia dioptimasi dengan menggunakan model penyediaan energi. Asumsi-asumsi yang dimasukkan ke dalam model adalah:
• Data cadangan batubara diperoleh dari Laporan Kinerja Direktorat Jendral Minerba 2016. Sementara data minyak bumi mengikuti data Kementerian ESDM tahun 2016. Cadangan minyak yang dipertimbangkan adalah cadangan terbukti. Sedangkan cadangan batubara yang dipertimbangkan adalah cadangan tertambang dan cadangan terbukti.
• Pengembangan CBM berdasarkan data dari VICO Indonesia yang dipresentasikan dalam IndoGAS
1.3.2 Energy Supply Model
To meet energy demand, primary energy resources in Indonesia are optimized using energy supply model. Assumptions included in the model are:
• Coal reserves data are obtained from Performance Report of Directorate General of Minerals 2016 and petroleum data follow the MEMR data of 2016. The oil reserves being considered are the proven reserves while the coal reserves being considered are the mineable and proven reserves.
Pendahuluan
7OUTLOOK ENERGI INDONESIA 2017
• The addition of new oil refineries considers the refinery
plan development of Pertamina 2017-2025. After 2025,
the refineries addition is assumed to take place every five years with a capacity of 300 thousand barrels/day.
• Operation of ultrasupercritical boiler power plant for
1000 MW coal-fired power plant in Java region is
according to RUPTL 2017-2026.
• Natural gas supply considers the 2016-2035 gas balance sheet and result of FGD “Conventional Gas Utilization to Meet National Gas Needs”.
• Shale gas development considers input from FGD “Conventional Gas Utilization to Meet National Gas Needs”.
• Supply of biodiesel follows biodiesel mandatory in MEMR Regulation 12/2015.
• Natural gas network (jargas) development plans for households consider the National Gas Infrastructure Master Plan 2016-2030 from the MEMR.
• Energy conservation is considered through the efficient
use of technology.
Conference 2015.
• Penambahan kilang minyak baru mempertimbangkan rencana pengembangan kilang pertamina 2017-2025. Setelah tahun 2025, penambahan kilang diasumsikan berlangsung setiap lima tahun dengan kapasitas 300 ribu barel/hari.
• Pengoperasian pembangkit listrik ultra-supercritical
boiler untuk PLTU batubara 1000 MW di wilayah Jawa sesuai RUPTL 2017-2026.
• Penyediaan gas bumi mempertimbangkan neraca gas bumi 2016-2035 dan hasil FGD “Pemanfaatan Gas Konvensional untuk Memenuhi Kebutuhan Gas Nasional”.
• Pengembangan shale gas mempertimbangkan masukan dari FGD “Pemanfaatan Gas Konvensional untuk Memenuhi Kebutuhan Gas Nasional”.
• Penyediaan biodiesel mengikuti mandatori biodiesel dalam Permen ESDM 12/2015.
• Rencana pembangunan jaringan gas (jargas) untuk rumah tangga mempertimbangkan Rencana Induk Infrastruktur Gas Bumi Nasional 2016-2030 dari Kementerian ESDM.
• Konservasi energi sudah dipertimbangkan melalui
pemanfaatan teknologi yang efisien.
Kasus / Cases
Kasus adalah satu set asumsi dalam model yang dampaknya dianalisis hanya terhadap bagian tertentu di sistem energi. Dibandingkan skenario, ruang lingkup dari kasus lebih terbatas sehingga hasilnya dapat dianalisis dengan lebih cepat. Berikut adalah kasus-kasus yang dianalisis dalam BPPT-OEI 2017:
A Case is a set of assumptions used in running the model whose effects are analyzed only on a particular part
of energy system. Compared to scenario, the scope of a case is more limited so the results can be analyzed more quickly. The following are cases analyzed in BPPT-OEI 2017:
• Kasus Pembatasan Ekspor Batubara / Case of Coal Export Restriction
• Kasus Pengurasan Cadangan Batubara / Case of Coal Resources Depletion
• Kasus Inisiatif Pengembangan Teknologi Energi Bersih (Energi Bersih). Kasus ini merupakan gabungan dari lima kasus, yaitu: / Case of Clean Energy Technology Development Initiatives (Clean Energy). This case is a
combination of five cases, namely:
1. Kasus Optimalisasi Pembangkit Listrik EBT (Pembangkit EBT) / Case of NRE Power Plant Optimization (NRE Power Plant)
2. Kasus Peningkatan Pemanfaatan Bahan Bakar Nabati (BBN) / Case of Increasing Biofuel Utilization (Biofuel)
3. Kasus Penerapan Kendaraan Listrik (Kendaraan Listrik) / Case of Electric Vehicles Application (Electric Vehicles)
4. Kasus Penerapan Industri Hijau di Industri Pulp dan Kertas serta Industri Semen (Industri Hijau) / Case of Green Industry Implementation in Pulp and Paper Industry, and Cement Industry (Green Industry)
Introduction
8Energy Demand
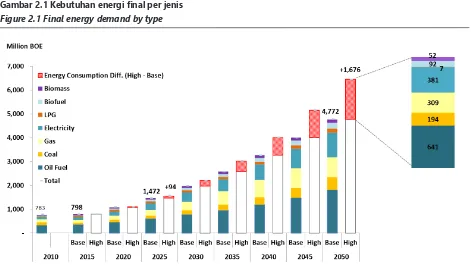
102.1 Kebutuhan Energi per Jenis
Energy Demand by Type
Konsumsi energi final terus meningkat sejalan dengan
pertumbuhan ekonomi, penduduk, harga energi, dan kebijakan yang ditetapkan oleh pemerintah. Konsumsi
energi final selama tahun 2010-2015 meningkat relatif
terbatas sekitar 1,3% per tahun.
Kebijakan yang diambil pemerintah dalam bidang energi antara lain adalah konversi minyak tanah dengan LPG untuk sektor rumah tangga, penggunaan bahan bakar gas (BBG) untuk sektor transportasi, mandatori penggunaan bahan bakar nabati (BBN), subsidi listrik terbatas untuk konsumen tertentu, penghapusan subsidi premium, dan subsidi terbatas minyak solar.
Pada tahun 2015 pangsa terbesar konsumsi energi final
adalah sektor rumah tangga (35%) diikuti oleh sektor transporatasi (31%), industri (29%), komersial (4,0%) dan lainnya (2,0%). Selama kurun waktu 2010-2015, sektor transportasi mengalami pertumbuhan terbesar yang mencapai 5,2% per tahun, diikuti sektor rumah tangga (3,8%), dan sektor komersial (2,9%). Adapun pertumbuhan sektor industri dan sektor lainnya mengalami penurunan sebesar 4,6% dan 10%.
Final energy consumption continues to increase in line with economic growth, population, energy prices, and policies set by the Government. Final energy consumption during 2010-2015 increased relatively small for about 1.3% per year.
Policies taken by the Government in energy sectors include the conversion of kerosene to LPG for household sector, the use of fuel gas (BBG) for transportation sector, mandatory use
of biofuels (BBN), electricity subsidy for specified consumers,
and a limited subsidy of diesel oil.
By 2015, the largest share of final energy consumption was
household sector (35%) followed by transportation (31%), industry (29%), commercial (4.0%) and others (2.0%). During the period of 2010-2015, transportation sector had the largest growth of 5.2% per year, followed by household (3.8%), and commercial (2.9%). The growth of industrial and other sectors decreased to only 4.6% and 10% respectively.
Kebutuhan Energi
11OUTLOOK ENERGI INDONESIA 2017
Konsumsi energi final menurut jenis selama tahun
2010-2015 masih didominasi oleh BBM (bensin, minyak solar, minyak diesel, minyak tanah, minyak bakar, avtur dan avgas) mencapai 25%, disusul gas bumi (11%), listrik (11%), batubara (6,2%), LPG (4,8%).
Energi final BBM masih akan mendominasi kebutuhan
energi nasional dalam kurun waktu 2015-2050 akibat penggunaan teknologi saat ini yang masih berbasis BBM, terutama di sektor transportasi. Sektor-sektor pengguna lainnya pun tidak terlepas dari penggunaan BBM karena
teknologinya cukup efisien. Pemanfaatan BBM meningkat
dengan laju pertumbuhan 4,7% per tahun. Demikian juga dengan kebutuhan batubara pada tahun 2050, kebutuhannya meningkat tajam sebesar lebih dari 7 kali lipat (skenario dasar) atau lebih dari 10 kali lipat (skenario tinggi) terhadap tahun 2015. Hal ini terjadi karena harga batubara yang kompetitif dan pesatnya perkembangan industri berbasis batubara (semen, kertas, tekstil, dan lainnya).
Dalam kurun 2015–2050, kebutuhan energi final gas bumi
diperkirakan akan naik lebih dari 6 kali lipat pada skenario dasar dan naik lebih dari 9 kali lipat pada skenario tinggi.
Kebutuhan energi final LPG meningkat rata-rata 3,0% per
tahun untuk skenario dasar dan 3,2% per tahun untuk skenario tinggi. Rendahnya peningkatan kebutuhan energi
final LPG karena terkait dengan pertumbuhan penduduk
dimana LPG sebagian besar digunakan di sektor rumah
tangga. Adapun kebutuhan energi final biomassa sebagai
bahan bakar, terutama di sektor industri, meningkat tipis sebesar 3,1% per tahun untuk skenario dasar dan 4,0% per tahun untuk skenario tinggi.
Sejalan dengan meningkatnya kebutuhan energi final BBM, kebutuhan energi final BBN sebagai substitusi BBM terutama
biodiesel juga meningkat mengikuti tren pertumbuhan minyak solar dan mandatori biodiesel. Mandatori biodiesel diatur dalam Permen ESDM No. 12/2015 dengan pemakaian biodiesel (B100) maksimum 30% pada tahun 2025. Dalam skenario dasar dan skenario tinggi tidak dipertimbangkan penggunaan bioetanol dan bioavtur karena harga, pasokan, dan dukungan regulasi yang terbatas. Dalam kurun 35 tahun diperkirakan kebutuhan biodiesel berkembang dengan laju pertumbuhan 8,4% per tahun untuk skenario dasar dan 9,4% per tahun untuk skenario tinggi.
Final energy consumption by type during 2010-2015 was still dominated by oil fuels (gasoline, diesel oil, diesel oil, kerosene, FO, avtur and avgas) reached 25%, followed by natural gas (11%), electricity (11%), coal (6.2%), and LPG (4.8%).
Oil fuels will still dominate the national energy demand in 2015-2050 period due to the use of oil fuels-based technology especially in transportation sector. Other sectors are also still not free from the use of oil fuels because the technology is
quite efficient. Oil fuels utilization increases with the growth
rate of 4.7% per year. Similarly, coal demand in 2050 will increase sharply by more than 7 times (base scenario) and more than 10 times (high scenario) compared to 2015. This happens because of the competitive price of coal and the rapid development of coal-based industries (cement, paper, textile, and others).
In 2015-2050 period, final energy demand for natural gas is
expected to rise more than six folds in base scenario and more than nine folds in high scenario. Demand of LPG increases by an average of 3.0% per year for base scenario and 3.2% per year for high scenario. The low increase is due to population
growth as LPG is mainly used in household sector. The final
energy demand of biomass as fuel, especially in industrial sector, increases slightly by 3.1% per year for base scenario and 4.0% per year for high scenario.
Energy Demand
122.2 Kebutuhan Energi per Sektor
Energy Demand by Sector
Kebutuhan energi final sektor industri diperkirakan
tetap dominan dalam jangka panjang. Sebagai negara berkembang, Indonesia akan mengarah menjadi negara maju yang diindikasikan dengan dominasi sektor industri dalam menunjang perekonomiannya. Pangsa kebutuhan
energi final sektor industri meningkat dari 29% pada
tahun 2015 menjadi 43% (skenario dasar) 44% (skenario tinggi) pada tahun 2050. Namun sektor transportasi sebagai penunjang pergerakan perekonomian nasional diproyeksikan mengalami pertumbuhan kebutuhan energi
final sedikit lebih tinggi dari sektor industri, yaitu 4,7%
per tahun untuk skenario dasar dan 5,6% per tahun untuk skenario tinggi. Kondisi ini membutuhkan energi 5 kali lipat (skenario dasar) dan 7 kali lipat (skenario tinggi) lebih banyak terhadap tahun dasar 2015.
The final energy demand of industrial sector is expected to
remain dominant in long term. As a developing country, Indonesia leads its way to be a developed country which is indicated by the dominance of industrial sector as the main
support of economy. The share of industry’s final energy
demand increases from 29% in 2015 to 43% (base scenario) and 44% (high scenario) by 2050. The demand of transport sector as a supporter of national economy is projected to grow slightly higher than industrial sector, i.e. 4.7% per year for base scenario and 5.6% per year for high scenario. This condition requires 5 times (base scenario) and 7 times (high scenario) more energy of 2015.
Kebutuhan Energi
13OUTLOOK ENERGI INDONESIA 2017
Gambar 2.3 Kebutuhan energi final di sektor industri Figure 2.3 Final energy demand in industry sector
Dengan meningkatnya perekonomian dan penduduk
diproyeksikan penggunaan energi final di sektor rumah
tangga, sektor komersial, dan sektor lainnya (pertanian, konstruksi dan pertambangan) akan terus bertambah. Peranan sektor komersial terhadap total kebutuhan
energi final diperkirakan akan meningkat dari 3,6%
pada tahun 2015 menjadi menjadi 6,3% (skenario dasar) dan 6,4% (skenario tinggi) pada tahun 2050. Tingginya
peningkatan kebutuhan energi final perlu diantisipasi
dengan menerapkan upaya konservasi energi di sisi hulu yang didukung dengan penetapan kebijakan yang tepat dan dapat dilaksanakan.
Along with the increase in economy and population,
the projected final energy demand in household sector,
commercial sector, and other sector (agriculture, construction and mining) will continue to grow. The role of commercial
sector in total final energy demand is expected to increase
from 3.6% in 2015 to 6.3% (base scenario) and 6.4%
(high scenario) by 2050. The high increase in final energy
demand needs to be anticipated by implementing energy
conservation efforts on upstream side and also supported by
Energy Demand
14Gambar 2.4 Kebutuhan energi final di sektor transportasi Figure 2.4 Final energy demand in transportation sector
Kebutuhan Energi
15OUTLOOK ENERGI INDONESIA 2017
29
17
33
140
35
192
0
40
80
120
160
200
2010
2015
2020
2025
2030
2035
2040
2045
2050
Million BOE
Biodiesel
FO
ADO
Kerosene
Gambar 2.7 Kebutuhan energi final di sektor lainnya Figure 2.7 Final energy demand in other sector
Energy Demand
16Energy Supply
18Gambar 3.1 Sumber daya minyak dan gas bumi
Figure 3.1 Oil and gas resources
3.1.1 Energi Fosil
Cadangan terbukti minyak bumi Indonesia terus menurun dari 5,9 miliar barel pada tahun 1995 menjadi 3,7 miliar barel pada akhir 2015. Dengan tingkat produksi minyak bumi saat ini dan tidak ada penemuan cadangan minyak bumi baru, maka cadangan terbukti minyak bumi Indonesia akan habis dalam kurun waktu 11 tahun lagi. Cadangan potential gas bumi mengalami sedikit peningkatan, namun cadangan terbuktinya terus menurun. Dengan kondisi cadangan dan produksi saat ini diperkirakan gas bumi akan habis dalam kurun waktu 36 tahun ke depan.
3.1.1 Fossil Energy
Indonesia’s proven oil reserves continue to decline from 5.9 billion barrels in 1995 to 3.7 billion barrels by the end of 2015. With the current level of oil production and no new reserves, the proven oil reserves will be depleted in the next 11 years. On natural gas side, the potential reserves have increased slightly but the proven reserves continue to decline. With the current reserves and production conditions, it is estimated that natural gas will be exhausted within the next 36 years.
3.1 Potensi Sumber Daya Energi
Energy Resource Potential
Sumber daya batubara selama kurun waktu 4 tahun terakhir mengalami sedikit peningkatan, sedangkan cadangan batubara mengalami penurunan akibat produksi batubara untuk pemenuhan konsumsi domestik dan komoditas ekspor. Diperkirakan dengan produksi saat ini, cadangan batubara akan habis dalam waktu 70 tahun jika tidak ditemukan cadangan baru. Kondisi cadangan energi fosil yang terus berkurang seyogyanya diantisipasi oleh Pemerintah Indonesia untuk meningkatkan upaya
diversifikasi bahan bakar.
Coal resources over the last 4 years increased slightly, while coal reserves declined due to coal production to meet domestic consumption and export commodities. Estimated with current production and no new reserves, coal reserves will be exhausted within 70 years. The diminishing fossil reserves should be anticipated by the Government of
Penyediaan Energi
19OUTLOOK ENERGI INDONESIA 2017
Gambar 3.2 Sumber daya batubara
Figure 3.2 Coal resources
3.1.2 Energi Baru dan Terbarukan
Indonesia memiliki potensi sumber daya energi baru terbarukan (EBT) yang cukup besar dengan variasi yang cukup beragam. Potensi sumber daya energi terbarukan terbanyak adalah tenaga air disusul Ocean Thermal Energy Conversion (OTEC), dan biomassa. Adapun potensi energi baru terbanyak adalah shale gas dan gas metana batubara. Sumber daya EBT tersebut masih belum termanfaatkan secara maksimal karena berbagai kendala, seperti biaya investasi yang relatif tinggi, lokasi potensi sumber daya yang terpencil serta regulasi yang belum mendukung.
3.1.2 New and Renewable Energy
Energy Supply
20No Jenis energi /
Energy type
Sumber Daya /
Resources
Cadangan /
Reserves
Potensi /
Potential
Kapasitas terpasang/
Installed capacity
1 Panas bumi/
Geothermal
29,544 MW 1,438.5MW
2 Hidro/
Hydro 75,091 MW
45,379 MW (Sumberdaya teridentifikasi
/ Identifiedresources)**
8,671 MW**
3 Mini-mikrohidro/
Mini- micro hydro
19.385 MW 2,600.76 KW*
4 Biomassa /
Biomass
32,654 MWe* 1,626 MW (Off
Grid)* 91.1 MW (On Grid)* 5 Energi surya/
Solar energy
4.80 kWh/m2/day*** 14,006.5 KW***
6 Energi angin/
Wind energy
970 MW** 1.96 MW***
7 Uranium/
Uranium
3,000 MW**** 30 MW****
8 Shale gas 574 TSCF****
9 Gas metana batubara /
Coal bed methane
456.7 TSCF****
10 Gelombang Laut
Wave energy
17.989 MW (Potensi Praktis /
Practical Potential) 11 Energi Panas Laut
OTEC (Ocean Thermal Energy Conversion)
41,012 MW (Potensi Praktis /
Practical Potential)** 12 Pasang Surut
Tide and tidal power
4,800 MW (Potensi Praktis /
Practical Potential)** Tabel 3.1 Sumber energi baru dan terbarukan
Table 3.1 New and renewable energy resources
Penyediaan Energi
21OUTLOOK ENERGI INDONESIA 2017
Gambar 3.3 Neraca minyak bumi
Figure 3.3 Crude oil balance
3.2.1 Neraca Minyak Bumi
Kemampuan produksi minyak bumi Indonesia terus menurun akibat sumur yang sudah tua dan sumberdaya yang terletak di daerah frontier. Produksi minyak bumi
Indonesia mengalami penurunan yang cukup signifikan.
Selain itu, kebijakan yang berubah dan harga minyak yang cenderung rendah telah menurunkan kegiatan eksplorasi dan eksploitasi migas nasional yang berdampak pada penurunan cadangan minyak bumi.
Revisi PP 79/2010 melalui PP 27/2017 dan adanya Permen ESDM 08/2017 tentang Kontrak Bagi Hasil Gross Split
ikut menjadi faktor menurunnya kegiatan eksplorasi dan eksploitasi migas apalagi didukung oleh harga minyak bumi yang cenderung rendah beberapa tahun terakhir. Untuk dapat menarik investor berinvestasi, pemerintah
perlu mengatur tentang kepastian hukum, fleksibilitas
dalam menentukan besaran bagi hasil, dan pemberian
insentif fiskal dan non fiskal dalam kegiatan industri hulu
migas.
3.2.1 Crude Oil Balance
Indonesia’s oil production capability continues to decline due to old wells and resources located in frontier areas.
Indonesia’s oil production has decreased significantly. In
addition, policies changing and low oil prices have depressed national oil and gas exploration and exploitation activities that have an impact on the decline of oil reserves.
Revision of Government Regulation 79/2010 through Government Regulation 27/2017 and the MEMR Regulation 08/2017 on Gross Split Production Sharing Contracts is a factor in the decline of oil and gas exploration and exploitation activities. In order to attract investors, the
Government needs to regulate legal certainty, flexibility in determining the amount of profit sharing, and the provision of fiscal and non fiscal incentives in upstream oil and gas
activities.
3.2 Minyak Bumi dan BBM
Energy Supply
22(skenario dasar) dan @ 600 MBCD (skenario tinggi) dalam setiap 5 tahun guna mendukung peningkatan kebutuhan BBM domestik, impor minyak bumi sebagai throughput
kilang minyak terus meningkat. Sebaliknya, produksi
minyak bumi yang tidak sesuai dengan spesifikasi kilang
minyak nasional harus diekspor meskipun dalam jumlah terbatas. Indonesia sudah menjadi negara net importir minyak bumi sejak tahun 2004, pada saat volume impor lebih besar dibanding dengan volume ekspor minyak bumi.
scenario) and each 600 MBCD (high scenario) refineries in
every 5 years to support the increase in domestic oil fuel
demand, oil imports as throughput of oil refineries continue
to increase. In contrast, crude oil production which is not
suitable with national oil refineries should be exported, even
in limited quantities. Indonesia has been an oil net importer country since 2004, when the volume of oil imports is greater than the export.
Gambar 3.4 Ekspor dan impor minyak bumi
Figure 3.4 Export and import of crude
3.2.2 Neraca Bahan Bakar Minyak
Penambahan 5 unit kilang minyak bumi baru @ 300 MBCD (skenario dasar), @ 600 MBCD (skenario tinggi) dan revitalisasi kilang minyak bumi lama akan meningkatkan produksi BBM nasional. Namun, peningkatan produksi BBM tersebut tidak mampu mengimbangi kebutuhan BBM, sehingga impor BBM diproyeksikan akan terus meningkat.
Upgrading kilang minyak eksisting akan meningkatkan nilai tambah dari beberapa produk kilang. Produk LSWR dan Naptha yang selama ini harus diekspor dengan harga jual rendah, diolah menjadi produk HOMC (High Octane Mogas Component), minyak solar, dan propylene dengan nilai ekonomi jauh lebih tinggi. Disamping itu, dengan
3.2.2 Oil Fuels Balance
The addition of 5 new refinery units of each 300 MBCD
(base scenario) and each 600 MBCD (high scenario) also the
revitalization of old oil refineries will encourage the increase
of national oil fuels production. Nevertheless, this increase will not be able to meet the demand so that oil fuels imports are projected to still continue to increase.
Upgrading the existing refineries will increase the added value of some refinery products. Low Sulphur Waxy Residue
(LSWR) and naptha products that was exported at low prices are now processed into High Octane Mogas Component (HOMC), diesel oil and propylene with much higher
Penyediaan Energi
23OUTLOOK ENERGI INDONESIA 2017
-1600 -1400 -1200 -1000 -800 -600 -400 -200 0 200 2 0 1 5 2 0 1 7 2 0 1 9 2 0 2 1 2 0 2 3 2 0 2 5 2 0 2 7 2 0 2 9 2 0 3 1 2 0 3 3 2 0 3 5 2 0 3 7 2 0 3 9 2 0 4 1 2 0 4 3 2 0 4 5 2 0 4 7 2 0 4 9 Million Barrels Kerosene Import Fueloil Import Gasoline Import Avtur Import ADO Import Kerosene Export Fueloil Export
Oilfuel Net Import (Base)
Oilfuel Net Import (High)
0 50 100 150 200 250 300 350 400 450 500 20 15 20 17 20 19 20 21 20 23 20 25 20 27 20 29 20 31 20 33 20 35 20 37 20 39 20 41 20 43 20 45 20 47 20 49 Million Kiloliters
Fuel Import (Base)
Fuel Production (Base)
Fuel Consumption (Base)
Fuel Export (Base)
Fuel Consumption (High)
Fuel Production (High)
Revitalisation of 5 Refineries (RDMP)
Refineries Addition
Gambar 3.5 Neraca BBM
Figure 3.5 Oil Fuels Balance
Gambar 3.6 Ekspor dan impor BBM
Figure 3.6 Export and import of oil fuels
melakukan upgrade kilang lama dapat menghasilkan pertalite, pertamax, dexlite, sekaligus mengurangi impor bensin dan minyak solar. Sebaliknya, ekspor minyak tanah yang meningkat selama beberapa tahun terakhir, menandakan keberhasilan pemerintah dalam melaksanakan program konversi minyak tanah ke elpiji. Meskipun ada penambahan kilang minyak bumi baru dan upgrading kilang minyak bumi lama, namun Indonesia tetap menjadi negara net importir BBM.
can produce pertalite, pertamax, dexlite, while reducing imports of gasoline and diesel oil. In contrast, kerosene exports have increased over the past few years, indicating the government’s success in implementing kerosene to LPG
conversion program. Despite the addition of new oil refineries and upgrading of old oil refineries, Indonesia will remain as
Energy Supply
243.2.3 Pemanfaatan Bahan Bakar Minyak
Sebagian besar penyediaan BBM ditujukan untuk memenuhi kebutuhan bahan bakar di sektor transportasi (85%), selanjutnya sektor industri (7,2%), lainnya (5,0%), pembangkit listrik (1,2%) dan komersial (1,0%). Tingginya kebutuhan BBM di sektor transportasi karena penggunaan BBM untuk angkutan darat, laut dan udara belum dapat disubstitusi secara optimal dengan bahan bakar gas, BBN, dan listrik. Penggunaan BBM di sektor transportasi masih tetap didominasi oleh bensin dan minyak solar. Penggunaan BBM pada pembangkit listrik dalam jumlah terbatas masih diperlukan untuk PLTD di daerah terpencil.
3.2.3 Oil Fuels Utilization
Most of oil fuels supply is aimed to meet the demand in transportation sector (85%), followed by industry (7.2%), others (5.0%), power plants (1.2%) and commercial sector (1.0 %). The high demand in transportation sector in which still dominated by gasoline and diesel oil is due to the not optimal substitution of oil fuels with gas, biofuel, and electricity. The use of oil fuels in power plants is still needed in limited quantities for diesel power plants in remote areas.
Gambar 3.7 Pemanfaatan BBM
Figure 3.7 Oil fuels utilization
75
117
349
127
480
0 100 200 300 400 500 600
2015 2020 2025 2030 2035 2040 2045 2050
Million Kiloliter
Power Plant Other Commercial Household Transportation Industry
Penyediaan Energi
25OUTLOOK ENERGI INDONESIA 2017
0 2,000 4,000 6,000 8,000 10,000 2 0 1 5 2 0 1 6 2 0 1 7 2 0 1 8 2 0 1 9 2 0 2 0 2 0 2 1 2 0 2 2 2 0 2 3 2 0 2 4 2 0 2 5 2 0 2 6 2 0 2 7 2 0 2 8 2 0 2 9 2 0 3 0 2 0 3 1 2 0 3 2 2 0 3 3 2 0 3 4 2 0 3 5 2 0 3 6 2 0 3 7 2 0 3 8 2 0 3 9 2 0 4 0 2 0 4 1 2 0 4 2 2 0 4 3 2 0 4 4 2 0 4 5 2 0 4 6 2 0 4 7 2 0 4 8 2 0 4 9 2 0 5 0 BSCF
Gas Import (Base) Shale Gas Production (Base) CBM Production (Base) Gas Production (Base) Gas Export (Base) Gas Consumption (Base)
Shale Gas Add.(High) Gas Import Add. (High)
3.3 Gas Bumi dan LPG
Natural Gas and LPG
3.3.1 Gas Bumi
Produksi gas bumi diperkirakan terus menurun karena sebagian besar diperoleh dari lapangan yang sudah tua. Produksi dari lapangan gas baru, seperti lapangan Jangkrik, MDA-MBH Madura, proyek IDD Kutai Basin, Jambaran Tiung Biru, Tangguh Train 3, dan Abadi Masela belum mampu menghentikan laju penurunan produksi gas. Untuk meningkatkan pasokan gas perlu mempertimbangkan gas non konvensional, seperti coal bed methane (CBM) dan
shale gas.
Pengembangan CBM di Indonesia menghadapi beberapa
kendala teknis maupun finansial. Sementara itu, shale gas
di Indonesia memiliki prospektivitas yang tinggi dengan sumberdaya mencapai 574 TCF. Dalam pengembangan
shale gas diperlukan eksplorasi dan eksploitasi secara masif terutama di cekungan produktif untuk menekan biaya operasi. Produksi shale gas diasumsikan akan dimulai tahun 2027 dan meningkat tajam hingga memenuhi 9,9% (skenario dasar) dan 12,6% (skenario tinggi) dari total
3.3.1 Natural Gas
Natural gas production is estimated to decline as most of the
production is obtained from mature fields. Gas production from new gas fields such as Jangkrik field, MDA-MBH
Madura, IDD Kutai Basin project, Jambaran Tiung Biru, Tangguh Train 3, and Abadi Masela are unable to inhibit the decline rate of gas production. Therefore, to increase gas supply, it is necessary to consider non-conventional gas such as coal bed methane (CBM) and shale gas.
The development of CBM in Indonesia faces several technical
and financial constraints. Meanwhile, shale gas in Indonesia
has high prospectivity with resources reaching 574 TCF. In shale gas development, massive exploration and exploitation is needed, especially in productive basins to reduce operating costs. Shale gas production is assumed to start in 2027 and will increase sharply to meet the 9.9% (base scenario) and 12.6% (high scenarios) of total gas demand by 2050. Larger production in the high scenario is stimulated by the higher
Gambar 3.8 Neraca gas
Energy Supply
26kebutuhan gas pada tahun 2050. Produksi yang lebih