P-ISSN:2356-3109 E-ISSN: 2356-3117 1
FAULT DETECTION AND PROTECTION METHOD ON LOW VOLTAGE DC
MICRO-GRID SYSTEM
Sholeh Hadi Pramono1, Eka Maulana2, Hadi Suyono3, Akhmad Zainuri4
1,2,3,4Department of Electrical Engineering, Universitas Brawijaya, Indonesia
Email: 1[email protected]
ABSTRACT
Micro-grid architecture is designed for small scale model in Brawijaya University area in order to change conventional AC-based electricity system previously. Low voltage direct current (LVDC) levels are proposed and charactized to obtain the optimal design of the DC grid system. Some parameters related to the electrical phenomenon of voltage, current and power which occur in distributed-generation, distribution grid, and load sites were also analyzed. Detailed model of photovoltaic (PV) and PMSG was implemented with operational analysis and simulated with study case modes to achieved the power and system efficiency. DC bus is conducted to accommodate the distribution power between PV generation, battery and super capacitor for energy sorage element, distributed-load and other grid utilization.Various condition and operation have been characterized toward stability performance of the voltage and current of 12-36 volts and 0-20 A DC, respectively. This architectural design can be utilized to develop an actual design and small scale implementation of the LVDC smart micro-grid system. Integration of furure energy resources and rapid response for utilities improvement toward customer demand for energy cost saving have been attractive interest to develop smart grid technolgy (Brown, 2008). Micro-grid architecture can be designed for small scale area in order to change conventional electricity system effectively. Smart
generation and distribution of the smart grid has been introduced the concept of active distribution networks in cooperation with distributed grid intelligent (McMilin, 2011). Low voltage direct current (LVDC) levels are suitable to obtain the optimal design of the DC grid system according energy demand and supply in micro scale area (Hamilton and Summy, 2011). The environmental problem with existing grid were attractive combined by utilization of distributed energy resources and distributed energy storage system due to optimalized energy management system (Chatzimisios, 2012). Some parameters related to the electrical variable of voltage, current and power which occur in distributed- generation, distribution grid, and load sites are proposed analyses and observed. Detailed model of photovoltaic (PV) and PMSG was implemented with operational analysis and simulated with study case modes to achieved the power and system efficiency. DC bus is conducted to accommodate the distribution power between PV generation and battery for energy sorage element, distributed-load and other grid utilization. This architectural design can be utilized to develop an actual design for small scale implementation of the LVDC smart micro-grid system.
2.METHOD
Journal of Environmental Engineering & Sustainable Technology (JEEST) Vol. 05 No. 01, July 2018, Pages 1-8
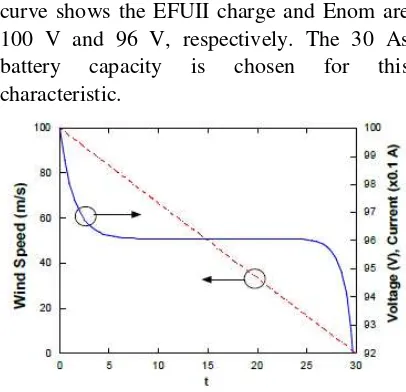
Figure 2: I-V Characteristic of PV modul at different solar irradiance
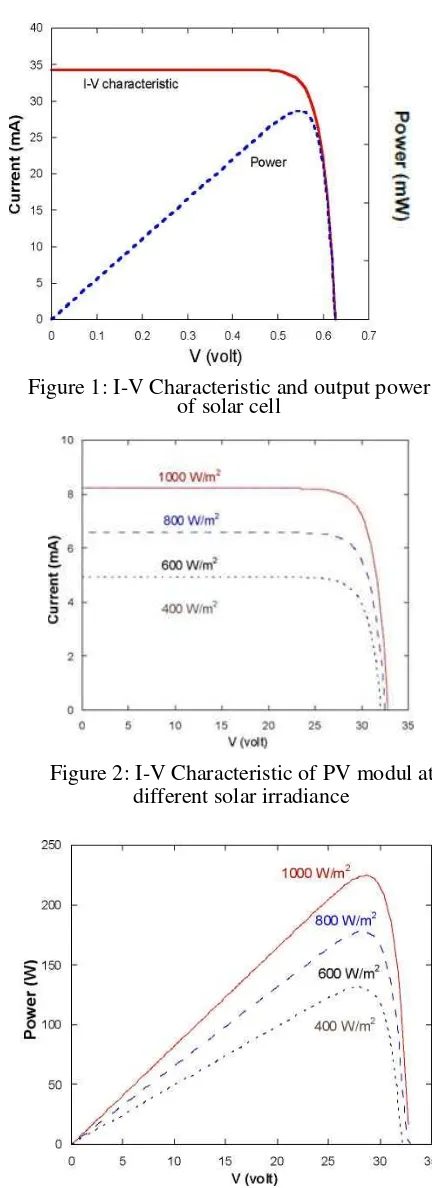
Figure 1: I-V Characteristic and output power of solar cell
𝐼 = 𝐼𝑆𝐶− 𝐼0[𝑒(
𝑞𝑉
𝑘𝑇)− 1] (1)
𝑽𝒐𝒄 = 𝑽𝑻𝒍𝒏[𝟏 +𝑰𝑰𝒔𝒄𝟎] (2).
temperature Tref of 1x10-12A each cell. The circuit short current Isc can be determined according to the solar irradiance S and temperature.While K is current-temperature coefficient and T is the ambient temperature, the PV current IPV is a function of solar irradiation and temperature of PV module is defined by
𝐼𝑝𝑣=𝑆𝑆𝑠𝑛[(𝐼𝑠𝑐+ 𝐾𝑖(𝑇 − 𝑇𝑟𝑒𝑓)] (3)
where Sn and Tref are base solar radiation of 1000 W/m2 and base temperature of 25 °C, respectively. In order to practical devices the series resistance is low and the parallel resistance is high, it can be assume that Isc ~ Ipv generally used in the modeling of PV devices. Solar cell array or module consists of number of parallel Np connection of solar cell which have series RS and shunt RSH resistance. Thus the output current of PV array is described by
𝐼𝐴= 𝑁𝑝𝐼𝑝− 𝑁𝑝𝐼0[𝑒
(𝑉+𝐼𝑅𝑠)
𝑛𝑉𝑇 − 1] − 𝑁𝑝(𝑉+𝐼𝑅𝑠
𝑅𝑆𝐻 ) (5)
The power output at the maximum power point in I-V characteristic under solar irradiation is known as the peak power Pmax of the solar cell is determined by
𝑃𝑚𝑎𝑥 = 𝑉𝑚𝑝𝐼𝑚𝑝 (6)
𝑉𝑚𝑝= 𝑉𝑜𝑐− 𝑉𝑇ln[𝑉𝑉𝑚𝑝𝑇 + 1] (7)
𝑉𝑚𝑝= 𝑉𝑜𝑐− 3𝑉𝑇 (8)
𝐼𝑚𝑝= 𝐼𝑠𝑐− 𝐼0[𝑒
𝑉𝑚𝑝
𝑉𝑇 − 1] (9)
Vmp and Imp show the maximum voltage and current at maximum power point (MPP). The series-parallel connection between cell or module is conducted PV array to generate current and voltage under solar irradiance of 1 kW/m2 during measurement with different temperature. Based on simulation, the solar cell characteristic is
shown in Fig. 1. The PV module I-V characteristic and power output with different solar radiation are shown in Fig. 2 and 3.
P-ISSN:2356-3109 E-ISSN: 2356-3117 3 Figure 5: Battery characteristic curves
2.1.Storage Element Model
Storage element is designed using battery andsuper capacitor. The Ni-MH battery for storage is chosen for mathematical model. This model assumes that the same characteristics for the charging and the discharging cycles. The battery model using only SOC (state of charge) as a state variable is constructed due to accurately reproduce the characteristic curves for the Ni-MH battery. The SOC of Ni-MH battery can be defined by
𝑆𝑂𝐶 = [1 −∫ 𝑖𝑑𝑡𝑞 ] 100% (10)
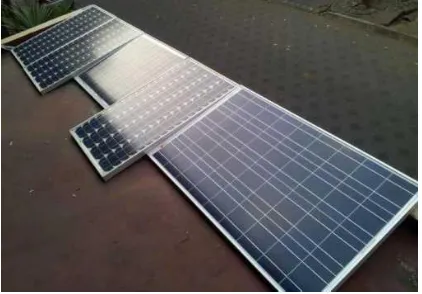
The open voltage source is calculated with a nonlinear equation based on the actual SOC of the battery. The battery model represents a non-linear voltage which depends on the actual battery voltage. This means that when the battery is almost completely discharged and that no current is flowing, the voltage will be nearly zero. This model yields accurate results and also represents the battery, respectively. The battery is modeled using a controlled voltage source with a constant resistance R, current i, voltage constant K, A and B. The K constant is calculated according to charge differential 8Q which determine using nominal charge of Qnom by (Q- Qnom/Q nom). The parameters are derived from the discharge characteristics and assumed to the same for charging cycle. The three necessary points used to extract the model parameters are the fully charged voltage, the end of the exponential zone and the end of the nominal zone and other parameters need for output voltage. State of charge of battery and the characteristics of the battery are shown in Fig. 5. The characteristic
curve shows the EFUII charge and Enom are 100 V and 96 V, respectively. The 30 As battery capacity is chosen for this characteristic.
2.2.Super Capacitor Element
Super-capacitor offers new solution for various application of energy storage. The capacitors are emerging new devices for many applications of as energy buffers or as main energy sources due to their high energy density and high power density (Niu and Yang, 2011). Compared with batteries, super-capacitor has many advantages such as high- efficiency, light-weight, larger current density, wider working temperature range and environmental friendly. The capacitor acts in responding to a sudden power requirement as an auxiliary converter since battery role in regulating DC grid voltage during the off-grid mode. The super-capacitor regulates DC grid voltage at the moment of charging-discharging transition and makes up a lack of power which battery cannot handle.
2.3.Environmental Profile
Journal of Environmental Engineering & Sustainable Technology (JEEST) Vol. 05 No. 01, July 2018, Pages 1-8
Figure 6: Solar irradiation and temperature profile to characterize PV system.
2.4.Micro-grid Architectural Design
Architectural design of micro smart grid model is shown in Figure 7. The developed model is combined using PV module and PMSG wind turbine generator. Each part or node consist of power generation, storage element, controller, and the local load supported by driver or DC-DC converter. The power line between node are interconnectedto construct DC power bus and supplemented by communication line to transmit monitored data applied node. directly.
Figure 7: Grid Design Architecture
3.RESULT AND DISCUSSION
3.1.Prototype Design
The design of the system has been applied in this study included part of solar panels, solar charge controllers, energy storage, energy monitoring and control systems as well as parts of the electrical load which monitored through a PC. Part of solar panels serve as a DC electric generation with variations in the size of the three types, include 100 Wp, 65 Wp and 50 Wp. Electrical parameter of the 100 Wp solar panels module
was maximum power (Pmax) of 100 W + 3%, the working voltage at the maximum power (Vmax) of 18V, operating current at maximum power (Imax) 5.5 A, open circuit voltage (Voc) of 22 V, short circuit current (Isc) of 5.95 at standard test conditions with irradiance energy of 1000 W/m2, 25 °C and AM 1.5. While the 65 Wp PV module has the characteristics of voltage at the maximum power (Vmax) of 17.2 V, the current at maximum power (Imax) of 3.77 A, open circuit voltage (Voc) of 21.4 V and short circuit current (Isc) 4.8 A. The electrical parameters of 50 Wp PV module have a tolerance of + 5% with a working voltage at maximum power (Vmax) of 17,13 V, operating current at maximum power (Imax) of 2.92 A, open circuit voltage (Voc) of 21.63 V and short circuit currents (Isc) of 3.12 A. Installed PV is shown in Figure 8.
Figure 8: Installed PV modules on roof top
P-ISSN:2356-3109 E-ISSN: 2356-3117 5 Figure 9. In this system each parameter
measured and observed to get the data of electrical measurements, such as voltage, current, power, energy and capacity. A monitoring panel handles input power from thePV of 100 Wp, 65 Wp parallel with 65 Wp and 65 Wp with 50 Wp parallel which were connected in star for node monitoring mechanism with direct measurement.
Figure 9: Grid monitoring devices
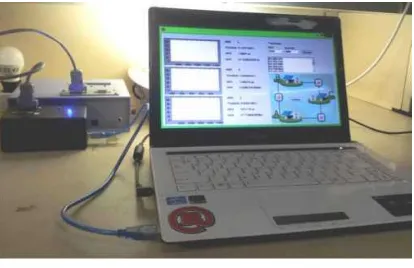
Interconnection between devices monitoring and control are tested the as a slave and a master control that is connected to the PC controller. Communication between device connected in serial RS485 for data transmission of measurement and control signals from the master. Data from the third measurement node (slave) converted and processed before transmitted to the PC via a USB port with a USB-TTL serial converter using baudrate 9600. Control device setup for testing is shown in Figure 10.
Figure 10: Grid controlling using PC.
Desktop program display the measurement results on each node by varying the electrical load is shown in Figure 11.
Based on the obtained data the system has been able to monitor the use of electrical energy from each node simultaneously perform process control power lines connected to the grid directly.
Figure 10: Grid monitoring
device testing process monitoring and control grid using a variation of electrical load types. A node type of load is 7 watt LED lamp Philips 220 volts using a DC to AC inverter (modified sinewave) with measured power of 10.8 watts (12 volts DC and 0,9A). Node B is installed load of LED arrays of 36 volts (56 watts AC) which is connected to a DC-DC converters 12 to 36 V resulting in measurable power of 3.96 watts (12 volts and a current of 0.33 A). While the node C is connected to the load DC 12 V (LED strip) 6 m directly by measuring the power of 3.6 watts (12 volts DC and 0.3 A). Source of light energy used in this test setup is a 125 watt mercury lamp 220 V is installed facing the PV panel. Each use of the electrical load is connected to the slave representing device monitoring measurements for nodes A, B and C simultaneously with RS485 serial communication towards device master.
3.2.Result Analysis
Journal of Environmental Engineering & Sustainable Technology (JEEST) Vol. 05 No. 01, July 2018, Pages 1-8
measure the voltage generated by power supply. Voltage power supply voltage is limited to the range of 8-22 volts and regarded as the input voltage of the voltage sensor
signal conditioner circuit for ADC input is converted into a voltage that can be processed by a microcontroller. The measurement results of the voltage sensor signal conditioner circuits are shown in Table 1.
Figure 11: Grid Power Monitoring Characteristic (a) 1st node 1 (b) 2nd node, (c)
3rd node (d) 3rd node while internal supply and
2nd node connected
Table 1. Voltage Sensor Management
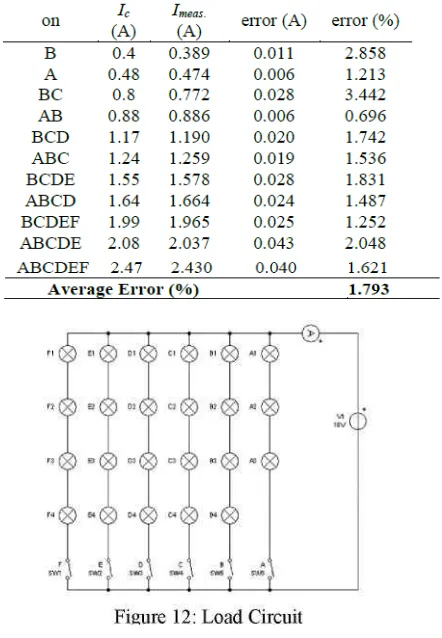
Current sensor is used to measure the current flowing from the power supply to the load lamp and resistor. Measurements performed three times with a supply voltage to the sensor current of 5-12V. Current sensor test results are shown in Table 2.Testing is done by regulating the combination of lights that are arranged as shown in Figure 12. Then turn the switch on the load alternately and sequentially, so that the load current increases. Sensors are used to perform reading of the
current changes. Measurements were taken respectively - helped by using ammeters and current sensor circuit, both readings will be compared. Load types Lamps used specifications 6V/3W with 18V constant voltage source. Testing circuit current sensors are used to measure the current flowing in the load in the form of a series of lights is performed three times. The measurement of sensor circuit is shown in Table 3.
Table 2. Current and Voltage measurement
P-ISSN:2356-3109 E-ISSN: 2356-3117 7 The test results on the circuit relay switching
times indicate the time required to perform switching or the relay work interchangeably. Table 6 and Figure 13 shows the rise time tr and falling time if when the relay work interchangeably. Table 4 shows the relay is used for switching voltages with different values, this mechanism is done to facilitate the observation. According to the table, it shows the fall time and rise time for the transfer voltage. Thus the average - average time required to perform the switching process is over 6.71ms.
Figure 13: Signal Profile During Switch Time
4. CONCLUSION
Based on the research which has been carried out, some of the conclusions obtained as follows: The design of the system has been successfully carried out installation design of network architecture at the level of low-voltage DC-based solar cell with a basic voltage of 12 volts DC. As a source of plant used three different types of PV modules of 100 Wp, 65 Wp and 50 Wp. SSC is used to control battery charging with locally varying load. The device can monitor the voltage,
current and power on the system monitoring directly. The data result can be transmitted through the measurement is devais devais slave node to the master for display to a PC via RS485 communication. Each node can be tested with 220 V AC load through the conclusion inverter 300 watt, LED array load DC 36 volts through a converter 12 DC to 36 DC (56 W) as well as 12 DC LED strip load of 3.6 W. The results of the measurement characteristics devais indicates the system has a function properly, it is evident from the measurement of electrical current and voltage are measured by the average error rate is margin of 3-2-2-3 cm (left-top-right-bottom). Width of each column is 7.5 cm with gap between column is 1.5 cm using Times New Roman 11 point and single space. This paper is in Microsoft Word format and can be sent at any time through email [email protected]
REFERENCE
Brown, RE. (2008). Impact Of Smart Grid on Distribution System Design. In Proc. IEEE Power Energy Soc. Gen. Meet -Convers Del. Electr. Energy 21st Century 2008.
Chatzimisios, P. Stratogiannis, D. Tsiropoulos, G. Stavrou, G. (2012). A Survey On Smart Grid Communication: From An Architecture Overview To Standardization Activities. In
Handbook of Green Information and Communication Systems, New York. Elsevier, 2012.
Hamilton, B. and Summy, M. (2011). Benefit of The Smart Grid . IEEE Power Energy Mag, 9(1), pp.102-104.
Hua Ye, Juan Su, Songhuai Du. (2013). Simulation and Analysis of PMSG-based Wind Energy Conversion System using
Table 4. Switching time for grid connected.
Journal of Environmental Engineering & Sustainable Technology (JEEST) Vol. 05 No. 01, July 2018, Pages 1-8
Different Coverter Models. SciRes Engineering, 2013, 5, 96-100.
McMilin. B. Akella, R. Ditch, D. Heydt, G. Zhng, Z. (2011). Architecture Of Smart Microgrid Distributed Operating System. In