ISSN: 2339-076X, Volume 2, Number 3 (April 2015): 347 - 354
DOI:10.15243/jdmlm.2015.023.347
Research Article
The potential of hydrophyte plants for remediation of liquid waste of
tapioca factory
E.R. Indrayatie
1*, E. Arisoesilaningsih
2 1Faculty of Forestry, Lambung Mangkurat University, Banjarbaru, South Kalimantan, Indonesia
2
Faculty of Science, Brawijaya University, Jl Veteran-Malang 65145, Indonesia * corresponding author: [email protected]
Abstract
: The
potential role of a macrohydrophyte plant (Vetivera zizanioides) and four semihydrophyte plants (Ipomoea aquatica, Cyperus iria, Commelina nudiflora, Oryza sativa) as remediators of liquid waste of tapioca industry was tested in a glasshouse for 35 days under conditions that resemble to wet and polyculture systems. Results showed that all type of plants grew normally on media containing tapioca liquid waste. Total biomass of I. aquatica and polyculture grown in wet conditions were 32.35 g and 38.44 g, respectively. These were higher than those of control (30.53 g and 36.39 g). Those ofV. zizanioides,C. iria, C. nudifloraandO. sativawere inversely observed. However, V. zizanioidesshowed the highest tolerance index value (120.99%) compared to that ofI. aquatica(91.21 %), C. iria(56.62 %), C.nudiflora(89.63 %), O. sativa(83.13 %),and polyculture (62.25 %).Keywords: macrohydrophyte, remediator, tapioca liquid waste
Introduction
Tapioca factory in the production process generates solid waste, liquid waste and waste gas. So far, in almost all of the tapioca factories, liquid waste is managed only by way of deposition in tanks for subsequent deposition of waste into public water bodies. This kind of handling proved that the environment is very disturbed, especially the aquatic environment. The results of other studies indicate that the water quality of Cijolang river exceeds the quality standards, the downstream cyanide content is of 1.16 mg/L (the quality standard of 0.3 mg/L) and pH 3.5 (minimum quality standard pH 6.6). This is due to the disposal of untreated waste by tapioca industry in the upstream region, causing foul odors and the death of aquatic biota (Sunaryo, 2003). This evidence indicates that the quality of effluent discharged into water bodies exceed the quality standards that have been set.
Several observations indicate that the composition of tapioca waste water containing some organic matter in which the COD is 7,000-14,243 mg/L, BOD of 6,200-13,200 mg/L, TSS of 500-3,080 mg/L, which is high ratio of organic nitrogen and BOD/COD (Sunaryo, 2003). The
water quality standards, namely tapioca mill waste had BOD of 150 mg/L, COD of 300 mg/L, TSS 100 mg/l and cyanide of 0.2 mg /L (Bapedal, 2002). The wastewater treatment can be done in physical/mechanical, chemical, or biological. The physical waste treatment of the industrial tapioca wastewater, as noted above, was less effective. The chemical wastewater treatment, in addition to the expensive cost, also raise the risk of contamination from chemicals used. Therefore, biological waste treatment is a promising option. The use of microorganisms require relatively high technology and expensive, whereas tapioca industry in Indonesia in general is an industry of small to medium-sized industries. Thus, the use of higher plants, which came to be known by the term "phytoremediation" is most suitably developed in Indonesia. Plants can reduce the content of pollutants in the media by extracting or immobilizing pollutants from soil and/or water. This technology that is a relatively new technology, is quite effective, with relatively low cost in the management of hazardous waste (Environmental Protection Agency, 2000).
The potential of hydrophyte plants for remediation of liquid waste of tapioca factory
organic substances in the plant tissues (Zayed et al., 1998). In addition, plants can stimulate microbial immobilization of heavy metal stood in the rhizosphere (Zhu et al., 1999). Phytoremediation works well on the low to moderate levels of pollution. From the existing research, the plants that are well suited for phytoremediation are Duckweed (Lemna minor L.), water hyacinth (Eichhornia crassipes), salvinia (Salvinia natans), hybrid poplar (Populus trichocarpa) (Baker, 1994; Zayed et al. 1998). While the other plants are Ipomoea aquatica, Cyperus iria and Commelina nudiflora. The purpose of this study was to compare the growth of some plants as the remediator of tapioca wastewater.
Materials and Methods
Vetivera zizanioides, Ipomoea aquatica, Cyperus iria, Commelina nudiflora (macrohydrophytes), andOryza sativa(semihydrophyte) were used for this study. Each plant species was acclimatized by growing the plants on soil flooded with distilled water. After 2 weeks of acclimatization, each plant species was planted on a 10 kg plastic pot containing 5 kg of soil. The pot was then flooded with tapioca wastewater up to 10 cm from the soil surface (wetland system). In addition to five plant species that were planted separately on a separate pot, the five plant species were also planted together (polyculture) in one pot. Six treatments (five plant species and one polyculture), were arranged in a randomized complete design with three replicates. For comparison, the six treatments were planted in soil medium that was flooded with distilled water only. The plants used for comparison only have one replication.
The study was done in the glasshouse of the Faculty of Science, Brawijaya University. The soil used for this study contained 0.7 mg cyanide/kg. The tapioca wastewater obtained from the deposition process of tapioca factory of PT. Sumber Timur, Dampit District of Malang, had the following characteristics, pH 3.97, BOD 2,530 mg/L, COD 2,870 mg/L, and cyanide 3.39 mg/L. During the plant growth (35 days), distilled water was added every four days to replace water lost through evapotranspiration.
At harvest (35 days), plant shoots and roots were separated and washed carefully with water. The plant materials were then dried in an oven at a temperature of 70° C for 48 hours until a constant dry weight. Index of Tolerance value was obtained by measuring the ratio of root growth under pollutants treatment compared with that of no pollutants treatment (Baker, 1994). The root
growth is reflected by the root biomass. Chemical properties of the planting media (tapioca waste water and distilled water observed at the harvest time were pH, BOD (Biological Oxygen Demand), COD (Chemical Oxygen Demand), Dissolved Oxygen/DO (dissolved oxygen), cyanide, % improvement of effluent quality. BOD was measured in the laboratory using the optimal conditions at a temperature of 20° C for 5 days. COD was analyzed using potassium dichromate (K2Cr2O7) as a strong oxidizing agent. Cyanide
was analyzed by titrimetric method with standard silver nitrate titration (AgNO3). Improvement of
effluent quality was obtained by measuring the difference of effluent concentration at before and after phytoremediation (Xia et al., 2004).
Results and Discussion
Plant growth after the remediation process of tapioca mill wastewater
Data presented in Figure 1 show that all the plants were able to grow in tapioca wastewater. The slowest growth was observed for C. iria, O. sativa, while the highest was C. nudiflora. The growth of V. zizanioides, polyculture and I. aquatic were almost similar. If the total plant biomass of treatment (wetland system with effluent) compared to that of the control (the land system), C. nudiflora produced either the highest total plant biomass grown on control medium (60.96 g), or media containing waste (55.43 g).
Figure 1.The total biomass of various types of crops grown on flooded soil waste (treatment) and flooded distilled water (control) after the process of phytoremediation
Figure 2. Mean root biomass, the top, the total variety of plants after the phytoremediation process.
The highest total biomass (55.43 g) was also obtained byC. nudiflorafollowed by polyculture (38.44 g), V. zizanioides (35.98 g), I. aquatica (32.35 g),O. sativa(19.25 g) andC. iria(5.52 g). The judging of plant resistance to metal and
The potential of hydrophyte plants for remediation of liquid waste of tapioca factory
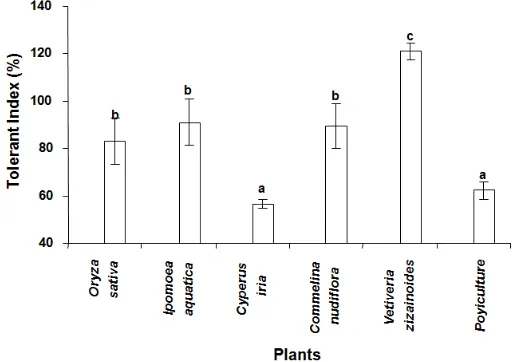
biomass. The results of observations presented in Figure 3 show that the highest tolerance index (120, 99%), was derived from remediation byV. zizanioides followed by I. aquatic (91.21%), C. nudiflora (89.63%), O. sativa (83.13%), polyculture (62.35%), and C. iria (56.62%). The high tolerance index of V. zizanioides in this experiment proved that this plant species was able
to grow and resistant to adverse environmental conditions, namely pH (3.9), the concentration of cyanide (3.97 mg/L), BOD (2,530 mg/L), COD (2,870 mg/L) and very low DO. This is in accordance with the opinion of Truong (2001) that V. zizanioidescan grow on soil /media having pH 3-9 and tolerant towards contaminated soil.
Figure 3. Mean Tolerance Index (%) of various types of plant after phytoremediation process
The quality of tapioca liquid waste after harvest
In general, all the plants used to remediate tapioca wastewater showed a marked improvement with a reduction in the concentration of BOD, COD, cyanide and an increase in DO and pH values of the solution. The analysis showed that the six treatments significantly showed different effects on the DO, BOD, COD, cyanide content (P≤0.01) and pH (P≤0.05).
Dissolved Oxygen (DO) is a basic requirement for plant and animal life in the water (Maier et al., 2000). Figure 4 shows that the presence of the five plant species were able to increase the DO from 0 to 3.75 to 5.52 mg/L. The increase of the concentration of DO was due to the results of the process of photosynthesis of aquatic plants and algae (Fardiaz, 1992). The highest DO concentration was observed for V. zizanioides(5.52 mg/L), followed by polyculture (5.19 mg /L), C. nudiflora (4.87 mg/L), C. iria (4.73 mg/L), I. aquatic (4.54 mg/L) O. sativa (3.75 mg/L). The highest DO increase was observed for V .zizanioides from 0 to 5.52 mg/L for 35 days. This suggests thatV. zizanioideswas able to create better conditions and could create better conditions for life of microaerophylic microorganisms and aquatic biota compared to
other plant species tested. This is consistent with the results of Truong (2001) thatV. zizanioidesis able to treat domestic waste scent of waste from toilets and improving DO less than 1 mg/L to 8 mg/L within four weeks in hydroponics. The results of the observations presented in Figure 4 show that all kinds of plants used in this study were able to decrease the concentration of cyanide in tapioca wastewater from 3.38 mg/L down to 0.98 to 0.64 mg/L (71-81 %). The decrease in the concentration of cyanide was in the following orders, O. sativa 0.97 mg/L, C. iria 0.85 mg/L, the plant polyculture 0.81 mg /L, C. nudiflora 0.78 mg/L, I. aquatic 0.78 mg/L, and V. zizanioides0.64 mg/L.
Figure 4 Mean of DO concentration and cyanide (mg /L) wastewater phytoremediation of various different types of plants.
Biological Oxygen Demand (BOD) indicates the amount of dissolved oxygen needed by living organisms to break down or oxidize the waste material in the water. Chemical Oxygen Demand (COD) shows the amount of oxygen required by oxidizing agents to oxidize organic materials in the water. Figure 5 shows that for all five plant types reduced BOD concentration from 2530 mg/L to 79.33 to 20 mg/L (96.9 to 99.3%) and COD from 2870 mg/L to 95.67-32.67mg/L (96.7 to 98.9%). BOD concentration was in the following order, O. sativa (79.33 mg/L), I. aquatic (45.33 mg/L), C. iria (31.67 mg/L), C.
nudiflora (25.33 mg/L), V. zizanioides (20.33 mg/L), and polyculture (20 mg /L). COD concentration was in the following order, O. sativa(95.67 mg/L), I. aquatic(61.33 mg/L), C. iria (44.67 mg/L), C. nudiflora (35.67 mg/L), polyculture (32.67 mg/L) and V. zizanioides (30.67 mg/L). The results of the observations presented in Figure 5 show that V. zizanioides made the highest rate of decline in COD concentration which was equal to 98.93% followed by a decrease in the BOD concentration for 99.2%.
Figure 5 The mean concentrations of BOD and COD (mg /L) wastewater phytoremediation of various types of plants.
The wastewater remediation made by each of the five plant species planted separately and that made by all of the five plant species planted
The potential of hydrophyte plants for remediation of liquid waste of tapioca factory
decrease in COD concentration. This is indicated by the presence of a strong correlation between the concentration of BOD and COD (r =0.981**). The decrease in BOD and COD concentrations is due to the degradation of pollutants (starch and cyanide) by microorganisms that cause a reduction for pollutants. Microorganisms use oxygen dissolved in the degradation process. Decreasing the amount of pollutants to the end of the remediation leads to reduction of dissolved oxygen used by microorganisms to degrade, causing the rest of dissolved oxygen (DO) in the wastewater to be increased. Therefore, DO concentration changes will affect concentrations
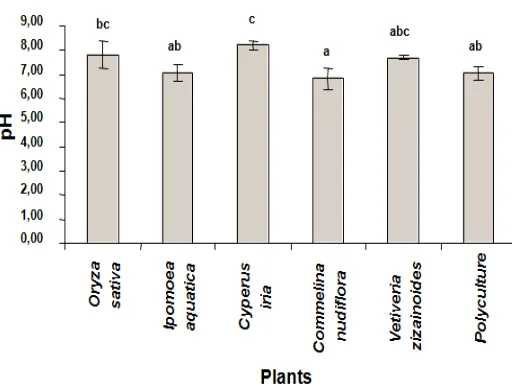
of BOD and COD. This can be seen in Figure 6 that the increase in DO concentration reduced BOD concentration logarithmically with a coefficient of determination R2= 0.91 and R2 = 0.89 for COD. Figure 7 shows that the all tested plants were capable to increase pH of the acidic nature of 3.97 to near neutral to alkaline, for C. nudiflora (6.81), polyculture crop (7.05). I. aquatica (7.05), V. zizanioides (7.7), O. sativa (7.80), andC. iria(8.23). The increase of pH by the tested plants proves that the presence of roots and metabolic processes can make a better microenvironment.
Figure 6. The pattern of the relationship between the concentration of DO (mg /L) with concentrations of COD and BOD (mg /L)
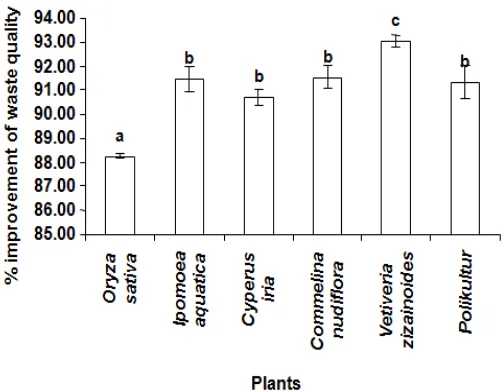
An examination of the ability of plants to improve quality of tapioca wastewater, the five plants species tested in this study demonstrated their ability to improve the quality of tapioca wastewater. Figure 8 show that V. zizanioides made the highest improvement of wastewater quality (BOD, COD and cyanide) (93.06%),
followed by C. nudiflora (91.56%), I. aquatic (91.49%), polyculture (91.34%),C. iria(90.71%), and O. sativa (88.24%). The higher effluent quality improvement of tapioca plant by V. Zizanioides compared to the other plants in this experiment showed thatV. zizanioides is a plant that is best used as a remediator.
Figure 8. Mean % improvement of effluent quality (BOD, COD and cyanide) after phytoremediation of various types of plants.
Conclusion
All plants used in this experiment, namely V. zizanioides, I. aquatica,C. iria, C. nudiflora,O. sativa, and polyculture could grow on media containing tapioca factory wastewater. Total biomass ofI. aquaticand polyculture planted with wetland system that were 32.35 g and 38.44 g, respectively, werehigher than the control (30.53 g and 36.39 g), while V. zizanioides, C. iria, C. nudiflora, O. sativa, was the otherwise. But as seen from the level of tolerance towards liquid waste, which is expressed in "tolerance index", then V. zizanioides had the highest score which
was120,99% compared toI. aquatic(91.21%),C. iria (56 ,62%), C. nudiflora(89.63%), O. sativa (83.13%), and polyculture (62.25%). Judging from the quality of waste,V. zizanoideswas able to improve the quality of tapioca wastewater better than plantsI. aquatica,C. iria,C. nudiflora, O. sativafor 37 daysinwetlandsystems.
Acknowledgements
The authors thank Faculty of Science, Brawijaya University of Malang for providing glasshouse facilities to undertake this study.
References
Baker, R. 1994. Accumulation and exludert strategies in the respond of plant to heavy metals. Journal of Plant Nutrition3:643-654.
Bapedal. 2002 Quality Standard for Industrial Wastewater or other Business Activities in East Java. Environmental Impact Management Agency, East Java Province. (in Indonesian)
Environmental Protection Agency. 2000. Introduction to phytoremediation. National Risk Management Research Laboratory, Ohio, EPA/600/R-99/107. Fardiaz, S. 1992. Water and Air Pollution. Kanisius,
Yogyakarta. (in Indonesian)
Harrison. J. 2002.Polution: Causes, Effect and Control. Royal Society of chemistry, Birmingham.
Maier, R.M, Peper, I.L. and Gerba, C.P. 2000.
Environmental Microbiology. Academic Press, San Francisco.
Sunaryo. 2003. Water pollution of Cijolang river. Bapedalda, West Java. (in Indonesian)
Truong, P. 2001. Vetiver grass technology. a tool environmental degradation and desertification in Liberia. Resource Sciences Centre Queensland Department of Natural Resources Brisbane, Australia.
The potential of hydrophyte plants for remediation of liquid waste of tapioca factory
Conference on Vetiver. Office of the Royal Development Project Board, Bangkok. 393-403. Young, A. dan Jordan, B. 1996. Cyanide remediation:
Current and Past Technologies.Proceedings of the 10th Annual Conference on Hazardous Waste Research. Department of Metallurgical Engineering Montana Tech, Butte.
Zayed, A., Gowthaman, S. and Terry, N. 1998. Phytoaccumulation of trace elements by wetland plants: I. duckweed. Journal of Environmental Quality27:715-721.
Zhu Y.L., Zayet, A.M. Qian, J.H., de Souza, M. and Terry, N. 1999. Phytoaccumulation of Trace Elements by Wetland Plants: II. Water Hyacinth.