Alamat Korespondensi:
Adhi Prasetio, Jurry Hatammimi, Sekolah Manajemen Telekomunikasi dan Media Institut Manajemen Telkom Jl. Telekomunikasi, Terusan Buah Batu, Dayeuh Kolot, Bandung 40257 [email protected]
The Potential Customer Duration/Visit Characteristic Based on Traffic
Source in a Service Provider Web Site
Adhi Prasetio, Jurry Hatammimi Sekolah Manajemen Telekomunikasi dan Media
Abstract: The purpose of this research is to find out if there are any significant duration/visit difference between potential customers who come from direct, search and referral traffic sources in a service provider web site. Sample data were collected from google analytics then analyzed using descriptive statistic and ANOVA. The result shows that duration/visit from referral is the lowest and direct is the highest compare to other traffic sources.
Keywords: service provider, duration/visit, traffic source, search, referral, direct traffic
Abstrak: Tujuan dari penelitian ini adalah untuk menemukan pakan terdapat perbedaan durasi/kunjungan yang signifikan antara pelanggan potensial yang berasal dari pengunjung pencarian langsung (direct), pengunjung traffic, dan pengunung referral (rujukan) pada situs web dari penyedia layanan. Data sampel dikumpulkan dari google analytic yang kemudian dianalisis dengan menggunakan statistik deskriptif dan ANOVA. Hasilnya menunjukkan bahwa durasi/kunjungan yang berasal dari sumber pencarian referral menunjukkan nilai yang terendah; sumber pencarian langsung menunjukkan yang tertinggi dibandingkan dengan sumber pencarian traffic.
Kata Kunci: penyedia layanan, pencarian langsung, pengunjung
E-commerce is business activity conducted through electronic means (Timmers, 2000) and in particular using the Internet network communication (Turban, King and Chung, 1999; Laudon, 2012). The most popular internet service to run e-commerce is web site. Visitors in an e-commerce web site that provide service are very important. Those visitors are potential customer that can be converted to fulfill web site’s goal. Web site owner utilize many marketing promotion programs to attract visitors to their web site. These visitors are potential customers that should be monitored and optimized. Chaffey (2009:708) suggested that, monitoring visitors interaction with web site such as their duration is very important.
Moreover, Chaffey also mentioned that web site owner should monitor whether interaction leads to satisfactory marketing outcomes such as new leads or sales.
Visitor engagement is an important factor for a web site to maximize revenue especially for online publisher (Chaffey, 2009:83). Visitor engagement can be indicated by their stickiness with a web site.
Chaffey (2009:708) define stickiness as ”an indication of how long a visitor stays on-site”. Chaffey (2009:712) also mentioned that duration and page views can be used to measure stickiness.
Some study shows that traffic source has influence stickiness. Potential customers that come from various traffic sources have different stickiness characteristic. This gives an opportunity for web site owner to measure which traffic source is more effective to gain better stickiness.
difference between direct and referral visitors average Page views/visit. Content provider web site object in this research use advertisement as it’s revenue source.
Prasetio (2013) showed different result for different web site’s goal, so it’s still important to find out stickiness characteristic based on traffic source especially in an operating service provider web site whose goal is to convert potential customer into sales. Laudon (2009:506) explained that stickiness or duration is important to marketers because the longer the amount of time a visitor spends at a web site, the greater the probability of a purchase.
The object of this study is kursus-online.com, a service provider website. The service provided by this website is tutorial related to the learning how to create a website. This web site uses subscription revenue model as it’s revenue source.
This research will try to find out if there are any differences between duration/visit based on the traffic sources. The traffic sources measured are direct, referral, and search.
MODEL, ANALYSIS, DESIGN AND
IMPLE-MENTATION
This is a quantitative comparative research to find if there are any differences between independent group. The period of observation is between January 2008 and December 2012.
The research used the one way analysis of variance (ANOVA) to compare the duration/visit from 3 group of traffic source data: Direct, referral and search. The hypothesis for this research is as follows:
H0 : There are no differences between duration/ visit mean based on different traffic sources (direct, referral, search visitors) (1 = 2 = 3)
H1 : There are differences between duration/visit mean based on the traffic sources (direct, referral, search visitors) (one of the ì is not equal)
Duration/visit data retrieved from website statistics called Google Analytics. Google Analytics is the most widely used tool to measure the performance of the website. Statistics from BuiltWith
used by 61.5% of top 100,000 web sites which use the web analytics.
Google Analytics has grouped data into 3 main category: direct, search and referral traffic source. This data group has met our research requierements. The data used in this study is the monthly based data and using the saturated samples. This monthly duration/visit data is an average data calculated from all visitors that come in a particular month. We gather 60 datas for each group (traffic sources), that makes 180 datas in total.
THE RESULT
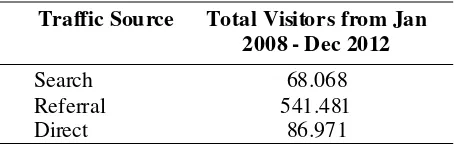
The visitor’s profile for the kursus-online.com between January 2008 and December 2012 is presented in Table 3.1.
Table 3.1. Visitors of the www.kursus-online.com
Traffic Source Total Visitors from Jan 2008 - Dec 2012
Search 68.068
Referral 541.481
Direct 86.971
The above data shows the dominance of the traffic come from referral visitors, followed consecutively by direct and search visitor. This is normal because kursus-online.com utilize affiliate systems to get visitors as main marketing online tool. The descriptive data for this study presented in Table 3.2.
The descriptive analysis from that table can be described as follows:
• The average duration/visit for referral traffic source visitors has an average of 136.92 sec-onds/visit, the lowest compared to other traffic sources. With the 95% confidence level or 5% significance. Average duration/visit is at the range of 128.88 seconds/visit to 146.95 seconds/visit. Duration/visit minimum is 62 seconds/visit and the maximum is 248 seconds/visit.
visit. Duration/visit minimum is 166 seconds/visit and the maximum is 687 seconds/visit.
• The search visitors has the average of 273.07 seconds/visit. With the 95% confidence level or 5% significance, average duration/visit is at the range of 256.11 seconds/visit to 290.02 seconds/ visit. Duration/visit minimum is 110 seconds/visit and the maximum is 417 seconds/visit.
Table 3.2. Duration/visit Statistic
The result shows that:
• the average duration/visit of Search traffic source is defferent from Direct anda Referral traffic source
• the average duration/visit of Direct traffic source is defferent from Search anda Referral traffic source
Descriptives
Duration
N Mean Std. Deviation Std. Error
95% Confidence Interval for
Mean Minimum Maximum
Lower Bound Upper Bound
Sear ch 60 273,07 65,624 8,472 256,11 290,02 110 417
Dir ect 60 367,35 102,196 13,193 340,95 393,75 166 687
Ref erral 60 136,92 38,845 5,015 126,88 146,95 62 248
Total 180 259,11 119,819 8,931 241,49 276,73 62 687
The samples didn’t meet the homogenity of variance assumptions of ANOVA, but since the data have equal data sizes in each group, we still can use ANOVA in this procedure (Levine:2006).
Table 4.3 Homogeneity Varians Test Result
Test of Homogeneity of Variances
Duration
Levene Statistic df1 df2 Sig.
19,441 2 177 ,000
Furthermore we present the result of the ANOVA calculation. The first result is concern about the partitioning of variations.
The above calculation shows the calculated F value is 148.576. Next, we tested the level of significance of the calculated F then tested compare with the F table . Using 5% alpha, numerator value of 2 and denumerator value 177 we have the F tabel value of 3.05. Referring to the provision that if calculated F > F table means that Ho is rejected, that is the three population tested are different.
• the average duration/visit of Referral traffic source is defferent from Direct anda Search traf-fic source
The result of this research shows that potential customers or visitors that come from direct traffic source has the highest duration/visit average, followed by search and referral as the lowest. This result consistent with Omidvar’s findings that direct traffic source has higher impact on stickiness compared to referral visitors (Omidvar, 2011).
Google define direct traffic as traffic that does not originate from search-engine results or a referring link in a domain for example visitors who use a bookmark or type a web site’s URL into his or her browser.
Multiple Comparisons
Dependent Variable:Duration
(I) Traffic Source (J) Traffic Source
Mean
Difference (
I-J)
Std.
Error Sig.
95% Confidence Interval
Lower Bound Upper Bound
Tukey HSD Search Direct -94,283* 13,441 ,000 -126,05 -62,51
Referral 136,150* 13,441 ,000 104,38 167,92
Direct Search 94,283* 13,441 ,000 62,51 126,05
Referral 230,433* 13,441 ,000 198,66 262,20
Referral Search -136,150* 13,441 ,000 -167,92 -104,38
Direct -230,433* 13,441 ,000 -262,20 -198,66
LSD Search Direct -94,283* 13,441 ,000 -120,81 -67,76
Referral 136,150* 13,441 ,000 109,62 162,68
Direct Search 94,283* 13,441 ,000 67,76 120,81
Referral 230,433* 13,441 ,000 203,91 256,96
Referral Search -136,150* 13,441 ,000 -162,68 -109,62
Direct -230,433* 13,441 ,000 -256,96 -203,91
*. The mean difference is significant at the 0.05 level.
Wang also mentioned that returning visitor’s high engagement with a web site are probably caused by their interests or information needs.
The nature of subscription revenue model customer also has impact to the length of visit. Customer who already subscript to the web site will also become a returning visitor. Due to their interest to learn on the web site, they are more likely to stay longer during their lerning session.
Referral and search visitors are usually new visitors. This type of visitor usually don’t stay long on the site and did not explore much of the contents on the site (Wang, 2010).
The result shows that referral visitors have the lowest duration/visit compared to other traffic sources. This result indicates that the referring web pages doesn’t have relevant topic with the product.
In order to understand search visitors behavior, Omidvar (2011) offers that their quarries meaning should be understood which is available through semantic web technologies. This analysis doesn’t included in this research.
CONCLUSION
Conclusion
The result shows that at kursus-online.com, a service provider web site, direct traffic source has the highest average duration/visit, followed by search and referral as the lowest.
This research support Omidvar’s findings that in a web site that sell product, direct visitors has better stickiness compared to other traffic sources. This result also indicates that direct visitors provide better potential customers for a service provider web site.
Recommendation
REFERENCES
Omidvar, M.A., VR. Mirabi, and Narjes, S. 2011. Analyzing The Impact Of Visitors On Page Views With Google Analytics. International Journal of Web & Seman-tic Technology (IJWesT) (serial online). 2. Available from www.airccse.org (accessed Sep 15, 2009) BuiltWith. 2013. ”Google Analytics Usage Trends”.
Avai-lable at: http://trends.builtwith.com/analytics/Google-Analytics. (accessed on Jun 12, 2013).
Chaffey, D. 2009. E-Business and E-Commerce Manage-ment: Strategy, Implementation and Practice, 4th
Edi-tion. Prentice Hall.
Google. 16 October 2012. All Traffic Help. Available at: h ttps://support.google.com/an alytics/an swer / 1247833?hl=en&ref_topic=1308584 . (accessed on Jun 5, 2013).
Google. 24 January 2013. About Multi-Channel Funnels Data. Available at: https://support.google.com/ analytics/answer/1319312?hl=en. (accessed on Jun 15, 2013).
Laudon, K.C., and Traver, C.G. 2012. E-commerce Business, Technology, Society 8th Edition. Pearson.
Levine, David, M., Krehbiel, T.C., Berenson, Mark, L. 2006.
Business Statistics: A First Course - Fourth Edition. Pearson.
Prasetio, A., Sharif, O.O., Turipanam, D.A., Partono, A. 2013.
The Impact of Traffic Source on Page Views. In: Pro-ceedings The 7th International Conference on In-formation & Communication Technology and Sys-tems, Department of Informatics, Faculty of Informa-tion Technology, ITS, May, 15-16, 2013.
Turban, E., & J. Lee, D.K., and H.M. Chung. 1999. Elec-tronic Commerce: A Managerial Perspective.
Prentice Hall, 1999.
Timmers, P. 2000. Electronic Commerce-Strategies and Models for Business-to-Business Trading. John Wiley & Sons, 2000.