THE PEER ASSESSMENT RATING CALCULATION ON 2 DIMENSIONAL TEETH MODEL IMAGE FOR THE CENTERLINE COMPONENT AND TEETH SEGMENTATION ON THE
OCCLUSAL SURFACE TEETH MODEL IMAGE
Hanif Arief Wisesa1, Ratna Rustamadji2, Miesje Marmiati Purwanegara2, M. Febrian Rachmadi1, and Benny Hardjono3
1Faculty of Computer Science, Universitas Indonesia, Kampus Baru UI, Depok, 16424, Indonesia 2Faculty of Dentist, Universitas Indonesia, Kampus Salemba UI, Jakarta Pusat, 10430, Indonesia 3Faculty of Computer Science, Universitas Pelita Harapan, Lippo Village, Tangerang, 15811, Indonesia
E-mail: [email protected]
Abstract
The PAR (Peer Assessment Rating) Index is used by orthodontists around the world to calculate the severeness of a malocclusion. A malocclusion is a dental disease where the teeth are not properly aligned. In Indonesia, the number of malocclusion is relatively high. The occurrence of orthodontics who can treat malocclusion is also low in Indonesia. In 2013, a research is done to create the tele-health monitoring system to provide better treatment of malocclusion in Indonesia. The research is further improved by using different Adaptive Multiple Thresholding methods to segmentate the ima-ge. The result will be used to calculate the Centerline component of the PAR Index. The result is a system that could calculate the PAR Index automatically and is compared to the results using manual method.
Keywords: teeth segmentation, malocclusion, orthodontics, automatic, PAR Index
Abstrak
Indeks PAR (Peer Assessment Rating) adalah suatu tolak ukur yang digunakan oleh dokter gigi spesialis orthodonti untuk menghitung tingkat keparahan maloklusi. Maloklusi adalah suatu penyakit gigi yang menyebabkan gigi tidak tersusun secara rata. Jumlah kasus maloklusi di Indonesia relatif tinggi. Jumlah dokter gigi spesialis orthodonti yang menangani kasus maloklusi adalah rendah di In-donesia. Pada tahun 2013, sebuah riset dilakukan untuk membuat sebuah telehealth monitoring sys-tem untuk mempermudah penanganan maloklusi di Indonesia. Riset ini kemudian dikembangkan lebih lanjut dengan teknik segmentasi Adaptive Multiple Thresholding untuk mensegmentasi citra. Hasil dari segmentasi citra akan dilakukan perhitungan Centerline dari indeks PAR. Hasil akhir ada-lah sistem yang dapat melakukan perhitungan secara otomatis dan hasil dari perhitungan tersebut ak-an dibak-andingkak-an dengak-an perhitungak-an mak-anual yak-ang dilaukak-an oleh dokter gigi spesialis orthodonti.
Kata Kunci:segmentasi gigi, maloklusi, orthodonti, otomatis, indeks PAR
1. Introduction
Malocclusion is a type of dental disease where the teeth of a person are not aligned properly. This co-uld cause the jaw to misalign [1]. The complica-tion of this disease could cause discomfort, culty of breathing, difficulty of swallowing, diffi-culty of talking and aesthetics issues of the pati-ent’s face. The disease could be caused by family genetics, daily diets and trauma caused by accede-nt. This disease could be treated by orthodontists by applying dental braces to re-align the patient’s teeth.
The Peer Assessment Rating (PAR) Index is a method for evaluating the severeness of maloc-clusion [2]. This index was developed by
Richmo-nd aRichmo-nd frieRichmo-nds in 1987. It is one of the most po-pular malocclusion calculation method used by or-thodontists. The calculations of the PAR index are done by measuring the misaligned parts of the tee-th as guided in tee-the instructions. A normal dentist will need a special training and guidance from an orthodontist to perform this calculation.
Studies have shown that many Indonesians are suffering from this disease therefore, treatme-nts are needed [3]. According to the Indonesian Medical Council (KKI), there are 25,198 dentists in Indonesia [4]. This number is not enough accor-ding to OEDC countries guidelines. They stated that there needs to be 50 to 80 dentists for every 10,000 people [5] If those numbers are scaled to the Indonesian population, around 118,000
2, June 2014
TABLE 2
CENTERLINE COMPONENT OF THE PAR INDEX [2]
Score Description
0 If the centerline difference between the lower and upper jaw is less than a quarter of the width of the first incisor of the bottom jaw. 1 If the centerline difference between the lower
and upper jaw is between a quarter and a half of the width of the first incisor of the bottom jaw.
2 If the centerline difference between the lower and upper jaw is more than a half of the width of the first incisor of the bottom jaw.
TABLE 1
PEER ASSESSMENT RATING INDEX COMPONENTS [2]
Number Name
1. Upper right segment
2. Upper anterior segment
3. Upper left segment
4. Lower right segment
5. Lower right segment
6. Lower left segment
7. Right buccal occlusion
8. Overjet
9. Overbite
10. Centerline
11. Left buccal occlusion
Figure 1. An example of an ellipse with its variables. tists are needed. The fact that we are short of
den-tists could hinder the people who really needs to get treatment for their malocclusion.
To solve that problem, in 2013, a research was proposed to create a telehealth monitoring system. This system will calculate the PAR Index remotely via the internet. To use the telehealth monitoring system, the dentist will need to create a model of the patient’s teeth and scan it. The den-tist will then send the scanned result to the web-site of the telehealth and the system will automa-tically calculate the result of the PAR Index using image processing techniques.
The introduction of the telehealth monitoring system is expected lower the case of malpractice in Indonesia. It is also expected that the system will help reduce the number of Indonesian citizens with malocclusion, so the nation could live health-ier.
This research will be focused on improving the segmentation results of the occlusal surface done by the M. Febrian Rachmadi. The research has successfully calculate the Openbite and Over-jet components bust lacking quality in the seg-mentation of the occlussal surface side of the teeth dental model image. This research will also cal-culate the Centerline component of the PAR in-dex.
The PAR (Peer Assessment Rating) Index
As stated before, the Peer Assessment Rating (PAR) Index is used to calculate the severeness of a malocclusion. The index consists of 11 compo-nents that will be totaled by the end. Table 1 con-tains the list of components of the PAR Index.
On this research, we will focus on calcula-ting the Centerline component. The Centerline co-mponent is calculated by measuring the differren-ce of the contact points of the first incisors for the upper and lower jaw. The difference will then be converted to the PAR Index score relative to the
lower jaw incisor’s width. If the difference is less than a quarter of the width then it is categorized as normal and given the score 0. If it is between a quarter and half of the width, then it is categorized as a malocclusion and will be given the score of 1. If the difference is larger than a half of the width, then it is severe and will be given the score 2.
Ellipse
The ellipse is a shape that is going to be used to eliminate some noise after the thresholding pro-cess. Equation (1) show the equation that is need-ed to draw the ellipse [7].
The variable x and y is a random variable on the edge of the ellipse a is the width of the ellipse and b is the height is the ellipse. The variable x0 and y0 is the center of the ellipse as shown in Fi-gure 1.
Confusion Matrix
TABLE 3
THE CONFUSION MATRIX CLASSIFICATION [2] Classifica
tion Description
TP (True Positive)
The result of the segmentation done by the system is classified as positive when the result of the segmentation done manually is positive.
FP (False Positive)
The result of the segmentation done by the system is classified as positive when the result of the segmentation done manually is negative.
TN (True Negative)
The result of the segmentation done by the system is classified as negative when the result of the segmentation done manually is negative.
FN (False Negative)
The result of the segmentation done by the system is classified as negative when the result of the segmentation done manually is positive.
TABLE 4
PEER ASSESSMENT RATING INDEX COMPONENTS [2]
Name Equation
PERCENTAGE OF TEETH IN AN IMAGE
Model Percentage
Figure 2. The process of cropping an image in pre-processing. This is done to create a more uniformed image
with another image.
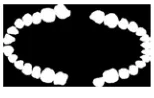
Figure 3. An example of a ground truth of an image.
automatically compared to the segmentation done manually [8]. The classification is divided into 4 classification.
The classification information could then be used to rate the accuracy from several parameters. The True Positive Rate (TPR) and True Negative Rate (TNR) calculates the rate that the program classify positives and negatives correctly. The Fal-se Positive Rate (FPR) and FalFal-se Negative Rate (FNR) calculates the rate that the program classify positives and negatives incorrectly. The Accuracy calculates the correctness of the program based on TP, TN, FP and FN. The Precision calculates the percentage of the true positives from all the posi-tives classified by the system. The Geometrical Mean (GM) calculates the accuracy when the po-sitive data is significantlly lower than the negative data. For example. when the positive data is only is only 1 pixel, and the negative are 100 pixels, if we classify the all the data into negative, it will have a 99% ACC. But, if we use GM, the accu-racy is 0%. In this research, the percentage of the teeth is smaller than the background, therefore to calculate the accuracy, it is more accurate to use
geometrical mean.
Pre-Processing
Every image that is processed goes through the pre-processing stage. According to the previous research done by Rachmadi, after an image is mi-nimized by 5 times, a milimeter is equal to 2 pi-xels in the image [6]. The pre-processing is done by cropping the image. This is done to reduce the area of the image which doesn’t contain any teeth. It will also make the image more uniformed so it is easier to segmentize the image later on. Figure 1 will show the result of the cropped image.
The next process is to calculate the amount of teeth relative to the image. This is done by cre-ating a ground truth of the image and calculcre-ating the percentage of the teeth in the image. After this process is done, the results averaged at 23.3587%.
2. Methods
Adaptive Multiple Thresholding
men-2, June 2014
Figure 4. An example of the result of SLIC Super Pixels used on the occlusal surface of the teeth model image. The
SLIC Super Pixels cannot segmentate the gum and the teeth.
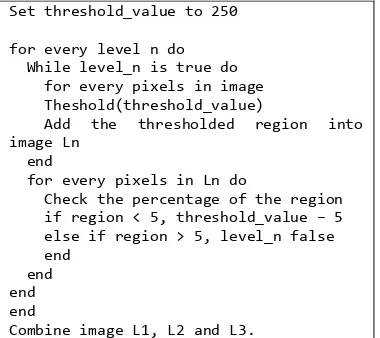
Set threshold_value to 250
for every level n do While level_n is true do for every pixels in image Theshold(threshold_value)
Add the thresholded region into image Ln
end
for every pixels in Ln do
Check the percentage of the region if region < 5, threshold_value – 5 else if region > 5, level_n false end
end end end
Combine image L1, L2 and L3.
Figure 5. Pseudo code of a general AMT.
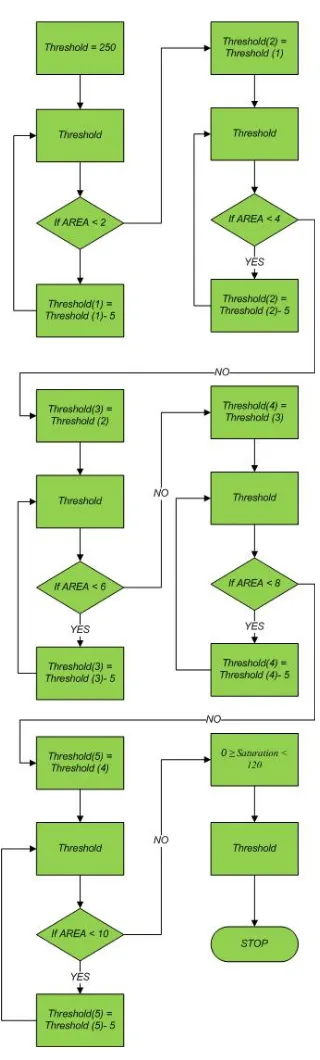
Figure 6. A flowchart of the AMT 15% with 4 levels process.
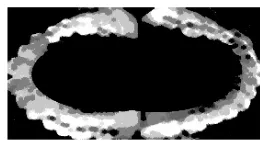
Figure 7. An example of the result of AMT 15% with 4 levels.
tioned previously, The AMT has already been us-ed by Febrian in the previous research. This re-search still uses the AMT because other segmen-tation techniques like SLIC Superpixels [9] or any edge-based segmentation could not segmentate the image well. This is due to the fact that the im-age of the teeth model does not have a well pro-nounced edges between the teeth and the gum.
The AMT uses the value of the saturation channel of the image as a threshold. To get the sa-turation value, the image is converted into HSV color model. The image is then segmented accor-ding to the the threshold for each levels and all of the levels are going to be combined.
The first type of AMT used is the 15% with 4 levels. This type of Adaptive Multiple Threshol-ding has 4 stages of process. Each stages creates a different image. The first stage will start with the threshold value of 250 and will take the 5% of the image with the highest saturation value. It will th-en threshold the image. If the thresholded image is less than 5% of the total image, it will reduce the threshold value by 5 and redo the thresholding pr-ocess until the thresholded image exceeded 5%. If it has exceeded 5%, then it will pass on the thre-shold value to the next stage and do the threthre-shold process until it exceeded 10%. If it has exceeded
10% then the threshold value is passed on to the next stage, where it also gets the 10% of the ima-ge.
The last stage will get the background of the image with the saturation value between 0 and 120. Finally, the image from the first, second and third level is combined into a single image.
Figure 8. A flowchart of the AMT 15% with 6 levels process.
Figure 9. An example of the result of AMT 15% with 6 levels.
Figure 11. An example of the result of AMT 20% with 5 levels.
Figure 10. A flowchart of the AMT 20% with 5 levels process.
segmentate 10% of the image. The last stage will also get the background of the image.
The last AMT method used in this program is AMT 20% with 5 levels. 20% is chosen beca-use as stated before, the average teeth to image ra-tio is around 23%. Therefore, it is expected to seg-mentate the image better than the previous AMTs. This AMT method have 5 stages, with the first stage segmenting 5% of the image. The next stage
segmentate 10% of the image. The third and fou-rth stage segmentates 15% and 20% of the image. Same as the previous AMTs, the last stage seg-mentates the background of the image.
2, June 2014
Figure 12. An example of the result of ellipse approximation.
Figure 13. An example of the laplacian filter applied on the image (left) and the result of thresholding (right)
Figure 14. The result of applying the hole filling algorithm.
Figure 13. An example of the laplacian filter applied on the image (left) and the result of thresholding (right)
Figure 15. The final result of the segmentation.
Figure 16. The result of the morphological dilation and erosion on the image..
has a different size of ellipse, so that it varies acc-ording to that jaw’s size.
To determine the width and height of each ellipse, the width and length of the jaw needs to be calculated. This is done by calculating the dis-tance of the top-most pixel and bottom most pixel in the jaw to calculate the height of the ellipse. To calculate the width, we calculate the distance of the left most pixel of the jaw and the right most pixel of the jaw. The ellipse is the drawn on to the image and used as a mask to eliminate the resi-dues.
To further eliminate the gum residue near the teeth, the next process will threshold the image with the help of laplacian filter. The laplacian fil-ter is used to define the edges of the image. This is useful in the thresholding, as we need to differ-rentiate the residue with the teeth. The teeth usu-ally has a brighter area, so the threshold value is slightly lower than the pixel value of the teeth. This varies in each side of the image (bottom, left, top, right) as each side has different intensity.
After the image has been thresholded, there will be some noise left by the laplacian filter. To eliminate this the next process is going to use the hole filling algorithm. The hole filling algorithm will eliminate small noises and it will also fill out small holes between the teeth.
The final process in segmenting the image will use floodfill to fill out large holes between the teeth. The four corners and the center of the
image will be the starting point of the floodfill. This is done to make sure that all the areas are fill-ed by the floodfill.
After the image has been floodfilled, the im-age is then copied, inverted and used as a mask for the original image. When the process is finish-ed, to eliminate gaps between the molars, the pro-cess will fill it with lines by using normal itera-tions.
Implementation of Centerline Component
The implementation of Centerline component tak-es the image rtak-esult of the segmentation after the ellipse approximation has been applied (Figure 9). The segmented image will be transformed using morphological dilation and erosion. This is done to smoothen edges of the images, so it will be easier to locate the contact point of the firs inci-sors.
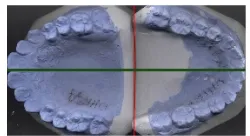
Figure 17. The final result of the Centerline calculation. The green line indicates where the Centerline of each jaw
is located.
TABLE 6
AMT 15% 4 LEVEL SEGMENTATION RESULT
Process Geometrical Mean
1 0,548
2 0,577
3 0,635
TABLE 7
AMT 15% 6 LEVEL SEGMENTATION RESULT
Process Geometrical Mean
1 0,568
2 0,645
3 0,684
TABLE 8
AMT 20% 5 LEVEL SEGMENTATION RESULT
Process Geometrical Mean
1 0,533
2 0,682
3 0,69
Figure 18. A sample of a dental model which has a degree of rotation
Figure 19. A sample of a dental model which has a misaligned base
Figure 20. A sample of a dental model which has two incisors stacked togeher
jaw to find the margin. If the margin of the meet-ing point of the first incisors is 2,5 millimeters more than the margin of the two center width, th-en the two cth-enter width margin will be used as the Centerline calculation. If it is less than 2,5 milli-meters, then the margin of the first incisors con-tact points will be used as the Centerline calcu-lations. This is done so that incase the program falsely pinpoint the contact point of the first in-cisor, it can still calculate more accurately.
3. Results and Analysis
As mentioned previously to analyze the result of the segmentation, Confusion Matrix is going to be used[8]. The accuracy of the segmentation will be indicated by the geometrical mean of the segment-ed image. The average result of the segmentation is divided by the three types of AMT used. The dataset of the segmentation consists of 30 occlusal view of the dental model images.
Table 4 shows the increasing geometrical mean as each process is done. Process number 1 represents the Adaptive Multiple Thresholding 15% using 4 Level. Process number 2 represents the ellipse approximation. Process number 3 rep-resents the thresholding with the help of laplacian filter. The increasing geometrical mean within ea-ch process show that eaea-ch method used in the seg-mentation process is effective.
The result of the segmentation using the AMT 15% with 6 levels produce better result than the previous method. This is due to the fact that the AMT 15% with 6 levels has more data than the previous method, thus, increasing the true po-sitive rate of the Confusion Matrix. The Precision also increases because the positive data increases.
The result of the segmentation using the AMT 20% with 5 levels produces the best segme-ntation overall. The AMT alone produce the worst result among the three due the fact that it also seg-mented many gum area, therefore decreasing the true positive rate. As the process goes on the geo-metrical mean increases. This shows that the ellip-se approximation and the thresholding is best uellip-sed with this AMT method.
seg-2, June 2014
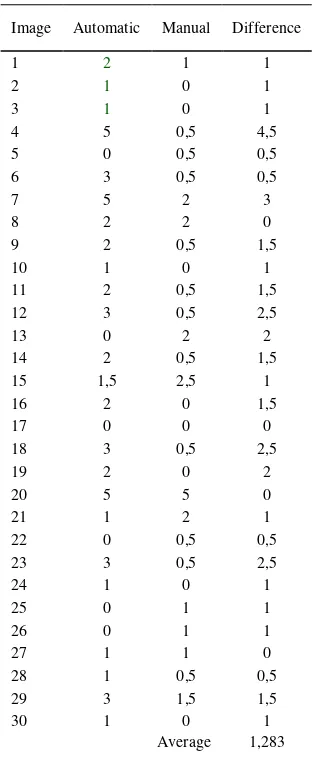
TABLE 9
CENTERLINE CALCULATION RESULT
Image Automatic Manual Difference
1 2 1 1
mentation. The white dental model manage to av-erage 0.69 in AMT 15% using 4 levels. 0.73 in AMT 15% using 6 levels and 0.73 in AMT 20% using 5 levels.
When tested with the same dataset, the Ada-ptive Multiple Thresholding 20% 5 levels with the ellipse approximation and thresholding with the help of laplacian filter, produces better results th-an the Adaptive Multiple Thresholding used by the previous research. The average Geometrical Mean of the image processed by the more recent method is 0.69.2 whereas the previous method only managed to average 0.62.
Table 7 shows the result of the Centerline calculation done by the system. It also shows the average difference between automatic calculations and manual calculations done by orthodontics. The average difference of calculation is 1.23 mil-limeters. With further analyzing the data, it is fou-nd that there are several factors that could make the calculations inaccurate. The first factor is if
the dental model has a degree of rotation when scanned. This could make the calculations inaccu-rate as the midpoints are not calculated on a stra-ight line.
The second factor that affects the calculation is the base of the dental model is not properly aligned. This causes the calculation to bias with the unleveled base. The misalignment is someti-mes cause by the scanner shaking when scanning the image. The last factor that affects the calcu-lation is the when the two first incisors are stacked together. This caused the system to miss-judge the point not as a contact point of the two incisors.
4. Conclusion
Of all the segmentation method used, the best seg-mentation method is the Adaptive Multiple Thres-holding 20% 5 levels with ellipse approximation and thresholding with the help of laplacian filter. The result of the segmented image using that me-thod has a Geometrical Mean average of 0.69. Al-so, the color white is the best dental model color for the segmentation.
The segmentation more recent method of segmentation is also better when compared with the previous method using the same dataset. It produces images with Geometrical Mean of 0.692 as supposed to 0.62 produced by the earlier me-thod.
The Centerline component of the PAR Index is also successfully implemented in this research. But, the techniques used in the process needs to be further improved so that the results are closer to the manual calculations done by orthodontists.
References
[1] P. Fortek, Malocclusion of teeth, http://www. nlm.nih.gov/medlineplus/ency/article/00105 8.htm, 2012, retrieved May 16, 2014. [2] S. Richmond, W. C. Shaw, K. D. O’Brien, I.
B. Buchanan, R. Jones, C. D. Stephens, C. T. Roberts, & M. Andrews. The Development of PAR Index (Peer Assessment Rating): reli-ability and validity. European Journal of Or-thodontic, pp.125-129, 1980.
[3] H. Dewanto. Keparahan Maloklusi Siswa Sekolah Dasar di Lombok, Jakarta, Indone-sia, pp. 136-144. 1986.
[4] Konsil Kedokteran Indonesia, Registrasi Ke-selurhan, http://kki.go.id, 2014, retrieved Ju-ne 29th, 2014.
[5] OECD, Dentists, Health at a Glance 2009: OECD Indicators, OECD Publishing, 2009.
[6] M. F. Rachmadi, “Perhitungan Indeks PAR (Peer Assessment Rating) Pada Citra Model Gigi 2D untuk Komponen Penilaian Jarak Gigit, Gigitan Terbuka, dan Segmentasi Gigi Pada Model Gigi Terbuka,” B.S Thesis, Fa-culty of Computer Science, Universitas In-donesia, InIn-donesia, 2014.
[7] E. W. Weisstein, Ellipse, http://mathworld. wolfram.com/Ellipse.html, 2014, retrieved June 29th, 2014.
[8] R. Kohavi & F. Provost, Glossary of Terms. Machine Learning 30(2-3), pp. 271-274, 1998.