EJTIR
ISSN: 1567-7141 tlo.tbm.tudelft.nl/ejtirHysteresis & Urban Rail
David Block-Schachter
1 Cambridge, MA, USA.Jinhua Zhao
2Massachusetts Institute of Technology, Cambridge, MA, USA.
C
ities are endowed with and accumulate natural and constructed assets based on their unique histories, which in turn define the choice set of the present. But, common practice is that current behaviour can be described without reference to past circumstances. This work departs from that practice by examining the effects of historical urban rail on current residential location and travel behaviour, from the era of horsecars (1865) and streetcars (1925) to the present in Boston. It uses tract level data to explore the hysteretical effects of past access to rail—the extent to which the urban system retains the impacts of rail even when it no longer exists.Current density and travel behaviour are measurably influenced by past access to rail. These findings are robust to a series of alternate causal, functional, and spatial specifications. The built environment and demographic patterns are found to be the strongest mechanisms for these persistent effects. Past access to rail has shaped the city, and that shape has, in turn, affected travel behaviour. For density and auto ownership there is also a residual measurable effect of past access unexplained by the built environment or demographic patterns.
This research shows that past rail access continues to reverberate in current residential location and travel behaviour. These findings of hysteresis add to an understanding of the long-term impacts of rail infrastructure, and suggest that if higher density and lower levels of auto ownership are desirable, policymakers should focus on reuse of areas that were built around rail.
Keywords: urban development, urban rail, streetcars, hysteresis, built environment.
1.
Introduction
When iron ore is brought into contact with a magnetic field it retains some of the magnetization after the magnetic field has been removed; hysteresis. This physical concept has been transferred to the social sciences, in particular in economics (e.g. Blanchard and Summers, 1986). We test the hypothesis that urban change is also hysteretic. The city—its density, its urban form, and way people move about it—retains the imprints of the historical processes that shaped it, even after the physical manifestations of those processes no longer exist. This is beyond time dependence; it is not possible to understand the direction of the present without knowing the history of the system.
One such historical process is the evolution of urban rail from single cars pulled by horses, to those powered by electricity, and eventually multi-car trains running on elevated, surface, and underground tracks. This work focuses on examining the extent to which proximity to these
1 A: 101 Main Streer Cambridge, MA 02142 USA. T +1 617 418 4918 E: [email protected]
networks influences the subsequent characteristics of the surrounding built environment (BE)— modelled as density—and the attendant travel behaviour—auto ownership and mode share. Rather than focusing on contemporaneous effects, it uses snapshots of network access for one city—Boston—over an extended time period—from 1865 to the present. In Boston, some routes have been in continuous operation from the time the cars were pulled by horses. Others have been replaced by subways, by elevated railways, or by buses. Still others have been abandoned altogether. This distinctive pattern creates fertile ground for disentangling the effects of this infrastructure on present day patterns. The overarching hypothesis is that there are measurable effects of past proximity to rail on density, auto ownership, and mode share, even after controlling for present proximity. That is, that the effects of rail on the built environment outlast the urban rail itself—they are hysteretic.
Transportation planning analysis falls mostly into two categories: (1) ahistorical quantitative work where the current (future) system state is determined by descriptors of the present (future), without knowledge of the past. (2) Historical qualitative inspiration and lessons extracted from the unique history of a place often used to motivate alternate visions of the future. This paper attempts to find a third way by demonstrating that responses to past urban rail are systematic— that there is a measurable effect of the history of urban rail on present circumstances.
Past work that has focused on relationship between transportation networks and density during the initial construction of the network (e.g. Xie and Levinson, 2010; Levinson, 2008a; King, 2011), and on the relationship between network proximity and concurrent travel behavior during network expansion (e.g. Baum-Snow and Kahn, 2000; Baum-Snow and Kahn, 2005; Glaeser et al., 2008). In contrast, this study includes both the accumulation and deterioration of the rail network, and focuses on the time lag between the existence/non-existence of that networks and nearby density and travel behavior.
The claim here is not that past rail is responsible for current behaviour via some ethereal process. Instead, past rail is an additional factor not included in the description of current conditions used to model the relationship between the built environment and travel behaviour. There are two alternative explanations for this residual effect (1) the condition of being near past rail may be a descriptor of the BE not captured elsewhere; (2) it may be indicative of a more speculative mechanism, such as a heuristic for a signal that recalls past preferences based on personal history.
After reviewing the literature in section 2, section 3 discusses the plausible mechanisms for past rail’s effect on current patterns. Section 4 describes the methods and data used to arrive at the findings in section 5. Section 6 concludes with a discussion, and extensions for future research.
2.
Literature
The contemporaneous effects of transportation on the built environment are, of course, best exemplified by the historical scholarship of Warner (1962) in Boston. This qualitative description of the development process, as well as documentation of the built environment still evident today, is the inspiration for the present work.
reinforcing outside the city centre, but that rail density preceded population density within the city centre. The mixed results above may be a result of the variety of differing measures between studies in addition to the historical uniqueness of development patterns and technology penetration. The road network literature is broadly similar. For example, Lichter and Fuguitt (1980) find evidence that US Interstate system influenced economic growth between 1950 and 1975, but Baum-Snow (2007) finds that this growth came in part from a reduction of population in the central cities as result of highway expansion. Much additional work uses either planned or realized historical networks as instruments for the current network (e.g. Duranton and Turner, 2012; Baum-Snow, 2007).
Baum-Snow and Kahn (2000, 2005) and Glaeser et al. (2008) examine the influence of transit system expansion on adjacent areas in the United States from 1970 to 2000 using a census tract based model with fixed tract effects and demographic controls. Notably, they find that (a) places that received transit between 1970 and 2000 are between the density of those that do not receive new transit, and those that already had it (Baum-Snow and Kahn, 2005). (b) Moving from 3km to 1km from transit increases transit usage by 1.42 percentage points (Baum-Snow and Kahn, 2005). (c) New transit lines reduced the decline in transit mode share near the central business district (CBD), and increased ridership versus a decline farther than 10km from the city (Baum-Snow and Kahn, 2005). Within Boston, Baum-Snow and Kahn find that new rail affects mode share outside 10km of the CBD in aggregate, but not within 10km. The explicit assumption in much of this work is that there is not a lag adjustment to rail. Baum-Snow and Kahn (2005) test and find no evidence of a temporal lag of more than a decade in adjustment of transit mode share to new rail construction in the US from 1970 to 2000, with a very few exceptions (including Boston).
In all of the cases studied, the focus has been on areas where rail did not exist previously, and now does. In this situation the treatment continues, and the control is all those places that neither formerly had rail, nor received new rail. This is only a subset of the places whose rail access has changed since the development of streetcars. The evolutionary economic geography (e.g. Boschma and Frenken, 2011) and path dependence (e.g. David, 2005) literatures hypothesize that the quasi-irreversibility of the BE strongly impacts future paths for neighbourhoods and cities (Martin and Sunley, 2006, Bertolini, 2007). Because of the probabilistic paths that it foments, deleterious policy cannot be erased instantaneously, if at all—its accumulated effects persist. “Once a city places a road or enacts a set of zoning rules that destroy a small neighbourhood retail base, tearing up the road or removing the zoning rules will not lure the business back." (Woodlief, 1998) Empirical evidence either for or against this notion is scant.
This paper does not assert that the relationship between past rail networks and current travel behavior is non-ergodic. Instead, it focuses on the empirical description of that relationship—the gap in the literature of the quantitative effects of past rail networks on population density and travel behaviour—using the insight that lags in adjustment, whether temporary or permanent, are likely to exist.
3.
Mechanisms
indirect cost savings, and inertial forces mean that it is easier to replicate network design as new transportation technologies emerge than it is to create networks anew (e.g. Axhausen et al., 2011). Structures are rebuilt (in theory, at least) when the increase in value for the developer exceeds the costs of new construction (Wheaton, 1982). As neighbourhoods age, buildings grow more diverse through infill, and there is systematic variation between and among land uses in capitalizing the value of access (Landis et al., 1995). The diversity of use, size, and design means that there are always some buildings whose use value precludes redevelopment. The coordination and compensation problem between landowners and government is similarly steep.
On (B and C), past rail plausibly influences current behaviour because it uniquely shapes the network and housing characteristics of the BE, or because it puts in place forces which determine those portions of the BE that persist into the present. Zoning and neighbourhood pressure mean that newly constructed elements of the BE more closely resemble the past BE. For example, a BE shaped during the streetcar era may have shorter blocks, less room for parking, narrower streets, more integrated storefronts, and so on associated with residential location and travel behaviour of the past.
On (E), this residual effect may exist because past rail acts as an omitted descriptor of the BE. It is also plausible that these residual effectives are due to a series of mechanisms more speculative in nature. The built environment acts as a mnemonic device that reminds people of their own, or their family’s past choices (Rapoport, 1982, 1994). The built environment unique to—or highly correlated with—past access to rail may be a signal that recalls preferences based on past experiences with the BE and travel, or observations of people who had similar roles and their behaviour. Alternatively, differential perceptions of behaviour control based on past proximity to rail could affect the weights of existing attributes of the travel behaviour choice (e.g. Karash et al., 2008,). If people are influenced in mode choice or auto ownership by their neighbours, because out-migration takes place gradually, places with higher transit usage in the past will continue to have higher transit usage long after the adjacent urban rail no longer exists, even after controlling for replacement transit service such as buses.
These mechanisms may be less than separable, and interact with self-selection. For example, the signals of the BE may both change current behaviour so that it more closely resembles the walking and transit city at initial construction, and attract people who have a preference for a lifestyle associated with that behaviour. A denser street grid might make walking more pleasurable or less costly because of more, and more direct, walking routes to a given point. Living near other people who walk might also change one’s attitudes toward walking. It is this reason that a series of controls are used in order to test for a range of effects, rather than attempting to assert that the subsequent BE, for example, is completely endogenous to the existence of past rail.
4.
Methods
This work presents results from cross-sectional (e.g. non-panel) spatial models at the census tract level that use current and historical data on density, auto ownership, and mode share. Block-Schachter and Zhao (2013a) focuses on density using multiple cross-sectional models, with a focus on the robustness of the results. Block-Schachter and Zhao (2013b) examines auto ownership using both a time series model of change and a household level model. The remainder of this section provides an overview of the data sources used and the structure of the model.
4.1 Data
Analysis of how past rail access affects current location and travel behaviour requires knitting together sparse historical sources on infrastructure location and relatively disaggregate population data with current socioeconomic data. Four periods of analysis have been selected, corresponding to landmarks in infrastructure development and data availability: 1865 and horsecars, 1925 and streetcars, 1960 and the modern rail system, and the most recent year for which detailed data at the tract level is available, 2000.
The vector files describing infrastructure location are drawn from the Chase Map of 1865 (Chase, 2006), and for the streetcar era from the Mather Boston Elevated Railway map of 1925 (Mather, 1925). These digital maps are georeferenced using ArcGIS 10 to provide a background on which to trace the rail vectors. Because these maps were often more figurative than literal, additional map and textual sources—in addition to common sense and the current rail alignment—are used to recreate the paths of past rail. Rail infrastructure for 2000 is reconstructed from year 2010 files provided by the Central Transportation Planning Staff (Massachusetts Office of Geographic Information and Central Transportation Planning Staff, 2007). Similarly, the rail system from 1960 is recreated by subtraction of routes that no longer run, and addition of past alignments by reference to past figurative system maps, and assorted textual records.3 US census data provides reliable population data from 1960 onwards at the tract level (GeoLytics, Inc., 2009, GeoLytics,
3
Inc. et al., 2003), with data on auto ownership restricted to 1980 and later. Information on historic places are geocoded from Massachusetts Cultural Resources Information System (Massachusetts Historical Commission, 2011) and on municipal location in 1860 traced from maps of the era.
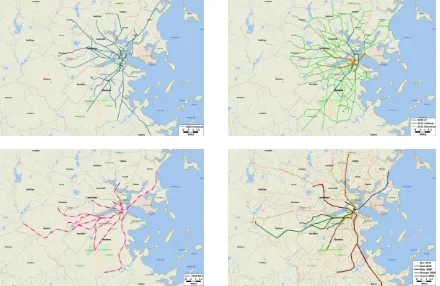
Clockwise from top left: 1865 horsecars; 1925 Streetcars, elevated railways, and subways; 1960 MTA urban rail; 2000 MBTA urban rail and bus
Figure 2. Boston rail network from 1865 to 2000
4.2 Model
In this work, each behaviour is modelled separately as in Equations 1, 2, and 3, with the variable
of interest the existence of past and present rail ( where
i is a consistently defined census tract from 2000. Endogeneity based on codetermination of travel behaviour and demographic or BE patterns is a concern, addressed by measuring built environment and demographic indicators with a one period lag where possible (similar to Brueckner and Rosenthal, 2009). Specifying a structural model is a possible solution, but is not pursued here due to the complexity of the covariance structure it implies versus the measurement error already inherent in work over such a long time period. A simple measure of urban rail access—a dummy indicating proximity within 1∕2 mile—eliminates possible problems with endogeneity of opportunities that more sophisticated measures use. This matches well with the specificity of tract level data. Findings are robust to the specification of threshold distance at 1∕4 and 1 mile. This measure is not a perfect proxy for the actual effect of streetcars, neglecting frequency of service, capacity, route access, and ease of transfers among other qualities. This uncaptured variation may be significant in explaining the observed effects if past network frequency or capacity are highly correlated with current provision of service in areas no longer served by rail.
( 1 )
( 2 )
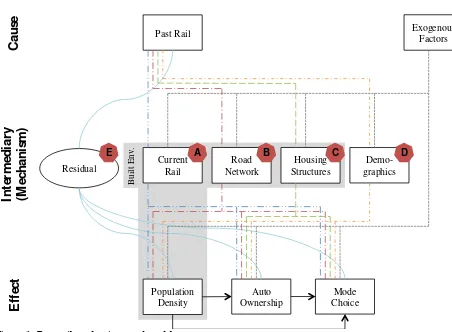
D: Density; A: Auto Ownership; M: Mode Choice; N: Network structure of BE; H: Housing characteristics of BE; R: Urban rail access; P: Demographic characteristics; E: Exogenous forces
Including indicators of network structure controls for the hypothesis that the effect of past access to urban rail on current density is due to the portion of the built environment that is independent from the housing built concurrent to that rail. The indicators used are connectivity (streets per intersection), and local and non-local street density (streets per square mile). The first two are associated with smaller blocks, while the latter is associated with increased regional accessibility, but also invasive road architecture, and disamenity from noise and pollution.
Housing characteristics control for the size and quality of housing component of the BE. More rooms per housing unit, all else equal, is expected to be higher quality housing. On the other hand, the proportion of rental units under $300 per month indicates lower quality. Finally, the proportion of 1-family and 2-family homes is a proxy for parking availability. The model of density (Equation 1) omits controls for demographics and structures. While this risks omitting relevant changes in these indicators over those two decades, findings are relatively robust to this specification. Additional robustness checks have been run throughout for alternate functional definitions. For example, density may be better proxied by the density of structures, rather than the density of people or households. Findings are robust to these definitions.
Indicators of lifecycle and socioeconomic status include both the average income in the tract, and the proportion of the population below the poverty line, which implies a kink in the effect of income. The proportion of the population that is white is used as an indicator of pre-existing preferences for automobility. The proportion of the population over the age of 65 is indicative of differential need for and use of the auto. Because individual residential choice is not modelled explicitly within the models of auto ownership and mode choice, the degree to which self-selection is the causal influence is unknown. The inclusion of demographic indicators helps reduce, but does not eliminate, the hypothetical impact of self-selection (Brownstone and Golob, 2009, Cao et al., 2006, Mokhtarian and Cao, 2008, Boarnet, 2011).
There are also concerns that omitted exogenous factors cause both the past rail and the subsequent behaviour. The primary alternate causal paths are that (a) rail connected primal places, and it is this primacy, not the rail that is the causal path and (b) places built at the turn of the 20th century, regardless of whether streetcars ran there, are denser and have different behavioural patterns. To address the former, this paper uses two indicators of primacy. The first is whether the area was part of a municipality in 1860, and thus presumably more important. The second is the number of historical places pre-1860 in the tract. The second measure may also indicate historic preservation, which would have confounding effects, but would still provide an appropriate control for differentiating the effects of primacy from that of subsequent rail. To address alternate path b, the proportion of housing that was built prior to 1940 is used, lagged to 1960 values to eliminate the confounding effect of urban renewal. In combination, these are the exogenous factors referenced in Figure 1 and in Equations 1, 2, and 3.
There are likely to be omitted variables over time that effect the density or travel behaviour of an area, but are not included with the controls above. Inasmuch as these are due to characteristics of the town, the use of municipal fixed effects (e.g. Sieg et al., 2002, Ihlanfeldt, 2007, Glaeser and Ward, 2009, Zabel and Dalton, 2011, for zoning and density) will reduce the impact of this omission. Municipal fixed effects can control for overall levels of permitted density due to zoning, natural resource desirability, and other relatively stable endowments, including the mix of city services, amenities and tax rates.
description of facets of the area. For example, the boundaries used are not good correlates for the homogeneity of the dependent variable. In keeping with the choice of spatial error and localized effects, an adjacency weight matrix is specified. Findings are robust to alternate spatial specifications not presented here.
5.
Findings
Given the building boom concurrent to the age of ubiquitous streetcars, the presentation of results in this section focuses on the effects of proximity to the urban rail network in 1925 on current density, auto ownership, and auto mode share. Findings are notably caveated by the nature of the data described above, which may induce measurement error.
5.1 Density
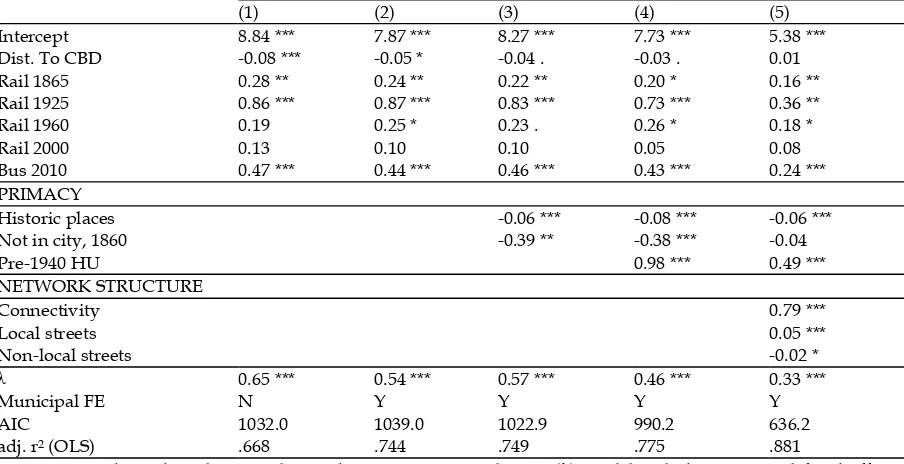
The series of models in Table 1 support the finding that past access to rail has a significant effect on subsequent density. They point to the built environment as the strongest mechanism, but find a legacy effect beyond the BE.
The monocentric model implies a specific functional form—negative exponential—that results from regressing the natural logarithm of density on distance from the CBD. Access to rail in each period is an additional binary regressor (distance to CBD in the monocentric model implies even transportation access). If the coefficient on rail proximity in past periods is significant and positive, the associated density gradient is taller.
Table 1. Comparison of density gradient model controls
(1) (2) (3) (4) (5)
Intercept 8.84 *** 7.87 *** 8.27 *** 7.73 *** 5.38 ***
Dist. To CBD -0.08 *** -0.05 * -0.04 . -0.03 . 0.01
Rail 1865 0.28 ** 0.24 ** 0.22 ** 0.20 * 0.16 **
Rail 1925 0.86 *** 0.87 *** 0.83 *** 0.73 *** 0.36 **
Rail 1960 0.19 0.25 * 0.23 . 0.26 * 0.18 *
Rail 2000 0.13 0.10 0.10 0.05 0.08
Bus 2010 0.47 *** 0.44 *** 0.46 *** 0.43 *** 0.24 ***
PRIMACY
Historic places -0.06 *** -0.08 *** -0.06 ***
Not in city, 1860 -0.39 ** -0.38 *** -0.04
Pre-1940 HU 0.98 *** 0.49 ***
NETWORK STRUCTURE
Connectivity 0.79 ***
Local streets 0.05 ***
Non-local streets -0.02 *
λ 0.65 *** 0.54 *** 0.57 *** 0.46 *** 0.33 ***
Municipal FE N Y Y Y Y
AIC 1032.0 1039.0 1022.9 990.2 636.2
adj. r2 (OLS) .668 .744 .749 .775 .881
n=590 tracts, dependent: log population density 2000. Spatial error (λ) model includes municipal fixed effects.
Pre-1940 housing units lagged to 1960. Rail access is based on a binary indicator of whether the tract centroid is within .5 miles of the network. Bus controls only for the current bus network, and is limited to areas where streetcars did not run. Local and non-local streets measured in road length miles per square mile. Historic places truncated at 4.
‘***’ 0.001 ‘**’ 0.01 ‘*’ 0.05 ‘.’ 0.1
for current rail. Municipal fixed effects imply that the amenities of an area strongly influence the residential location decision. In model 3, past urban rail’s effects on modern density are not significantly changed by the inclusion of indicators of primal, historic, preserved places—they are independent.
Model 4 adds a control for density following the age of the BE. This reduces the impact of past proximity to horsecars and streetcars. Model 5 adds network controls as well, which reduce the magnitude and strength of the parameter estimates on past access to rail significantly, but also reduce other parameter estimates as well. Notably, places farther from the CBD and/or outside city boundaries in 1860 are no longer significant. Because the parameter estimate on rail in 1925 is reduced in magnitude this model suggests that the street network is the main mechanism of past rail’s effect on subsequent density. The significance of λ in all of the models suggests that the spatial model is useful in reducing the impact of spatial autocorrelation, and the high r2 indicates
that omission is less likely to be problematic.
Multicollinearity is a concern, as some of the measures in Table 2 are highly correlated. However, the full set of controls has a variance inflation factor (VIF) below 4. Streetcar proximity has a VIF of 6.97, which is indicative of multicollinearity that is neither trivial nor severe. However, regression coefficients are stable excluding this indicator. Thus, the apparent degree of multicollinearity should not influence inference for Boston, but may do so for cities that do not share this same data pattern. centroid is within .5 miles of the network. Historic places limited to 4 maximum.
5.2 Auto ownership
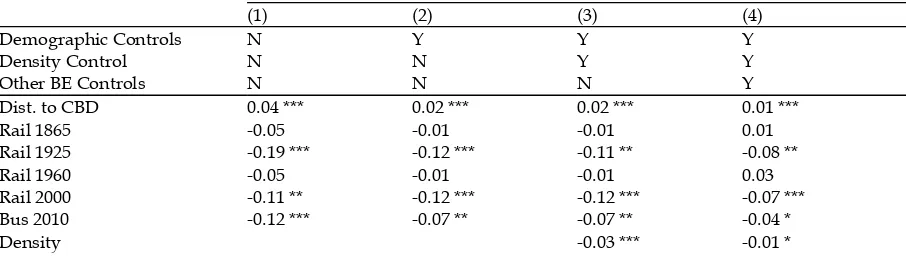
In the models in Table 3, past access to urban rail is associated with lower levels of auto ownership. The high r2 suggests that the models are relatively complete in explaining the
variability in current levels of auto ownership. Of the historical time periods tested, only access to 1925-era rail has a significant effect on auto ownership, with an effect size approximately equal to current rail. This effect persists after controlling for demographic variation, current access, and characteristics of the built environment. The inclusion of these additional indicators does not significantly reduce the measured effect of access to current rail on auto ownership.
(1) (2) (3) (4) network, and is limited to areas where streetcars did not run. Demographic controls are average income in the tract, the proportion of the population below the poverty line, the proportion of the population that is white, and the proportion of the population over the age of 65. Density is population in 10,000s per square mile, lagged to 1980 value. Other BE controls are connectivity (streets per intersection), local and non-local street density (streets per square mile), rooms per housing unit, the proportion of rental units under $300 per month, and the proportion of 1-family and 2-family homes.
‘***’ 0.001 ‘**’ 0.01 ‘*’ 0.05 ‘.’ 0.1
The addition of demographic controls in Model 2 in Table 3 reduces the strength of the influence of past access to streetcars, and improves overall model fit. Model 3 in Table 3 adds a single built environment indicator of BE—density. Adding density to the model reduces the effect of streetcar access by 10%, and has no effect on current rail access. Density is neither a substitute for the effect of current rail access on auto ownership, nor is it a strong mechanism for the effect of past access to streetcars on current auto ownership. The BE descriptors beyond density in Model 4 in Table 3 improve model specification, and reduce the impact of both rail access in 1925 and density. The attributes of the BE collectively used in Model 4 substitute for the direct effects of density on auto ownership.4 Density’s effect on auto ownership in these models are for the most part a function
of parking availability, street connectivity, regional accessibility, and housing quality.
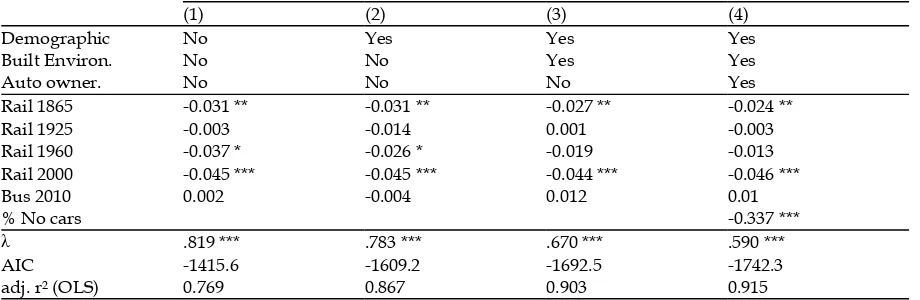
5.3 Auto mode share
With and without controls in Table 4—for the demographic makeup of the tract, the local built environment, and auto ownership levels—the finding remains the same: while current rail network access decreases auto mode share, current proximity to buses and past proximity to streetcars do not significantly affect journey-to-work mode choice in 2000. Rail 1865, while significant, is not robust to spatial specification, and thus we believe is not directly interpretable.
Table 4. Comparison of mode share model controls
based on a binary indicator of whether the tract centroid is within .5 miles of the network. Bus controls only for the current bus network, and is limited to areas where streetcars did not run. Demographic controls are average income in the tract, the proportion of the population below the poverty line, the proportion of the population that is white, and the proportion of the population over the age of 65. BE controls are density, connectivity (streets per
4
intersection), local and non-local street density (streets per square mile), rooms per housing unit, the proportion of rental units under $300 per month, and the proportion of 1-family and 2-family homes.
‘***’ 0.001 ‘**’ 0.01 ‘*’ 0.05 ‘.’ 0.1
Model 4 in Table 4 demonstrates that controlling for auto ownership has little impact on parameter estimates of transport’s effect on auto commute mode share. Auto ownership is proxied by the proportion of zero-vehicle households. In sum, there are no effects due to past proximity to rail after basic controls for subsequent rail access.
6.
Discussion
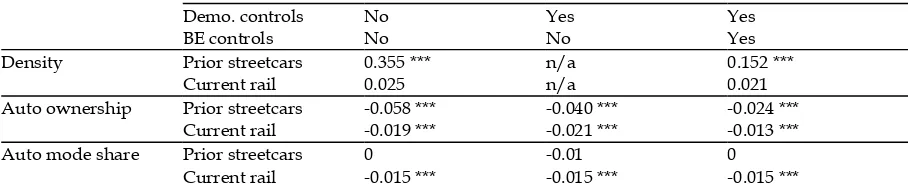
In contrast to past research which has focused on contemporaneous effects of past transportation infrastructure (Xie and Levinson, 2010; Levinson, 2008a; King, 2011, Baum-Snow and Kahn, 2000; Baum-Snow and Kahn, 2005; Glaeser et al., 2008), or on past infrastructure as an instrument for current infrastructure (Duranton and Turner, 2012; Baum-Snow, 2007), this work examines the impacts of proximity to past transportation infrastructure on the subsequent built environment and attendant travel behaviour. In order to argue that these effects are direct rather than instrumental via current rail we presented plausible mechanisms for this impact of past proximity to rail in section 3. The empirical findings from the models presented above point strongly to supporting the hysteresis hypothesis for density and auto ownership, but not for mode choice. Three main points from Table 5 support this conclusion:
1. The effect of past rail on density and auto ownership are larger than the commensurate effects of the current rail system. The daily choice of modes is not found to be significantly influenced by past access to rail after controlling for current access. Instead, the impact on mode choice is fully captured by the mechanisms explicitly modeled by current conditions. In other words,
2. Past access to rail has a stronger effect on current density than on auto ownership, but both are significant. The elasticity estimates in Table 5 control for the effect of proximity to the current rail and bus network, and thus can be interpreted as the effects of past rail on subsequent behavior independent of its effect on the shape of the current network. The extent to which the past rail network is a determining factor in the current measured effects is not captured.
3. Controls for the aspects of the built environment not captured by density and for additional causal mechanisms do not eliminate the observed reductions in density or travel demand for past proximity to streetcars in Table 5, and have only a small effect on current access to rail. While this is in no small part due to the observation that density persists where it exists, this effect continues to be strongly significant after plausible controls for the extent to which the structures themselves are persistent.
Table 5. Elasticity estimates
Demo. controls No Yes Yes
BE controls No No Yes
Density Prior streetcars 0.355 *** n/a 0.152 ***
Current rail 0.025 n/a 0.021
Auto ownership Prior streetcars -0.058 *** -0.040 *** -0.024 ***
Current rail -0.019 *** -0.021 *** -0.013 ***
Auto mode share Prior streetcars 0 -0.01 0
Current rail -0.015 *** -0.015 *** -0.015 ***
If these findings hold true outside of Boston, it suggests that if higher density and lower levels of auto ownership are desirable, then policymakers should have a bias toward reuse rather than wholesale redevelopment of areas that were built around rail. But there is a balance between capitalizing on new rail investment by increasing density and exploiting existing built environments that have the characteristics of places near past rail. Areas nearer central cities that were once, or are currently, industrial centres are one such example that are more likely to have lower costs of reuse. This is not a question of new transportation infrastructure, but of zoning that increases allowable density in these areas in order to allow market forces to decide when the timing for such changes is appropriate, rather than precluding such changes through regulation.
These findings do not suggest that new rail infrastructure would be more responsive in areas where rail was removed, but rather that those areas retain the differences they already have. Places that were oriented to transit when first developed maintain the signals associated with that orientation over time. In other words, opportunities to shape the future built environment through transportation infrastructure, whether streetcars, subways, or Bus Rapid Transit, lie in those areas that are not yet built in a relatively irreversible fashion. Whether this is replicable by rebuilding modern streetcars is questionable (e.g. Condon, 2010), given the general level of automobility that exists in the developed world.
While more and better data can always improve the uncertainty associated with transferability of conclusions to praxis, the most important area of emphasis for future work must be expanding this line of research to other cities. How large a role does growth play? What is the differential effect in timing of streetcars? To what extent do city size, employment centrality, and the accompanying road infrastructure interact with rail to produce persistent effects? While this paper only scratches the surface of work to be done in this research vein, it is our hope that it establishes the possibilities for demonstrating the urban hysteresis hypothesis; a systematic relationship between past rail infrastructure and present behaviour.
Acknowledgements
This work was partially supported by funding from the Massachusetts Department of Transportation, in support of dissertation research (Block-Schachter, 2012). The authors wish to thank Nigel Wilson, Fred Salvucci, William Anderson, and Chris Zegras, and a series of anonymous reviewers for their comments, criticism, and assistance with earlier versions of this work. All errors remain our own.
References
Anselin, L. and Bera, A. (1998). Spatial dependence in linear regression models with an introduction to spatial econometrics. Handbook of applied economic statistics. Marcell Dekker, Inc.
Axhausen, K., Froelich, P., and Tschopp, M. (2011). Changes in Swiss accessibility since 1850. Research in Transportation Economics, 31(1):72–80.
Bass Warner, S. (1962). Streetcar suburbs: the process of growth in Boston, 1870-1900. Harvard University Press, Cambridge.
Baum-Snow, N. and Kahn, M. (2000). The effects of new public projects to expand urban rail transit.
Journal of Public Economics, 77(2), 241—263.
Baum-Snow, N. and Kahn, M. (2005). Effects of urban rail transit expansions: Evidence from sixteen cities, 1970 to 2000. Brookings-Wharton Papers on Urban Affairs, 2005(1), 147—206.
Bertolini, L. (2007) Evolutionary urban transportation planning: an exploration. Environment and Planning A, 39, 1998—2019.
Bhat, C. and Guo, J. (2007) A comprehensive analysis of built environment characteristics on household residential choice and auto ownership levels. Transportation Research Part B: Methodological, 41(5): 506—526.
Blanchard, O. J., & Summers, L. H. (1986). Hysteresis and the European unemployment problem.
NBER Macroeconomics Annual, 1986, 1; 15-90).
Block-Schachter, D. (2012) Hysteresis and urban rail: The effects of past urban rail on current residential and travel choices. PhD thesis, Massachusetts Institute of Technology.
Block-Schachter, D. and Zhao, J. (2013a) Unimaginable communities: The legacy effects of streetcars on residential density in Boston. Working Paper.
Block-Schachter, D. and Zhao, J. (2013b) Ghosts in the machine: The influence of proximity to past rail on current auto ownership. Working Paper.
Boarnet, M. (2011) A broader context for land use and travel behavior, and a research agenda. Journal of the American Planning Association, 77(3): 197—213.
Boschma, R. and Frenken, K. (2011). The emerging empirics of evolutionary economic geography.
Journal of Economic Geography, 11(2):295—307.
Brownstone, D. and Golob, T. (2009) The impact of residential density on vehicle usage and energy consumption. Journal of Urban Economics, 65 (1):91—98.
Brueckner,J. and Rosenthal, S. (2009) Gentrification and neighborhood housing cycles: Will America’s future downtowns be rich? Review of Economics and Statistics, 91(4):725—743.
Cao, X., Handy, S., and Mokhtarian, P. (2006) The influences of the built environment and residential self-selection on pedestrian behavior: Evidence from Austin, TX. Transportation, 33(1):1—20.
Chapin, F. (1974) Human activity patterns in the city; things people do in time and in space. Wiley, New York.
Chase, J. (2006) Boston and vicinity, Massachusetts, railroads, 1865 (raster image). J.H. Bufford.
Condon, P. (2010) Seven Rules for Sustainable Communities: Design Strategies for the Post-Carbon World. Island Press.
David, P. (2005) Path dependence, its critics, and the quest for ’historical economics’. Stanford University, Department of Economics.
Duranton, G., and Turner, M. A. (2012). Urban growth and transportation. The Review of Economic Studies, 79(4), 1407-1440.
GeoLytics, Inc. Census CD 1960, 2009.
GeoLytics, Inc., Urban Institute, and United States Census Bureau. (2003) Census CD neighborhood change database (NCDB) 1970-2000 tract data: selected variables for US Census tracts for 1970, 1980, 1990, 2000 and mapping tool.
Glaeser, E. and Ward, B. (2009) The causes and consequences of land use regulation: Evidence from greater Boston. Journal of Urban Economics, 65(3):265—278.
Glaeser, E., Kahn, M., and Rappaport, J. (2008) Why do the poor live in cities? the role of public transportation. Journal of Urban Economics, 63(1):1—24.
Goetzke, F. and Weinberger, R. (2012) Separating contextual from endogenous effects in automobile ownership models. Environment and Planning A, 44:1032—1046.
Heckman, J. (2008) Econometric causality. International Statistical Review, 76:1—27.
Karash, K., National Research Council (U.S.). Transportation Research Board, Transit Cooperative Research Program, United States Federal Transit Administration, and Transit Development Corporation. (2008) Understanding how individuals make travel and location decisions: implications for public transportation.
King, D. (2011) Developing densely: Estimating the effect of subway growth on New York City land uses. Journal of Transport and Land Use, 4(2).
Landis, J., Guhathakurta, S., Huang, W., Zhang, M., Fukuji, B., and Sen, S. (1995) Rail transit investments, real estate values, and land use change: a comparative analysis of five California rail transit systems (Monograph 48). University of California at Berkeley, Institute of Urban and Regional Development.
Levinson, D. (2008a) The orderliness hypothesis: The correlation of rail and housing development in London. The Journal of Transport History, 29(1):98—114.
Levinson, D. (2008b) Density and dispersion: the co-development of land use and rail in London.
Journal of Economic Geography, 8(1):55—77.
Lichter, D. and Fuguitt, G. (1980) Demographic response to transportation innovation: The case of the interstate highway. Social Forces, 59(2):492—512.
Martin, R. and Sunley, P. (2006) Path dependence and regional economic evolution. Journal of Economic Geography, 6(4):395—437.
Massachusetts Historical Commission. (2011) Massachusetts cultural resource information system.
Massachusetts Office of Geographic Information and Central Transportation Planning Staff. (2007)
Data layers: MBTA rapid transit and MBTA bus routes and stops.
Mather, W. (1925) Boston elevated railway lines operated 1925.
Mokhtarian, P. and Cao, X. (2008) Examining the impacts of residential self-selection on travel behavior: A focus on methodologies. Transportation Research Part B: Methodological, 42(3):204—228. Rapoport, A. (1982) The meaning of the built environment: a nonverbal communication approach. Sage Publications, Beverly Hills.
Rapoport, A. (1994) Spatial organization and the built environment. Companion encyclopedia of anthropology. Taylor and Francis, London, pages 460—502.
Sieg, H., Smith, V., Banzhaf, H. and Walsh, R. (2002) Interjurisdictional housing prices in locational equilibrium. Journal of Urban Economics, 52(1):131—153.
Wheaton, W. (1982) Urban spatial development with durable but replaceable capital. Journal of Urban Economics, 12(1):53—67.
Woodlief, A. (1998) The path-dependent city. Urban Affairs Review, 33(3): 405—437.
Xie, F. and Levinson, D. (2010) How streetcars shaped suburbanization: a Granger causality analysis of land use and transit in the Twin Cities. Journal of Economic Geography, 10(3):453—470.