www.elsevier.com / locate / econbase
Exchange rate overshooting in Turkey
*
Mohsen Bahmani-Oskooee , Orhan Kara
Department of Economics, The University of Wisconsin-Milwaukee, Milwaukee, WI 53201, USA
Received 12 July 1999; accepted 18 January 2000
Abstract
Exchange rate overshooting is said to be a short-run phenomenon. However, when a currency like Turkish lira depreciates from 13 to almost 400 000 lira per dollar over three decades, one wonders whether it has overshot its long-run value as well. In this paper we employ a relatively new method of error-correction modeling to show how one could test for overshooting in the short-run as well as in the long-run. 2000 Elsevier Science S.A. All rights reserved.
Keywords: Exchange-Rate; Overshooting; Error-correction; Turkey
JEL classification: F31
In an effort to explain the abnormal fluctuation in an exchange rate, Dornbusch (1976) introduced his Sticky-Price monetary model which contained an ‘overshooting’ hypothesis. The main feature of his model is that since prices are sticky in the short-run, an increase in money supply which results in lower interest rates and thus capital outflow, will cause currency depreciation. The currency will actually depreciate over and beyond its long-run value, i.e., in the short-run it will overshoot itself. However, over time, commodity prices will rise and result in a decrease in real money supply and thus, in a higher interest rate. This, in turn, will cause the currency to appreciate. What happens to the long-run value of a currency is an empirical question. The empirical research is mixed at best. While Frankel (1979), Driskill (1981), Papel (1988), and Park (1997) do provide supportive results, Hacche and Townend (1981), Backus (1984), and Flood and Taylor (1996) do not.
In this paper we try to test the overshooting hypothesis by employing Turkish data and most recent advances in applied research. In 1973 when the international monetary system changed from fixed to relatively flexible exchange rate system, thirteen Turkish lira was buying one U.S. dollar. Today, that rate stands at more than 400 000.00 lira per dollar. We would like not only to test the monetary approach but also to determine whether Turkish lira has overshot its short-run as well as its long-run
*Corresponding author. Tel.: 11-414-229-4334; fax:11-414-229-3860. E-mail address: [email protected] (M. Bahmani-Oskooee)
value. To this end, we introduce the model in Section 1. Section 2 introduces the methodology and reports the empirical results supporting the overshooting hypothesis. Section 3 concludes. Data definition and sources are cited in Appendix A.
1. The model
The central theme of the monetary approach is that it combines the Purchasing Power Parity (PPP)
theory with the Quantity Theory of Money. Let S denote the number of lira per U.S. dollar; P theT
Turkish price level and PUS, the U.S. price level. The PPP theory then is outlined as:
S5(P /PT US) (1)
The theory then proceeds by identifying the determinants of price levels in two countries through
the quantity theory of money where M .VT T5P .Y in Turkey and MT T US.VUS5PUS.YUS in the U.S.
Solving these two equations for P and PT US and substituting into (1) we arrive at:
MT VT YUS
(2) ( 2 ) (2)
E5 (2)
MUS VUS YT
Eq. (2) indicates that the relative money supply, relative velocity, and relative income are the determinants of the exchange rate. Taking log from both sides of (2) yields:
Log S5(Log MT2Log MUS)2(Log YT2Log YUS)1(Log VT2Log V )US (3)
The last step in arriving at the monetary model is to identify the determinants of velocity in two countries. We shall assume that interest rate and inflation rate in two countries are the main
determinant of velocities. Thus, denoting the interest rates by i and iT U.S. and inflation rates bypT and
pUS, the monetary model that we plan to estimate takes the following form:
st5a1bmt1cyt1dit1ept1et (4)
where s5Log S; m5Log MT2Log MUS; y5Log YT2Log Y ; iUS 5iT2iUS;p5p 2pT US; ande is
1
an error term. It is expected that estimate of b.0 indicating that a faster growth of money supply in
Turkey over that of the U.S. will depreciate the lira. Indeed, monetarists would predict estimate of
b51. Following the monetarist prediction, estimate of c is expected to be negative indicating an appreciation of the lira due to an increase in Turkish income relative to that of the U.S. Estimates of d and e are expected to be positive indicating a depreciation of the lira due to an increase in Turkish interest rate and inflation rate respectively. Note that in Dornbusch (1976) sticky price model estimate
of d50.
1
2. The method and the results
Since the overshooting hypothesis is a short-run phenomenon, an appropriate method to test it would be to employ error-correction modeling and cointegration techniques. The first step in applying such techniques is to determine the order of integration of each variable. However, depending on the power of unit root tests, different tests yield different results (Bahmani-Oskooee, 1998). Due to this
uncertainty, specially when some variables in the model are at their level (e.g., s,m, y) and some are
at the rate of change (e.g.,p), Pesaran and Shin (1995) and Pesaran et al. (1996) introduce yet another
method of testing for cointegration. The approach known as the Autoregressive Distributed Lag (ARDL) approach has the advantage of avoiding the classification of variables into I(1) or I(0) and unlike standard cointegration tests, there is no need for unit root pre-testing. The error correction version of the ARDL model pertaining to the variables in Eq. (4) is as follows:
n n n n n
Dst5a01Sj51bjDst2j1Sj51 jc Dmt2j1Sj51djDyt2j1Sj51 jf Dit2j1Sj51gjDpt2j
1d1st211d2mt211d3 yt211d4it211d p5 t211et (5)
Two steps are involved in the ARDL procedure. First, the null of no cointegration defined by H :0
d 5d 5d 5d 5d 50 is tested against the alternative of H :d ±0,d ±0,d ±0,d ±0 by the
1 2 3 4 5 1 1 2 3 4
means of familiar F-test. However, the asymptotic distribution of this F-statistic is non-standard irrespective of whether the variables are I(0) or I(1). Pesaran et al. (1996) have tabulated two sets of appropriate critical values. One set assumes all variables are I(1) and another assumes that they are all
I(0). This provides a band covering all possible classifications of the variables into I(1) and I(0) or
even fractionally integrated. If the calculated F-statistic lies above the upper level of the band, the null is rejected, indicating cointegration. If the calculated F statistic falls below the lower level of the band, the null cannot be rejected, supporting lack of cointegration. If, however, it falls within the band, the result is inconclusive. Using monthly data over January 1987–December 1998 period we carried out the first step by imposing eight lags on each first difference term in the ARDL model. An F-statistic of 5.05 was obtained when a trend term was included in the model. This is greater than the upper level of the critical band (i.e., 3.827) supporting cointegration. Now that it is justified to retain the lagged
value of all five variables (a linear combination of which is denoted by error-correction term, ECt21)
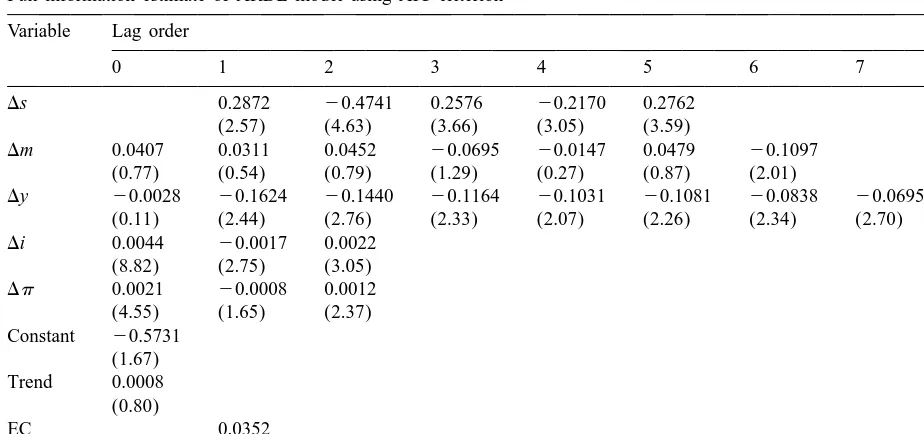
in the ARDL model, we reestimate the model using an appropriate lag selection criterion such as AIC. Only an appropriate lag selection criterion will be able to identify the true dynamics of the model. The full information estimate of this step is reported in Table 1.
Concentrating on the sign of lagged coefficient estimates ofDm variable, it appears that the Lira
depreciates first (indicated by the first three positive coefficients) and then it appreciates (indicated by negative coefficients) supporting the overshooting hypothesis in the short-run, though many of these coefficients are insignificant. The other variables all carry significant coefficient estimates that are in
line with monetarist prediction. The negative coefficient estimates ofDy variable indicates that a high
economic growth in Turkey relative to the U.S. appreciates the Lira. The interest rate and inflation differentials also carry significant coefficient estimates that are mostly in line with monetarist
prediction. Finally, the lagged error-correction term (ECt21) that was supposed to carry a negative
coefficient, carries a positive one. We interpret this as exchange rate staying above its long-run value
Table 1
a
Full information estimate of ARDL model using AIC criterion Variable Lag order
0 1 2 3 4 5 6 7 8
Ds 0.2872 20.4741 0.2576 20.2170 0.2762
(2.57) (4.63) (3.66) (3.05) (3.59)
Dm 0.0407 0.0311 0.0452 20.0695 20.0147 0.0479 20.1097 (0.77) (0.54) (0.79) (1.29) (0.27) (0.87) (2.01)
Dy 20.0028 20.1624 20.1440 20.1164 20.1031 20.1081 20.0838 20.0695 (0.11) (2.44) (2.76) (2.33) (2.07) (2.26) (2.34) (2.70)
Di 0.0044 20.0017 0.0022 (8.82) (2.75) (3.05)
Dp 0.0021 20.0008 0.0012 (4.55) (1.65) (2.37) Constant 20.5731
(1.67) Trend 0.0008
(0.80)
EC 0.0352
(1.76)
a 2
Note: Number inside the parentheses beneath each coefficient is the absolute value of t-ratio. The adjusted R 50.7723 and DW51.9539.
that were used to form the error-correction term in Table 1. Normalizing on s, the following estimates were used to form the error-correction term:
s516.320.02*Trend11.56m25.00y10.001i10.008p (6)
As can be seen, the elasticity obtained for relative money supply m is greater than unity (1.56) indicating that one percent increase in Turkish relative money supply will cause a long-run depreciation of the lira by 1.56%, a result consistent with overshooting hypothesis. Note also that the relative income, interest and inflation rate elasticities are all in line with the monetarists prediction.
3. Summary and conclusion
Appendix A. Data definition and sources
All data are monthly covering January 1987–December 1998 and are collected from the following sources: (a) International Financial Statistics of IMF; (b) Federal Reserve Bank of St. Louis; (c) The Central Bank of Turkey.
Variables
s 5spot exchange rate defined as number of Turkish lira per U.S. dollar, source c.
M 5M1 monetary aggregate for the U.S. comes from source b and for Turkey from source c.
Y 5index of industrial production for the U.S. comes from source a and for Turkey from source c.
i 5three month T-Bill rate for the U.S. is collected from source b and for Turkey from source c. p 5CPI based rate of inflation. The CPI data for the U.S. and Turkey come from source a.
References
Backus, D., 1984. Empirical models of the exchange rate: separating the wheat from the chaff. Canadian Journal of Economics 17, 824–846.
Bahmani-Oskooee, M., 1998. Do exchange rates follow a random walk process in middle eastern countries? Economics Letters 58, 339–344.
Baillie, R.T., Selover, D.D., 1987. Cointegration and models of exchange rate determination. International Journal of Forecasting 3, 43–50.
Dornbusch, R., 1976. Expectations and exchange rate dynamics. Journal of Political Economy 84, 1161–1176. Driskill, R.A., 1981. Exchange rate dynamics: an empirical investigation. Journal of Political Economy 89, 357–371. Flood, R.P., Taylor, M.P., 1996. Exchange rate economics: what is wrong with the conventional macro approach. In: Frankel,
J.A., Galli, G., Giovannini, A. (Eds.), Micro Structure of Foreign Exchange Markets, The University of Chicago Press. Frankel, J.A., 1979. On the mark: a theory of floating exchange rate based on real interest differentials. American Economic
Review 69, 610–627.
Hacche, G., Townend, J., 1981. Exchange rates and monetary policy: modeling Sterling’s effective exchange rate, 1972–1980. In: Ellis, W.A., Sinclair, D.J.N. (Eds.), The Money Supply and Exchange Rate, Oxford University Press, Oxford.
Macdonald, R., Taylor, M.P., 1993. The monetary approach to the exchange rate. IMF Stafff Papers 40, 89–107. Papel, D.H., 1988. Expectations and exchange rate dynamics after a decade of floating. Journal of International Economics
25, 303–317.
Park, G., 1997. Short run and long run dynamics of exchange rates with sticky prices. Review of International Economics 5, 478–481.
Pesaran, M.H., Shin, Y. An autoregressive distributed lag modelling approach to cointegration analysis. In: Strom, S., Holly, A., Diamond, P., editors,Centennial Volume of Rangar Frisch, Cambridge University Press, Cambridge, forthcoming. Pesaran, M.H., Shin, Y., Smith, R.J., 1996. Testing for the existence of a long-run relationship. In: DAE Working Paper, Vol.