An international comparison of the e
!
ect of manufacturing
strategy-implementation gap on business performance
qBoo-Ho Rho
!
, Kwangtae Park
"
,
*, Yung-Mok Yu
#
!Sogang University, Seoul, South Korea
"Department of Management, Korea University, 1, 5Ka, Anam-dong, Sungbuk-ku, Seoul, South Korea
#Dankook University, Seoul, South Korea
Received 28 January 1999; accepted 12 April 2000
Abstract
This study has the purpose of empirically testing the importance of consistency between manufacturing strategies and practices in achieving better business performances. An empirical test has been conducted and compared on the data sets from three di!erent nations, each of which seems to have quite di!erent manufacturing capabilities and competitive environments. The empirical test result implies that the gap variable indicating inconsistency between manufacturing strategy and implementation practices plays a more important role than the strategy or implementation variable in discriminating the superior from the inferior performance groups. For those data sets from the US and Korea, the gap variables of#exibility, quality and/or cost show more signi"cant contribution in discriminating business performance groups. But none of the gap variables outperform other strategy or implementation variables in discriminating performance groups in Japan. ( 2001 Published by Elsevier Science B.V. All rights reserved.
Keywords: Manufacturing strategy; Empirical study; Comparative study; Manufacturing practices; Business performance; Gap analysis; Discriminant analysis
1. Introduction
What will be the ultimate goal of manufacturing strategies or practices? Why are we compelled to adopt so many up-to-date three-letter manufactur-ing innovation approaches such as BPR (Business Process Reengineering), ERP (Enterprise Resource Planning), TQM (Total Quality Management), JIT
q
This paper was supported by NONDIRECTED RE-SEARCH FUND, Korea Research Foundation, 1996.
*Corresponding author. Tel.:#82-2-3290-1944; fax:# 82-2-922-7220.
E-mail address:[email protected] (K. Park).
(Just-In-Time), TPM (Total Productive Mainten-ance), CIM (Computer Integrated Manufacturing), QFD (Quality Function Deployment), DFM (Design For Manufacturer), FMS (Flexible facturing System), CAD (Computer-Aided Manu-facturing) and CAE (Computer-Aided Engineering)? The answer is simply: in order to be more competi-tive and pro"table. But how we can be so is not that simply answered. A"rm usually can use only lim-ited resources for implementing its strategies and/or practices. Because of this limitation, it has to seek more cost-e!ective as well as goal-achiev-able ways of allocating its resources. A commonly suggested approach to prioritize resource alloca-tions among manufacturing activities is to take into
account their relative contributions toward achiev-ing the"rm's strategic goals pursued in its manu-facturing strategy. In this context, manumanu-facturing strategy consists of two core elements, as Miller and Roth [1] pointed out: the manufacturing task and the pattern of manufacturing choices. The"rst states what the manufacturing function must ac-complish [2], the so-called competitive priorities such as quality, cost, delivery or #exibility, while the second is concerned with the major decisions on manufacturing structure and infrastructure that a company makes to achieve its addressed manu-facturing tasks [3].
There have been a large number of theoretical and empirical research studies designed to investi-gate the relationship between manufacturing strat-egies, practices and performances. Even though some of the most recent will be brie#y discussed later, most of these research studies are focused on a one-to-one relationship between strategic ori-entation and performance or between manufactur-ing practices and performances. Very few empirical studies directly address the appropriateness of manufacturing practices for a certain strategic ori-entation. And most of them also fail to extend their
"ndings to show how this appropriateness can af-fect business performance. As Dixon et al. [4] point out, however, strategically important manufactur-ing activities should be given more attention and resources than those that are not important. Over-or under-allocation of manufacturing resources should be avoided to achieve a more balanced and cost-e!ective use of them.
This study aims to empirically test the import-ance of consistency between manufacturing strat-egies and practices in achieving better business performances. An empirical test has been conduc-ted on the data sets from three di!erent nations, each of which seems to have quite di!erent manu-facturing capabilities and competitive environ-ments. This international comparison is to see whether a consistency}performance relationship can be generalized regardless of the nation's speci"c characteristics of manufacturing systems. A consist-ency measure is de"ned in terms of the gap between the perceived importance of a competitive priority and thought-to-be-important manufacturing prac-tices to achieve this priority. Consistency measures
along with other strategy and implementation measures are then compared to investigate which measures are more e!ective to di!erentiate high performance business units from low performance ones.
2. Literature review
2.1. Manufacturing strategies and performances
The notion of manufacturing strategy as an important functional component of business strat-egy was initiated by Skinner [5,6] Skinner empha-sized that manufacturing has the potential to strengthen or weaken a company's competitive ability. Wheelwright [7] articulated how manufac-turing can support a"rm's competitiveness by
de-"ning four basic competitive priorities of manu-facturing: cost e$ciency, quality,#exibility and de-pendability. This framework has greatly in#uenced the terminology and direction of manufacturing strategy research. Hayes and Wheelwright [3] pro-vided more speci"c descriptions about how manu-facturing capabilities can help a business attain a desired competitive advantage. Since then many researchers, for example Swamidass and Newell [8], Hill [9], McDougall et al. [10] and Kim and Lee [11], have explored the role of manufacturing strategy in the strategy formulation and the strat-egy implementation process of a business unit.
Many empirical studies have also reported that well-formulated and e!ective manufacturing strat-egies, aligned with business strategies and goals, can produce better performances. For example, there is a study that the business units with a for-mulated manufacturing strategy outperformed the business units without one in terms of business performance such as return on sales [12]. Another study states that high-productive "rms are more likely to have more clearly de"ned competitive strategies [13]. This study helps to highlight the importance of manufacturing strategy to produc-tivity and other measures of performance.
and manufacturing strategic orientation as well as the relationship between manufacturing strategic orientation and business performance has been analyzed [14]. The manufacturing practices and performances of the "rms in the four strategic groups that were formed based on manufacturing scope and production engineering resource com-mitment have also been discussed and showed stat-istically signi"cant di!erences in the performance of each of the strategic groups formed [15]. From the results of the empirical investigation, one study reports that internally as well as externally oriented businesses have achieved the competitive advant-age with higher returns on investment and lower business risk components [16]. Based on eleven competitive priorities, three distinct clusters of manufacturing strategy groups have also been for-med and compared in terms of the business context, manufacturing activities, and manufacturing performance measures [1].
2.2. Manufacturing practices and performances
Recently, the Industry Week Census of Manufac-turers has reported the practices currently most in favor among US manufacturers, and the practices most likely to produce the best performances [17]. This Census also shows that facilities deemed at or nearest to world-class level typically do attain the best manufacturing metrics, and they are doing it by voraciously pursuing the best practices [18].
More empirical studies on the relationship be-tween manufacturing practices and performances have been reported that restrict their focuses to more speci"c operational areas such as AMT (Advanced Manufacturing Technology), quality improvement, production planning and control, JIT/lean production, and so on. From the 1994 survey of Australian manufacturers, a statistical link between the use of AMT, manufacturing performance and business performance has been reported [19]. One paper examines the manufac-turing performance and management practices of 71 automotive components suppliers located in Europe, Japan, and North America. This paper reports on the extent to which these plants have adopted &lean production' practices and tests the proposition that such techniques are linked with
high manufacturing performance [20]. Using the Global Manufacturing Research Group survey data, the e!ects that manufacturing planning and control practices have on manufacturing com-petitiveness de"ned in terms of manufacturing goals have been statistically estimated [21]. Also, a survey result of US "rms examining the e!ect of commonly adopted new manufacturing prac-tices such as TQM, JIT, FMS, and CE on various organizational performance measures has been reported. This result suggests that companies, which are using a few appropriate and e!ective manufacturing approaches, have a higher perfor-mance [22].
2.3. Manufacturing strategies,practices and performances
There have been some e!orts to"gure out how manufacturing strategies, practices and perfor-mances can be related to each other. These e!orts may be categorized into two directions: analytical and predictive. The"rst one is interested in inves-tigating under what conditions manufacturing strategy or practices can be more e!ective in attain-ing higher performance. A study examines how combinations of management techniques and management accounting practices enhance the performance of organizations, under particular strategic orientations such as emphasizing product di!erentiation, low price strategies or a combination of both [23]. Another empirical study of a large sample of manufacturing organiza-tions con"rms that the use of integrated manufac-turing techniques-particularly total quality management } in#uences performance, and that these e!ects are magni"ed or diminished by both the competitive environment and manu-facturing strategy. It also shows that, in some cases,
Table 1
IMSS questionnaire used for this study
Section Contents
SectionA Strategies, goals and costs
SectionC Past and planned activities in manufacturing SectionD Performance measures
strategy, performance measurement systems and improvement actions [25].
The second category aims to predict business performance based on strategic importance of com-petitive priorities and their implementation levels. That is, it attempts to evaluate the appropriateness of the relationship between strategic orientation, implementation levels and business performance through the construction of manufacturing com-petence models [26}30]. These studies mainly focus on a "rm's strategic orientation and its relative strength to derive manufacturing competence. Even though they seem to implicitly assume that more strength in important competitive priorities comes from better implementation of the appropriate practices, they do not directly address the consist-ency between strategic orientation and manufac-turing practices to evaluate the manufacmanufac-turing competence.
3. Empirical study
3.1. The sample
The questionnaire survey for this research was conducted as a part of the International Manufac-turing Strategy Survey II originally initiated by Per Lindberg, Chalmers University of Technology in Sweden and C.A. Voss, London School of Business in England. For this second round world-wide sur-vey, researchers from more than 20 countries in-cluding the US, Japan, Korea, and Western and Eastern European nations have been involved in establishing a common manufacturing database in order to compare di!erent manufacturing strat-egies among the nations. One of the major objec-tives of this survey is to suggest a direction for developing an appropriate country speci"c manu-facturing strategy and implementation program. More detailed explanations on IMSS researches can be found in a recent publication by participat-ing researchers [31].
This research focuses on how di!erent manufac-turing strategies and practices a!ect company performance. The sample used for this research consists of "fty Korean, forty-one American and twenty-nine Japanese manufacturing companies
se-lected from the IMSS (International Manufactur-ing Strategy Survey) II database. A set of survey items were also selected from Sections A, C and
D of IMSS II questionnaire. They include items such as strategic orientation or manufacturing goals to achieve, manufacturing practices or im-provement programs and performance measures as shown in Table 1. Nine strategic orientation items, measured in 5-point Likert scale (5"very impor-tant), were selected from Section A. Each of these items refers to the relative perceived im-portance of the respective manufacturing goal. Items about manufacturing practices or activities were selected from Section C. The degree of use measured in 5-point Likert scale (5"high) of these manufacturing improvement activities for last three years was used as the measure of practice variable. Pro"t before tax, sales and inventory values were selected from SectionDas performance measures.
3.2. Scale reliability
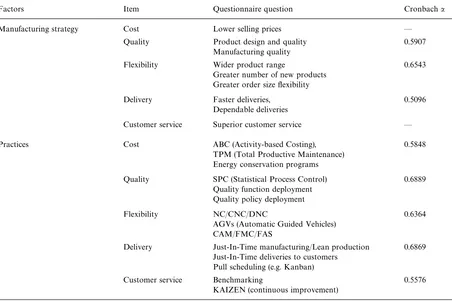
Table 2 Reliability test
Factors Item Questionnaire question Cronbacha
Manufacturing strategy Cost Lower selling prices *
Quality Product design and quality 0.5907
Manufacturing quality
Flexibility Wider product range 0.6543
Greater number of new products Greater order size#exibility
Delivery Faster deliveries, 0.5096
Dependable deliveries
Customer service Superior customer service *
Practices Cost ABC (Activity-based Costing), 0.5848
TPM (Total Productive Maintenance) Energy conservation programs
Quality SPC (Statistical Process Control) 0.6889 Quality function deployment
Quality policy deployment
Flexibility NC/CNC/DNC 0.6364
AGVs (Automatic Guided Vehicles) CAM/FMC/FAS
Delivery Just-In-Time manufacturing/Lean production 0.6869 Just-In-Time deliveries to customers
Pull scheduling (e.g. Kanban)
Customer service Benchmarking 0.5576
KAIZEN (continuous improvement)
Table 3
Gap comparison between the superior and the inferior groups based on pro"t-to-sales ratio
Capability category
Superior group
Inferior group
¹value (pvalue)
Cost 1.062 1.531 !1.96 (0.048) Quality 1.293 1.692 !2.02 (0.043) Flexibility 1.801 2.626 !2.75 (0.008) Delivery 1.214 1.108 !0.64 (0.543) Customer service 1.086 1.680 !2.75 (0.008) 3.3. GAP analysis
The absolute value of the di!erence between each strategic orientation variable and respective prac-tice variable was de"ned as the gap variable. A company's gap value of cost becomes lower if the perceived importance of cost leadership and imple-mentation level of cost improvement practices becomes closer.
Basically, IMSS II targeted the manufacturing industry of fabricated metal products, machinery and equipment whose International Standard In-dustrial Classi"cation Code ranges from 381 to 385. Thus, there exists a high similarity among country samples in terms of industrial background.
To analyze the overall e!ect of gap on company's performance, the whole sampled manufacturers were divided into two performance groups: su-perior and inferior. Median values of pro"t to sales
Table 4
Gap comparison between the superior and the inferior groups based on inventory turnovers
Capability category
Superior group
Inferior group
tvalue (pvalue)
Cost 1.446 1.240 0.32 (0.747)
Quality 1.532 1.851 !0.43 (0.668) Flexibility 1.611 1.469 1.05 (0.332) Delivery 1.812 1.552 1.32 (0.208) Customer service 1.157 1.003 0.48 (0.635)
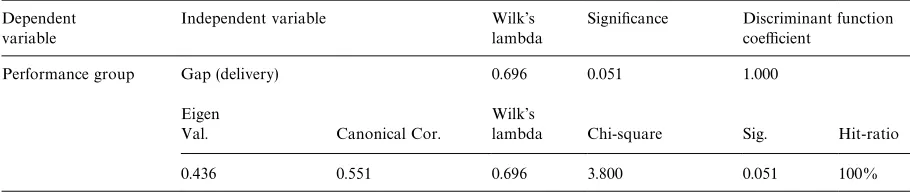
Table 5
Result of discriminant analysis (total sample)
Dependent Independent variable Wilk's Signi"cance Discriminant function
variable lambda coe$cient
Performance group Gap (delivery) 0.696 0.051 1.000
Eigen Wilk's
Val. Canonical Cor. lambda Chi-square Sig. Hit-ratio
0.436 0.551 0.696 3.800 0.051 100%
delivery show statistically signi"cant di!erence be-tween these two groups. For instance, gap value of the superior group in the customer service category is 1.086 which is signi"cantly lower than that of the inferior group (1.680). We may be able to say from this result that the higher the congruence between the strategic orientation and manufacturing practi-ces a company has, the higher its pro"t to sales ratio.
Table 4 shows the di!erence between the average gap values of the superior and the inferior groups in terms of inventory turnovers by manufacturing capability categories. All the gaps fail to show a statistically signi"cant di!erence between these two groups. One possible explanation for this somewhat unsatisfactory result may stem from the relatively high di!erence of average inventory levels among sampled industries. That is, industry di!erence may have a higher e!ect on inventory turnovers than the gap variable.
3.4. Discriminant analysis
To apply discriminant analysis, strategic orienta-tion, practices implementation and the gap between
them are considered as independent variables while superior and inferior performance groups are considered as dependent variables. For this discriminant analysis we di!erentiated groups by pro"t to sales ratio only since as mentioned above inventory turnovers seemed to be not appro-priate as a performance measure for gap analysis. From the discriminant analysis, we can assess the independent variables' relative importance to de-pendent variables. Discriminant analysis was car-ried out on the whole sample group in order to see which independent variable contributes most when the superior group is discriminated from the inferior group.
Table 6
Result of discriminant analysis (Korean sample)
Dependent Independent variable Wilk's Signi"cance Discriminant function
variable lambda coe$cient
Performance group Practices (quality) 0.073 0.009 5.891
Gap (quality) 0.020 0.020 !6.497
Gap (#exibility) 0.001 0.038 !5.098
Eigen Val. Canonical Wilk's Chi-square Sig. Hit-ratio
Cor. lambda
1118.109 1.000 0.001 10.530 0.015 100%
Table 7
Result of discriminant analysis (US sample)
Dependent Independent variable Wilk's Signi"cance Discriminant function
variable lambda coe$cient
Performance group Gap (#exibility) 0.036 0.018 !4.399
Gap (cost) 0.001 0.027 !4.428
Eigen Val. Canonical Cor. Wilk's lambda
Chi-square Sig. Hit-ratio
1335.500 1.000 0.001 7.198 0.027 100%
Three consecutive discriminant analyses, each of which was based on each country's manufacturers only, were also done to con"rm whether the pro-posed gap variables consistently outperform other strategy or practice variables across the nations. The"rst analysis was done for the Korean sample, and the result is given in Table 6. There we see that two gap variables (quality and#exibility) and one practice variable (quality) are statistically signi" -cant for discriminating the superior performance group from the inferior one. This result implies that a manufacturer in the Korean sample is more likely to belong to the superior performance group if its quality and#exibility focused strategic orientations and practices are well matched and place more emphasis on quality improvement practices. Thus, we can con"rm that gap variables seem to play a more important role for discriminating perfor-mance groups in the Korean sample too.
The result of discriminant analysis for the US sample is given in Table 7. Only the gap variables for#exibility and cost are included as a statistically signi"cant variable in the discriminant function. That is, a manufacturer with less variation between strategic orientation and practice implementation in terms of both#exibility and cost has more prob-ability of belonging to the superior performance group in the US sample. This result seems to strongly support our argument that the consistency between manufacturing strategies and practices is more important than strategic orientation or practice implementation itself in achieving better performance.
Table 8
Result of discriminant analysis (Japanese sample)
Dependent Independent variable Wilk's Signi"cance Discriminant function
variable lambda coe$cient
Performance group Practices (delivery) 0.062 0.032 7.572
Practices (customer service) 0.001 0.033 7.507
Eigen Val. Canonical Cor. Wilk's lambda
Chi-square Sig. Hit-ratio
891.167 0.999 0.001 6.794 0.033 62.50%
hardly applicable to the Japanese sample that the consistency between strategies and practices is more important for achieving higher performance than strategic orientation or practice implementa-tion alone. However, we need to be a little cautious in interpreting this discriminant analysis result be-cause the Japanese sample shows a less satisfactory discriminating result compared to the other sam-ples. Correctness in estimating a manufacturer's group membership based on the drawn dis-criminant function is only 62.50% which may be considered to be marginally higher than the ran-dom estimation. One possible explanation for this might be that it has a relatively limited number of respondents.
4. Conclusions
This study has the purpose of empirically testing the importance of consistency between manu-facturing strategies and practices in achieving better business performances. An empirical test has been conducted on the data sets from three di!erent nations, each of which seems to have quite di!erent manufacturing capabilities and competitive environments. This international comparison is to see whether this consistency-performance relationship can be generalized re-gardless of the nation speci"c characteristics of manufacturing systems.
What we have learned from the empirical study is that the gap variable indicating inconsistency between manufacturing strategy and
implementa-tion practices plays a more important role than the strategy or implementation variable in discriminat-ing the superior from the inferior performance groups. For those data sets from the US and Korea, the gap variables of#exibility, quality and/or cost show more signi"cant contribution for discriminat-ing between business performance groups. Even though this gap variable fails to outperform other strategy or implementation variables in discrimi-nating between performance groups in Japan, the overall discriminating power of the proposed gap variables can be considered to be signi"cant based on this"nding.
References
[1] J.C. Miller, A.V. Roth, A taxonomy of manufacturing strategies, Management Science 40 (3) (1994) 285}304. [2] W. Skinner, Manufacturing in the Corporate Strategy,
Wiley, New York, 1998.
[3] R.H. Hayes, S.C. Wheelwright, Restoring our competitive edge: competing through manufacturing, Wiley, New York, 1984.
[4] J.R. Dixon, A.J. Nanni, Jr., T.E. Vollmann, The New Performance Challenge: Measuring Operations for World-Class Competition, R.D. Irwin, Homewood, IL, 1990.
[5] W. Skinner, Manufacturing}missing link in corporate strategy, Harvard Business Review 47 (1969) 136}145. [6] W. Skinner, The focused factory, Harvard Business Review
52 (1974) 113}21.
[7] S.C. Wheelwright, Manufacturing strategy: De"ning the missing link, Strategic Management Journal 5 (1984) 77}91.
[9] T. Hill, Manufacturing Strategy: Text and Cases, R.D. Irwin, Homewood, IL, 1989.
[10] P. McDougall, R. Dean, D. D'Souza, Manufacturing strat-egy and business origin of ventures"rms in the computer and communications equipment industries, Production and Operations Management 1 (1) (1992) 53}69. [11] J.S. Kim, P. Arnold, Manufacturing competence and
busi-ness performance: A framework and empirical analysis, International Journal of Operations and Production Man-agement 13 (10) (1993) 4}25.
[12] C. Tunalv, Manufacturing strategy plans and business performance, International Journal of Operations and Production Management 12 (3) (1992) 4}24.
[13] M.A. Nobel, Manufacturing competitive priorities and productivity: An empirical study, International Journal of Operations and Production Management 17 (1) (1997) 85}99.
[14] F.P. Williams et al., Manufacturing strategy, business strategy and"rm performance in a mature industry, Jour-nal of Operations Management 13 (1995) 19}33. [15] M.T. Sweeney, M. Szwejczewski, Manufacturing strategy
and performance: A study of the UK engineering industry, International Journal of Operations and Production Management 16 (5) (1996) 25}40.
[16] P. Wright, M. Kroll, B. Pray, A. Lado, Strategic orienta-tions, competitive advantage, and business performance, Journal of Business Research 33 (1995) 143}151. [17] G. Taninecz, Best practices and performances, Industry
Week 246 (22) (1997a) 28}43.
[18] G. Taninecz, World-class manufacturers, Industry Week 246 (22) (1997b) 44}47.
[19] N.B. Beaumont, R.M. Schroder, Technology, manufactur-ing performance and business performance amongst Australian manufacturers, Technovation 17 (6) (1997) 297}307.
[20] J. Lowe, R. Delbridge, N. Oliver, High-performance manufacturing: Evidence from the automotive compo-nents industry, Organization Studies 18 (5) (1997) 783}798.
[21] J.G. Wacker, M. Hanson, Some practical advice for manu-facturing managers: Empirical results from the Global Manufacturing Research Group, Production and Inven-tory Management Journal 38 (3) (1997) 64}71.
[22] N.U. Ahmed, R.V. Montagno, R.J. Firenze, Operations strategy and organizational performance: An empirical study, International Journal of Operations and Produc-tion Management 16 (5) (1996) 41}53.
[23] R.H. Chenhall, S.K. Lang"eld, The relationship between strategic priorities, management techniques and manage-ment accounting: An empirical investigation using a sys-tems approach, Accounting, Organizations and Society 23 (3) (1998) 243}264.
[24] J.W. Dean, S.A. Snell, The strategic use of integrated manufacturing: An empirical examination, Strategic Man-agement Journal 17 (6) (1996) 459}480.
[25] L. Gelders, P. Mannaerts, J. Maes, Manufacturing strat-egy, performance indicators and improvement programs, International Journal of Production Research 32 (4) (1994) 797}805.
[26] G. Cleveland, R.G. Schroeder, J.C. Anderson, A theory of production competence, Decision Sciences 20 (1989) 655}668.
[27] S.K. Vickery, A theory of production competence revisited, Decision Sciences 22 (1991) 635}643.
[28] S.K. Vickery, C. Droge, R.E. Markland, Production competence and business strategy: Do they a!ect business performance? Decision Sciences 24 (2) (1993) 435}455. [29] Y. Kim, J. Lee, Manufacturing strategy and production
systems: An integrated framework, Journal of Operations Management 11 (1) (1993) 3}15.
[30] L.M. Corbett, 1995, Manufacturing competence and busi-ness performance: the New Zealand experience 1988}1992, Proceedings of Pan-Paci"c Conference, Dunedin Queen-stown, New Zealand, pp. 73}75.