The application of Shannon entropy in the identification of
putative drug targets
Stefanie Fuhrman *, Mary Jane Cunningham, Xiling Wen, Gary Zweiger,
Jeffrey J. Seilhamer, Roland Somogyi
Neurobiology Department,Incyte Pharmaceuticals Inc., 3174Porter Dri6e,Palo Alto,CA94304,USA
Abstract
A major challenge in the field of functional genomics is the development of computational techniques for organizing and interpreting large amounts of gene expression data. These methods will be critical for the discovery of new therapeutic drug targets. Here, we present a simple method for determining the most likely drug target candidates from temporal gene expression patterns assayed with reverse-transcription polymerase chain reaction (RT-PCR) and DNA microarrays. © 2000 Elsevier Science Ireland Ltd. All rights reserved.
Keywords:Information theory; Microarrays; PCR; Drug development; Gene expression; Genomics
www.elsevier.com/locate/biosystems
1. Introduction
The collection of large-scale gene expression data using DNA microarrays (Shalon et al., 1996), serial analysis of gene expression (SAGE; Velculescu et al., 1995), robotic reverse-transcrip-tion polymerase chain reacreverse-transcrip-tion (RT-PCR), and
EST databases such as LifeSeq®database (Incyte
Pharmaceuticals), offers a wealth of opportunities for the discovery of new therapeutic drug targets. Traditionally, biologists have focused their efforts on individual genes that demonstrate a single change in expression from the normal to the diseased state. We are now faced with the chal-lenge of determining the biological significance of
thousands of genes, all of which vary in expres-sion over time to some extent. The interpretation of large-scale gene expression data will require sophisticated analytical techniques for selecting good drug target candidates from among tens of thousands of expression patterns. It could be ar-gued that all genes — an estimated 100 000 – 150 000 in humans — are potential drug targets, since even genes that are expected to maintain constant expression levels show variations in these levels over time (Wen et al., 1998). Narrowing the field of candidate drug targets will therefore be critical for increasing the efficiency of the drug development process. Here, the use of Shannon entropy (Shannon and Weaver, 1963) is proposed as a method for selecting the most likely drug target candidates from among thousands of genes assayed in parallel.
* Corresponding author. Tel.: +1-650-8454235; fax: + 1-650-8454177.
E-mail address:[email protected] (S. Fuhrman)
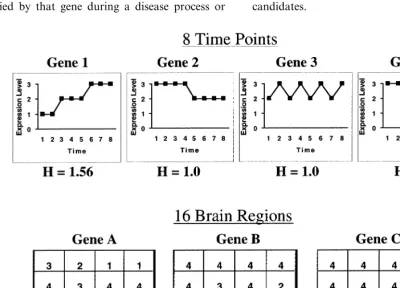
Shannon entropy (H) is a measure of the infor-mation content or complexity of a measurement series. It was originally developed by Claude Shannon for use in communications technology (series of signaling events in telegraphy; Shannon
and Weaver, 1963). In the present case,Hmay be
applied to temporal or anatomical gene
expres-sion patterns (Fig. 1). H provides a measure of
the information contained in a gene’s expression pattern over time, or across anatomical regions, and therefore indicates the amount of information carried by that gene during a disease process or
during normal phenotypic change. By definition, entropy measures variation or change in a series of events; unchanging patterns — such as genes with no diversity of expression levels — have zero entropy, or zero information. Genes that are ex-pressed at more than one level, on the other hand, have greater than zero entropy, and therefore contain information about phenotypic change (Fig. 1). It follows that the genes with highest entropy are the biggest participants in a disease process, and therefore, the best drug target candidates.
Although molecular biologists are accustomed to using change in gene expression as an indicator of physiological relevance, they have traditionally done so one gene at a time and without a formal definition of change. Measures used have included the quantification of a single increase or decrease in expression from normal to diseased, and non-quantitative descriptions of time series or anatom-ical patterns, among others. Shannon entropy, unlike these traditional measures, quantifies the information content of gene expression patterns over entire time courses or anatomical areas. This provides a more complete measure of each gene’s participation in a disease process, and permits a rank ordering by physiological relevance.
This paper demonstrates the application of Shannon entropy to actual large-scale temporal gene expression data, and explains how results such as these may be used in the discovery of new therapeutic drugs.
2. Methods
RT-PCR was used to assay mRNA levels of 112 genes at nine stages of rat spinal cord devel-opment (Wen et al., 1998). Triplicate animals were used for embryonic day 11 (E11), E13, E15, E18, E21, postnatal day 0 (P0), P7, P14, and P90 (adult). Gene expression levels were determined relative to a control at each time point. The control, a plasmid-derived RNA, was reverse transcribed and amplified with each PCR sample. After resolving the PCR products with polyacry-lamide gel electrophoresis (PAGE), the ratio of each sample to control band was used as a mea-sure of relative gene expression. Data from tripli-cate animals were then averaged, and the average used as the gene expression level at each time point. For each gene, expression levels were nor-malized to maximal expression in the time series for that gene. Entropy was calculated for each of the 112 normalized temporal expression patterns, using the definition,H= −Spilog2pi, wherepis the probability (frequency) of occurrence of a
level of gene expression, i. Gene expression was
binned into three levels for this calculation (see Section 4 and the caption for Table 1 for explanation).
Gene expression microarrays (GEM™ microar-rays) at Incyte Pharmaceuticals were used to as-say relative gene expression levels of 7400 rat genes over a time series. For each experiment, one of three compounds was administered to male rats (triplicate animals), i.p., in doses known to cause
toxicity: benzo(a)pyrene, clofibrate, and
ac-etaminophen. Rats were sacrificed at six intervals (12 h, 24 h, 3 days, 7 days, 14 days, and 28 days; there are only five time points for clofibrate, since the 14-day rat did not survive the treatment) and their livers snap frozen in liquid nitrogen. Total RNA was isolated by the Trizol procedure (Life Technologies, Gaithersburg, MD), and polyA mRNA was selected and purified from total RNA by the OligoTex method (Qiagen, Valencia, CA). The mRNA was then assayed using microarrays, with one microarray per time point. The same control animal (treated with dimethyl sulfoxide (DMSO) vehicle, sacrificed after 12 h) was used on all microarrays for comparison with hepato-toxin-treated animals. cDNAs made from sample mRNAs were labeled with fluorescent tags: Cy5 for toxin-treated, and Cy3 for control. Competi-tive hybridization of the two sets of cDNA for DNA probes spotted on microarrays resulted in color differences based on the ratio of Cy5 to Cy3 at each spot. For each gene represented by a probe on the microarray, the relative expression level of toxin-treated to control was then deter-mined. Entropy analysis included only one rat per hepatotoxin treatment, and only those genes that have a known function and were expressed in all
three hepatotoxin treatments (approx. 1000
genes). For each gene, expression levels were nor-malized to the maximal expression in the time series for that gene. Entropy was then calculated for each of the 1000 temporal expression patterns, as described above for the PCR data, except that only two bins were used.
3. Results
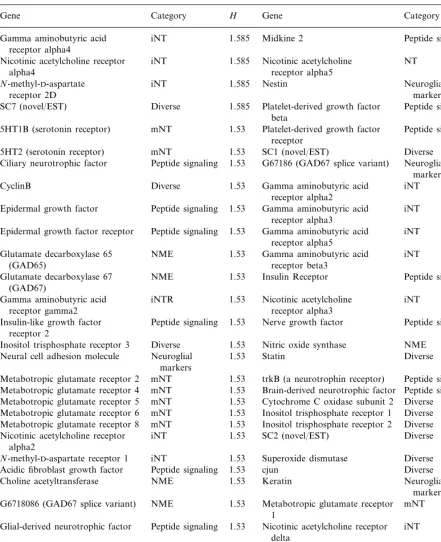
Table 1
Entropy for genes expressed in the developing rat spinal corda
H
Gene Category Gene Category H
iNT 1.585
Gamma aminobutyric acid Midkine 2 Peptide signaling 1.352
receptor alpha4
iNT 1.585
Nicotinic acetylcholine receptor Nicotinic acetylcholine NT 1.352 receptor alpha5
alpha4
iNT 1.585
N-methyl-D-aspartate Nestin Neuroglial 1.352
markers receptor 2D
1.585
SC7 (novel/EST) Diverse Platelet-derived growth factor Peptide signaling 1.352 beta
1.53 Platelet-derived growth factor mNT
5HT1B (serotonin receptor) Peptide signaling 1.352
receptor
1.53 SC1 (novel/EST) Diverse 1.352 5HT2 (serotonin receptor) mNT
1.53 G67186 (GAD67 splice variant)
Peptide signaling Neuroglial
Ciliary neurotrophic factor 1.224
markers Diverse
CyclinB 1.53 Gamma aminobutyric acid iNT 1.224
receptor alpha2 Peptide signaling
Epidermal growth factor 1.53 Gamma aminobutyric acid iNT 1.224
receptor alpha3 1.53 Gamma aminobutyric acid Peptide signaling
Epidermal growth factor receptor iNT 1.224
receptor alpha5
Glutamate decarboxylase 65 NME 1.53 Gamma aminobutyric acid iNT 1.224 receptor beta3
(GAD65)
NME 1.53
Glutamate decarboxylase 67 Insulin Receptor Peptide signaling 1.224 (GAD67)
iNTR 1.53
Gamma aminobutyric acid Nicotinic acetylcholine iNT 1.224
receptor alpha3 receptor gamma2
Peptide signaling 1.53
Insulin-like growth factor Nerve growth factor Peptide signaling 1.224 receptor 2
Diverse
Inositol trisphosphate receptor 3 1.53 Nitric oxide synthase NME 1.224 1.53 Statin
Neuroglial Diverse
Neural cell adhesion molecule 1.224
markers
Metabotropic glutamate receptor 2 mNT 1.53 trkB (a neurotrophin receptor) Peptide signaling 1.224 Metabotropic glutamate receptor 4 mNT 1.53 Brain-derived neurotrophic factor Peptide signaling 0.991
1.53 Cytochrome C oxidase subunit 2
mNT Diverse
Metabotropic glutamate receptor 5 0.991
1.53 Inositol trisphosphate receptor 1
Metabotropic glutamate receptor 6 mNT Diverse 0.991
1.53 Inositol trisphosphate receptor 2 Diverse 0.991 Metabotropic glutamate receptor 8 mNT
iNT 1.53
Nicotinic acetylcholine receptor SC2 (novel/EST) Diverse 0.991 alpha2
N-methyl-D-aspartate receptor 1 iNT 1.53 Superoxide dismutase Diverse 0.991 1.53 cjun
Peptide signaling Diverse
Acidic fibroblast growth factor 0.986
Choline acetyltransferase NME 1.53 Keratin Neuroglial 0.986
markers 1.53 Metabotropic glutamate receptor
NME
G6718086 (GAD67 splice variant) mNT 0.986
1
1.53 Nicotinic acetylcholine receptor Peptide signaling
Glial-derived neurotrophic factor iNT 0.986
delta
iNT 1.53 Neuron-specific enolase
Gamma aminobutyric acid Neuroglial 0.986
markers receptor gamma1
1.53
Muscarinic acetylcholine receptor 3 mNT Neurofilament medium Neuroglial 0.986 markers
N-methyl-D-aspartate receptor 1.53
Neuroglial
Neurofilament heavy iNT 0.986
markers 2A
1.53
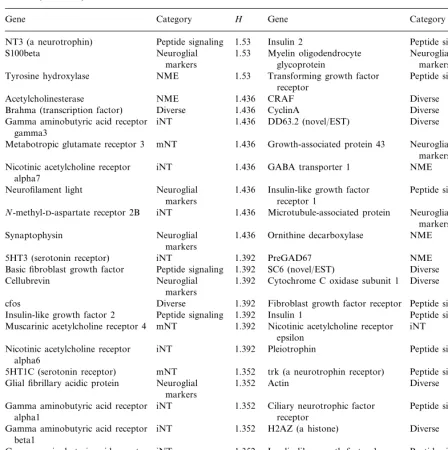
Table 1 (Continued)
Gene Category H Gene Category H
1.53 Insulin 2
NT3 (a neurotrophin) Peptide signaling Peptide signaling 0.918
S100beta Neuroglial 1.53 Myelin oligodendrocyte Neuroglial 0.918 markers
glycoprotein markers
1.53 Transforming growth factor
NME Peptide signaling 0.918
Tyrosine hydroxylase
receptor 1.436 CRAF
Acetylcholinesterase NME Diverse 0.764
1.436 CyclinA Diverse 0.764
Brahma (transcription factor) Diverse
iNT 1.436 DD63.2 (novel/EST) Diverse
Gamma aminobutyric acid receptor 0.764
gamma3
mNT
Metabotropic glutamate receptor 3 1.436 Growth-associated protein 43 Neuroglial 0.764 markers
Nicotinic acetylcholine receptor iNT 1.436 GABA transporter 1 NME 0.764 alpha7
Insulin-like growth factor 1.436
Neuroglial
Neurofilament light Peptide signaling 0.764
markers receptor 1
1.436 Microtubule-associated protein
iNT Neuroglial
N-methyl-D-aspartate receptor 2B 0.764
markers Neuroglial 1.436
Synaptophysin Ornithine decarboxylase NME 0.764
markers
1.392 PreGAD67
5HT3 (serotonin receptor) iNT NME 0.764
1.392
Basic fibroblast growth factor Peptide signaling SC6 (novel/EST) Diverse 0.764 1.392 Cytochrome C oxidase subunit 1
Neuroglial Diverse
Cellubrevin 0.503
markers
1.392 Fibroblast growth factor receptor
cfos Diverse Peptide signaling 0.503
1.392 Insulin 1
Peptide signaling Peptide signaling
Insulin-like growth factor 2 0.503
1.392 Nicotinic acetylcholine receptor mNT
Muscarinic acetylcholine receptor 4 iNT 0.503
epsilon
iNT 1.392
Nicotinic acetylcholine receptor Pleiotrophin Peptide signaling 0.503 alpha6
1.352 trk (a neurotrophin receptor)
5HT1C (serotonin receptor) mNT Peptide signaling 0.503
1.352 Actin
Neuroglial Diverse
Glial fibrillary acidic protein 0
markers
iNT 1.352
Gamma aminobutyric acid receptor Ciliary neurotrophic factor Peptide signaling 0 receptor
alpha1
iNT 1.352
Gamma aminobutyric acid receptor H2AZ (a histone) Diverse 0
beta1
iNT 1.352
Gamma aminobutyric acid receptor Insulin-like growth factor 1 Peptide signaling 0 beta2
1.352 Platelet-derived growth factor mNT
Muscarinic acetylcholine receptor 2 Peptide signaling 0
alpha mNT
Metabotropic glutamate receptor 7 1.352 T-complex protein (transcription Diverse 0 factor)
aShannon entropy for 112 genes expressed in rat spinal cord for developmental stages ranging from embryonic day 11 to adult
(postnatal day 90). Normalized time series data were grouped into three mRNA expression levels or bins: bin 1B0.34; bin 2 ranges from 0.34 to 0.66; bin 3 ranges from 0.67 to 1.00. (See Wen et al., 1998 for normalized data and http://rsb.info.nih.gov/mol-physiol/
PNAS/GEMtable.html for raw data.) Entropy (H) was then calculated for each gene using the definitionH= −Spilog2pi, where p is the frequency of a gene expression level, i, for the time series. H is expressed in bits. Abbreviations: iNT, ionotropic neurotransmitter receptors; mNT, metabotropic neurotransmitter receptors; NME, neurotransmitter metabolizing enzymes.
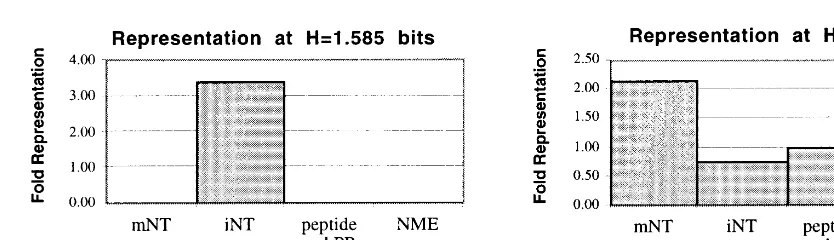
the ionotropic neurotransmitter receptors are con-centrated at the highest entropy level (1.585 bits), with almost 3.5-fold as many as were expected.
Fig. 2. Representation of functional categories at high entropy in rat spinal cord development. (A) At 1.585 bits of entropy, ionotropic neurotransmitter receptors (iNT) are represented at more than three times the expected frequency, while metabotropic neurotransmitter receptors (mNT), peptides and peptide receptors (peptide and PR), and neurotransmitter metabolizing enzymes (NME) are not represented at all. (B) At 1.53 bits, the next highest entropy value, mNT and NME occur at more than two-fold their expected frequencies, while peptide and PR are found in the same relative abundance as in the total assay, and iNT are somewhat under-represented.
Table 2
Functional category representation at different levels of entropy in developing rat spinal corda
Entropy (bits)
1.53
1.585 1.436 1.392 1.352 1.224 0.991 0.986 0.918 0.764 0.503 0
0.27 0.13 0.14 0.23 –
mNT – – 0.13 – – – –
0.17 0.38 0.29 0.31 0.45 – 0.25 – –
iNT 0.75 0.17 –
0.23 – 0.29 0.23 0.27 0.17
– 0.13
Peptide or PR 0.67 0.10 0.67 0.50
0.17
NME – 0.13 – – 0.18 – – – 0.30 – –
aProportion of every entropy level occupied by different functional categories of genes in spinal cord development. Totals do not
equal 1 because only the four largest functional categories are included in the table: mNT, metabotropic neurotransmitter receptors (G protein-coupled receptors); iNT, ionotropic neurotransmitter receptors; peptide or PR, peptides or peptide receptors (receptor tyrosine kinases); and NME, neurotransmitter metabolizing enzymes.
1.53 bits, the metabotropic neurotransmitter re-ceptors and neurotransmitter metabolizing en-zyme genes are over-represented (Fig. 2(B)). The proportion of every entropy level occupied by different functional categories of genes is
shown in Table 2. Both ionotropic and
metabotropic neurotransmitter receptor genes
are clearly biased toward high entropy.
Con-versely, peptide and peptide receptor genes
are represented at expected levels at high tropy values, and over-represented at low en-tropy.
4. Discussion
The application of Shannon entropy reduces the range of potential drug targets to a more manageable size. By focusing on the genes with the highest entropy in a particular disease model, limited resources may be concentrated on those shown to be the most important participants in a
disease process. Results from our toxicology study suggest that very high entropy genes may repre-sent less than 10% of the genome, and that most genes have low entropy, at least in response to toxins. Further, the observation that certain func-tional classes of genes are concentrated at high entropy levels may be useful in further studies, permitting a focus on the assay of more genes in those categories.
Given that the high entropy list may contain as many as 500 – 1000 genes for an assay of 10 000, decisions must be made as to which of these would make the best targets for laboratory test-ing. The most practical approach to this problem is the selection of receptors for which ligands are already known. For instance, suppose that genes for a group of metabotropic receptors have high entropy in an animal model of a degenerative disease. Although these particular receptors may never have been associated with that disease be-fore, given their high entropy it would be worth treating a set of animals with agonists or antago-nists for these receptors, to determine whether there are any effects on the pathology.
The application of Shannon entropy in the analysis of mRNA patterns may be limited by the possibility of poor correlations between transcript abundance and protein activity. For example, some high entropy gene expression patterns may correspond to low entropy protein expression or protein activity patterns. In this case, the high entropy short list would be contaminated by genes that actually have low entropy in a functional sense. Instances of poor correlations between mRNA expression and protein expression have been found in yeast (Gygi et al., 1999). However, many studies have shown that transcript and protein abundance or activity are well-correlated over time series and anatomical regions, as in the cases of opiate receptor distribution (George et al., 1994), lipoprotein lipase activity (Uchida et al., 1995) and adenosine receptor expression (Matherne et al., 1996).
Another possible source of false high entropy values is the problem of binning artifacts caused by data points that lie close to, and on either side of, bin boundaries. This problem, which dimin-Table 3
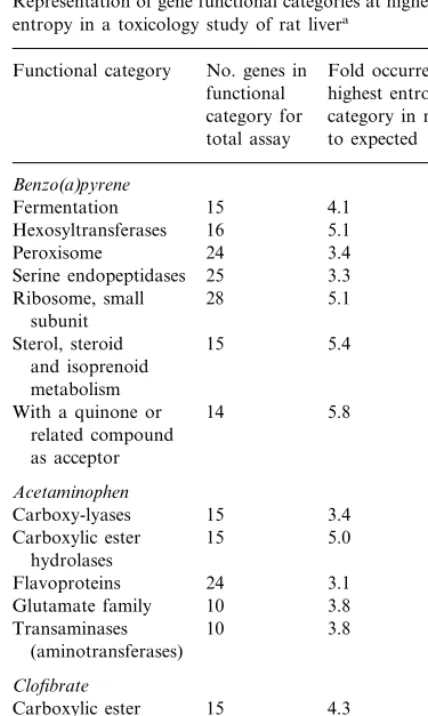
Representation of gene functional categories at highest level of entropy in a toxicology study of rat livera
No. genes in Fold occurrence in Functional category
functional highest entropy category in relation category for
total assay to expected
Benzo(a)pyrene Ribosome, small 28 5.1
subunit
5.4 Sterol, steroid 15
and isoprenoid metabolism
With a quinone or 14 5.8 related compound
Glutamate family 10 6.4 Urea metabolism 13 4.9
25
With oxygen as 3.4
acceptor
aFunctional categories over-represented at high entropy in a
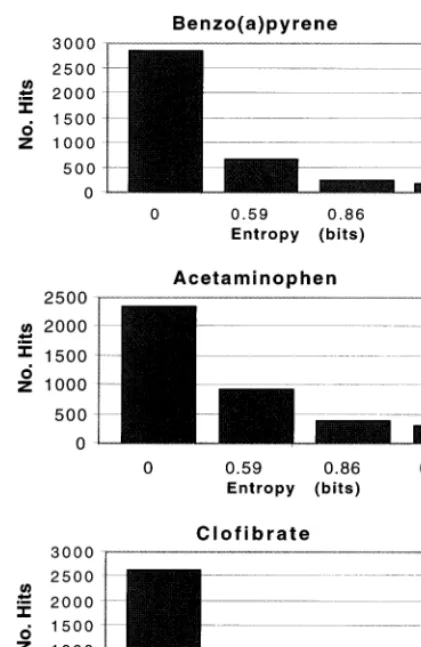
Fig. 3. Histograms of functional categories occurring at differ-ent differ-entropy values in rat liver toxicology study. Most of the gene expression patterns exhibit low entropy, regardless of toxin administered (benzo(a)pyrene, acetaminophen, or clofi-brate). Since each gene falls under a number of functional categories, the total number of ‘hits’ is about 4000 (four times the number of genes). Entropy was calculated based on seven time points for benzo(a)pyrene and acetaminophen, and six time points for clofibrate; this includes the ‘zero’ time point (DMSO control).
genes that show little variation in expression, but could, by some unknown pathway, have an effect on the disease if perturbed. False low entropy values may be obtained for genes that fluctuate over unexpectedly short time intervals, and for those that have a single, large measurement error such as a very high or very low expression value in a time series or anatomical survey. In addition, some targets will be missed if they initiate the disease process with a single spike. These exam-ples would not interfere with the use of the high entropy list, however. Given an estimated 100 000 or more human genes, it makes sense to concen-trate limited resources on those that are ‘likely’ participants in disease development — the high entropy genes.
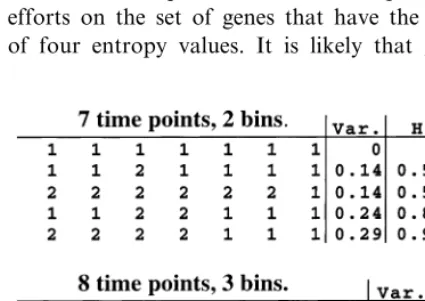
To further illustrate the appropriateness of en-tropy as a measure of biological complexity, it may be worthwhile to consider another possible measure of gene expression patterns, such as the variance. At the Santa Fe Institute, it was demon-strated that, for statistical reasons, the number of bins used in entropy calculations should be less than or equal to the log of the number of events (Bruce Sawhill, personal communication). There-fore, in the case of patterns with fewer than eight time points or anatomical regions, expression lev-els can be binned into no more than two levlev-els. In this situation, the variance will produce the same rank ordering of genes as will entropy. However, in cases that allow for more than two bins, the merits of entropy become apparent. The variance places an emphasis on the actual distance between expression levels, thereby inflating the rank of certain patterns with low entropy, while reducing the rank of the most complex patterns (Fig. 4). The variance would therefore function more as a distance measure for changes between expression levels, rather than as a measure of complexity.
It could be argued, on the other hand, that expression level differences are important, and that entropy fails to account for this. However, if sampling intervals are of the appropriate size, a jump in expression from, e.g. level 1 to level 3 suggests that level 2 may not be physiologically relevant. Biological systems need time to respond to a change in gene expression, and sampling intervals should be selected based on knowledge ishes with higher bin numbers, can be rectified by
graphing the expression patterns of the final short list of drug target candidates and eliminating low entropy genes by visual inspection.
of the rates of response for each system. Fur-ther, entropy recognizes the most efficient distri-bution of expression levels. If a gene has an entropy value near the theoretical maximum, then all expression levels will occur for approxi-mately equal time periods. For example, for three bins, a near-maximal entropy time series will be at each of the three expression levels for a significant portion of the time course. This decreases the chance that an expression level is irrelevant physiologically.
The application of entropy improves with large amounts of gene expression data. In some situations, however, it may not be economical to collect data from large numbers of time points or anatomical regions. This may be a problem in that a limited number of data points will restrict the number of entropy values. For ex-ample, in the case of seven time points and two bins, as in our toxicology study (seven includes the DMSO control or ‘zero’ time point), the re-sult will be four different entropy values. It would then be possible to focus drug discovery efforts on the set of genes that have the highest of four entropy values. It is likely that given a
larger number of time points, many of the genes in that highest entropy category would be spread out among a number of entropy values. Ideally, each gene assayed would have its own unique entropy, permitting a selection of the best, second best, third best, etc., from the rank-ordered list. Although this would require impos-sibly large amounts of data, it is appropriate to collect as many data points as possible, thereby allowing for a large number of entropy values. This will provide greater precision in selecting the best drug target candidates.
Ideally, experiments should be run in parallel with non-diseased controls that follow the same time course. This will prevent, for example, the effects of normal aging from being confused with those of a degenerative disease. Some genes may have high entropy over the course of nor-mal aging; we can subtract the nornor-mal from the abnormal fluctuations to correct for this, before calculating entropy. In that context, we are cur-rently conducting studies of degenerative
dis-eases in animals. Through the use of
microarrays and RT-PCR, with subsequent
pharmacological studies, we will attempt to demonstrate the effectiveness of Shannon en-tropy as a guide to discovering new therapeutic drug targets.
References
George, S.R., Zastawney, R.L., Briones-Urbina, R., Cheng, R., Nguyen, T., Heiber, M., Kouvelas, A., Chan, A.S., O’Dowd, B.F., 1994. Distinct distributions ofm,d, and k
opioid receptor mRNA in rat brain. Biochem. Biophys. Res. Commun. 205 (2), 1438 – 1444.
Gygi, S.P., Rochon, Y., Franza, B.R., Aebersold, R., 1999. Correlation between protein and mRNA abundance in yeast. Mol. Cell. Biol. 19 (3), 1720 – 1730.
Matherne, G.P., Byford, A.M., Gilrain, J.T., Dalkin, A.C., 1996. Changes in myocardial A1 adenosine receptor and message levels during fetal development and postnatal maturation. Biol. Neonate 70 (4), 199 – 205.
Shalon, D., Smith, S.J., Brown, P.O., 1996. A DNA microarray system for analyzing complex DNA samples using two-color fluorescent probe hybridization. Genome Res. 6, 639 – 645.
Shannon, C.E., Weaver, W., 1963. The Mathematical Theory of Communication. University of Illinois Press, Cham-paign, IL.
Uchida, Y., Irie, K., Tsukahara, F., Ohba, K., Ogawa, A., Fujii, E., Muraki, T., 1995. Endothelin-1, but not endothelin-3, suppresses lipoprotein lipase gene expression in brown adipocytes differentiated in culture. Eur. J. Pharmacol. 291 (1), 33 – 41.
Velculescu, V.E., Zhang, L., Vogelstein, B., Kinzler, K.W.,
1995. Serial analysis of gene expression. Science 270, 484 – 487.
Wen, X., Fuhrman, S., Michaels, G.S., Carr, D.B., Smith, S., Barker, J.L., Somogyi, R., 1998. Large-scale temporal gene expression mapping of CNS development. Proc. Natl. Acad. Sci. USA 95, 334 – 339.