An input/output methodology to evaluate farms as sustainable
agroecosystems: an application of indicators to farms in central Italy
Vittorio Tellarini
a,∗, Fabio Caporali
baDipartimento di Economia dell’Agricoltura, dell’Ambiente Agro-Forestale e del Territorio, Via del Borghetto 80, 56124 Pisa, Italy bDipartimento di Produzione Vegetale, Università della Tuscia, Viterbo, Italy
Accepted 19 July 1999
Abstract
Agricultural researchers recognize the importance of the sustainability of agricultural systems and the need to develop appropriate ways to measure sustainability. The search for agroecosystem performance indicators (APIs) is an urgent task to develop understanding and to facilitate decision-making processes. The paper provides an input/output methodology for a farming system analysis in terms of both energy and monetary values, measurements that are sufficiently homogenizing and comprehensive to document patterns of agroecosystem transfers of bio-physical entities and socio-cultural values. This methodology was applied to two adjacent farms located in Central Italy, which differed in the farming system adopted (mixed farming and arable farming) and in the level of external input applied. A broad range of APIs (structural and functional, direct and crossed) was developed to analyze both the fundamental energy transfers (and associated allocation of monetary values) between the crucial agroecosystem components and the overall efficiency of the farming system in transforming different external input into output. This analysis shows that energy and monetary values do not offer a single, coherent account of the functioning of farm systems. The study stresses the need for the development of an environmental accounting method, which integrates ecological and economic aspects. For the present, it is recognized that structural and functional APIs calculated according to energy, rather than monetary, values are more meaningful in both the designing of sustainable farming systems and in decision-making processes. ©2000 Elsevier Science B.V. All rights reserved.
Keywords:Sustainability; Agroecosystem performance indicators; Input/output model; Farming systems
1. Introduction
In an other paper (Caporali et al., 1989), the criteria for the construction of environmentally sound agroe-cosystems, the advantages of studying agroecosystem processes and performances at farm level, and the
∗Corresponding author. Tel.: +39-050-540260; fax:
+39-050-572511
E-mail address:[email protected] (V. Tellarini)
need to promote research into the development of agroecosystem performance indicators (APIs) were re-ported. A similar position was contemporarily taken by Lynam and Herdt (1989) and has recently been rein-forced by Tisdell (1996), Yridoe and Weersink (1997) and Webster (1997). Lynam and Herdt (1989) empha-sized that agricultural researchers should
a. recognize the importance of the sustainability of agricultural systems,
b. devise appropriate ways of measuring sustainabil-ity,
c. empirically examine the sustainability of some well-defined cropping or farming systems, d. define the externalities present in such systems,
and
e. develop methods to measure those externalities. Tisdell (1996) reviews suggestions made in the litera-ture for developing appropriate indicators and recog-nizes that obtaining operational and predictive indi-cators of the economic viability of a farming system depends on a variety of attributes. Indeed, economic viability is also related to the sustainability of the nat-ural productivity of soils and other natnat-ural resources on which economic production partially depends, so economic indicators depend in part on non-economic factors, and a holistic approach is needed. In a re-view of the evaluation of agroecosystem health, Yridoe and Weersink (1997) affirm that “there has so far not been an integrated economic framework within which indicators can be developed and interpreted as a basis for evaluating agroecosystem health.” Webster (1997) stressed that current farming systems are de-veloping an undesirable rural environment in the so-cial, economic and ecological sense, and that there is a need to move from existing farming systems to ‘stain-able’arming systems. Sustainability should involve a reduction in external inputs and a move towards inter-nal self-sufficiency, but it is recognized that the iden-tification and measurement of sustainability indicators is still under development. In an attempt to present a systematic framework of sustainability indicators, Azar et al. (1996) emphasize societal activities that af-fect the nature and internal societal use of resources, as opposed to environmental quality indicators. In this way, socio-ecological indicators may provide a warn-ing of an unsustainable use of resources and thus serve as a tool in planning and decision-making processes. In general, there is a shared awareness that obtain-ing acceptable indicators for sustainability assessment is still both an unsolved problem and an urgent chal-lenge for researchers. In this context, results obtained in case-study surveys carried out at farm level in Cen-tral Italy are presented to illustrate the above con-cerns. The aim was to develop APIs that have both an epistemological and a practical significance, represent-ing, respectively: (a) an efficient instrument of inquiry for studying agroecosystem functioning and perfor-mance according to an input/output approach; and (b) a relevant knowledge base for both the designing
of sustainable agroecosystems and decision-making processes.
2. Methodology for evaluation of the farm as a sustainable agroecosystem
For a sustainability assessment it is essential to es-tablish the performances of contrasting agroecosys-tems, i.e., functioning prevalently on the basis of the flow of either solar or auxiliary energy. There is gen-eral agreement (Wagstaff, 1987; Webster, 1997) that negative environmental impact is lower in agroecosys-tems which employ less auxiliary energy. The APIs should highlight those forms of organization capable of better exploiting the system’s native resources (so-lar radiation, soil organic matter, atmospheric nitrogen, etc.) rather than imported, non-renewable resources. Hence, the need to establish a methodology capable of evidencing flows of information and energy-matter not only between the farm and the outside world, but also within the farm. Monetary and energy values were used to measure, respectively, the flow of information and the flow of energy-matter. These measures are re-garded as sufficiently homogenizing and comprehen-sive to document patterns of agroecosystem transfers of bio-physical entities and socio-cultural values. With this approach, and using energetic and economic ac-counting criteria, the farm was studied as both a ther-modynamic and economic unit.
2.1. The structure of the input/output matrix
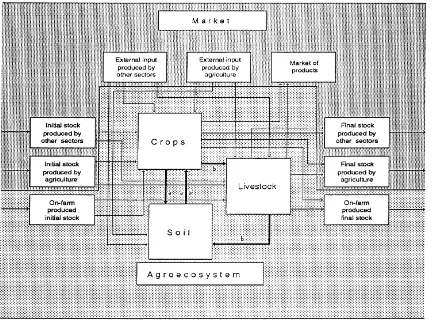
Fig. 1. Spatial-temporal representation of an agroecosystem. Energy, material and monetary transfers existing between market and the elementary sectors of the farm are represented. (a) small circulation (b) large circulation.
Each arrow linking two sectors represents both an output for the first sector (from which it origi-nates), and an input for the second sector (to which it is directed). It is thereby possible to produce a budget for the whole agroecosystem of both finan-cial flows and energy and material flows (Ulanow-icz, 1986). The methodology can be applied to the farm, considered as hierarchically organized in the following way: individual fields; individual crops; cultivation systems (herbaceous and arboreal) and animal breeding; and whole farm. Each of the three sectors (crops, animals and soil) is an aggregate of elementary units, which, from a basic I/O matrix, can be seen to make up a large number of items, varying from one sector to another. For each item, the material, energy and monetary value flows can
be analyzed both to and from the other sectors, and to and from the outside world. Each junction of the network is connected to the outside both in space (the market) and time (previous and subsequent cy-cles). Each sector is similarly linked to the others: crops and soil exchange water, gas, mineral elements and organic compounds (small circulation). The crop sector supplies the livestock sector with biomasses for re-use, and the livestock sector, in turn, supplies manure back to the soil sector (large circulation). Be-tween these three sectors there are on-farm transfers of energy-materials.
that can be re-used on the farm (in the same or differ-ent sector) or leave the system definitively.
The market, which is regarded as the external socio-economic environment where the farm is im-mersed, has been divided into two large parts: the primary sector (i.e., agriculture) and the other sectors. Only the former is capable of using renewable energy, i.e., energy derived from fossil fuels; the latter supply non-renewable energy. The different environmental significance of the input produced by the two sectors is obvious.
The other distinguishing element of the market area (valid also for the farm system) is represented by time. Input can come from previous cycles (either pur-chased: market; or produced: farm) and, in turn, out-put can be used in subsequent cycles (with the same purchased/produced distinction), either re-used on the farm or sold.
With this kind of model it is not only possible to measure total input and output, but also internal move-ments from one sector to another, and even within each sector.
As an example, Table 1 is one of the I/O matrices which were aggregated from the elementary ones built both for energy and monetary values in the two farms studied. In few words, the I/O matrix indicates, sector by sector, what and how much, in terms of both en-ergy and monetary values, has been consumed (read-ing down the columns) to produce how much and for what purpose (reading across the lines) (Tellarini and Caporali, 1992).
2.2. Agroecosystem performance indicators
A series of APIs are presented. Each of them can be calculated both in terms of energy and monetary value; in addition, they can be ‘direct’, i.e., obtained as relationships between homogeneous entities: en-ergy/energy; money/money, etc., or ‘crossed’, i.e., ob-tained by relating dimensionally different measure-ments: energy values with monetary values and vice versa.
Since the flows within the farm and between farm and external world may be expressed as energy or as monetary values or as nutrients, all direct APIs can be calculated for each of these flows. Thus, in the presentation of the various APIs below, reference to
energy may be replaced by monetary values or by nutrients. Only the field of observation changes, not the model of reasoning.
The case of crossed indicators, however, is differ-ent. Each of these has its specific significance and so they must be constructed by opportune combination of the different entities, with reference to the particular objective to be reached.
Clearly all the indicators presented here — which are certainly not exhaustive — can be calculated both at the level of individual production sector and that of farm as a whole.
2.2.1. The direct agroecosystem performance indicators
By relating each type (or combination) of output to each type (or combination) of input, it is possible to obtain a considerable amount of information on both the circulation of energy (and monetary values) within the farm and the efficiency with which these resources are used, both at the level of individual sector and farm as a whole. In this way, it is possible to evaluate the level of energy dependency of the farm (or of each single sector) both on the world external to the farm and on non-renewable input. In other words, the sustainability level of the farm’s agricultural activity. Without making an overly emphatic distinction, the direct APIs can be subdivided into two large categories:
(a) structural indicators; and (b) functional indicators.
The first category aims to describe the most relevant (from the environmental point of view) characteristics of agricultural systems and, therefore, to illustrate the differences and similarities between systems, while the second category aims to measure the efficiency of the different systems. All of these indicators are calculated both in energy and in monetary values.
The reader is referred to the appropriate tables in the following text to illustrate how the indicators are used.
2.2.1.1.1. Indicator of dependence on non-renewable energy sources (i4/i8). This is without doubt the first and most important API. It is calculated as the ratio between energy from input produced by other sectors (and, therefore, non-renewable: machines, oil, fertil-izers, etc.: i4), and total energy introduced into the system (i8). It tells us to what extent the production process depends on non-renewable energy.
2.2.1.1.2. Indicator of obligatory re-use [(i1a + i2a)/
i8]. By relating the sum of energy input outside the
entrepreneur’s control (i1a + i2a) to total farm input (i8), it is possible to measure what might be called the ‘base’ energy quota of the agroecosystem; i.e., the energy that the system automatically reappropriates in order to function. This is the case, for example, of to the energy of the roots which remain in the soil after the harvest (Janssen, 1984).
2.2.1.1.3. Indicator of immediate voluntary re-use (i1b/i8). This indicator is obtained as ratio of the energy value of voluntary internal transfers (i1b) to the total value of energy introduced into the system (i8); from it, it is possible to have an indication of the extent to which the agroecosystem is consciously following the path of sustainability; i.e., how much newly produced energy the entrepreneur chooses to reintroduce immediately into the production cycle.
2.2.1.1.4. Indicator of deferred voluntary re-use (i2b/i8). This indicator integrates the previous one in that it measures the quota of energy deriving from input produced in previous years (i2b) and voluntarily reintroduced into the system.
2.2.1.1.5. Global indicator of voluntary re-use [(i1b + i2b)/i8]. In order to have a comprehensive idea of the basic choices of the agroecosystem it is possible, of course, to add the two previous indicators together.
2.2.1.1.6. Indicator of farm autonomy (i5/i8). This indicator is merely an extension of the four previous ones in that it indicates to what extent the farm can supply its own energy. In fact, included in the calcu-lation of this indicator are those factors that the farm produced in the course of the previous cycle and that
are used in the current one. It is possible to hypothe-size that, in general, low values of this indicator
cor-respond to low values of the indicator of immediate
re-useand high values of theindicator of dependence on non-renewable energy sources.
2.2.1.1.7. Indicator of overall sustainability (i7/i8). In actual fact, from the environmental point of view, the indicator of farm autonomy holds no specific significance because it may not be particularly rele-vant to know whether or not the farm is prevalently self-sufficient in terms of production process energy requirements. Indeed, from the environmental point of view, it makes no difference whether a farm pro-duces all its own energy or buys it from other farms. What is important is that input produced by agricul-ture is maximized. Herein lies the importance of the indicator of overall sustainability, which, calculated as the ratio of total agricultural energy input (i7) to total input (i8), is simply the complement to 1 of the indicator of dependence on non-renewable energy sources, to which it may be used as an alternative. What changes is simply the point of view from which the production phenomenon is seen: this indicator en-courages a view of the agricultural system as a whole, underlining the importance of the prevalent (or, better still, exclusive) use of completely renewable energy, especially that produced by agriculture.
2.2.1.2. Structural indicators related to output
2.2.1.2.1. Indicator of immediate removal (o3/o5). This indicator is the ratio of output destined for final consumption (o3) to gross output (o5) and provides a fairly clear indication of the system’s main aims. High values of this indicator may be found for farms prevalently orientated to the market and less concerned with re-establishing the fertility characteristics of the soil at the end of each production cycle.
2.2.1.2.2. Indicator of total removal (o4/o5). The information provided by this indicator — obtained as ratio of net output (o4) to total gross output (o5) — integrates and specifies that from the previous
indica-tor. In fact, from the values of the indicator of total
2.2.1.2.3. Indicator of obligatory internal destination [(o1a + o2a)/o5] For this indicator — albeit with reference to output — those considerations made
above regarding theindicator of obligatory re-useare
again valid.
2.2.1.2.4. Indicator of immediate voluntary internal destination (o1b/o5). Just like theindicator of im-mediate voluntary re-useconsidered above, this indi-cator is capable of characterizing the farm from the point of view of the entrepreneur’s interest in follow-ing the path of environmental sustainability; however, it could be sensitive to production results.
2.2.1.2.5. Global indicator of immediate internal des-tination (o1/o5). This represents the complement to one of the indicator of total removal and tells us the total production quota immediately reintroduced into the production cycle.
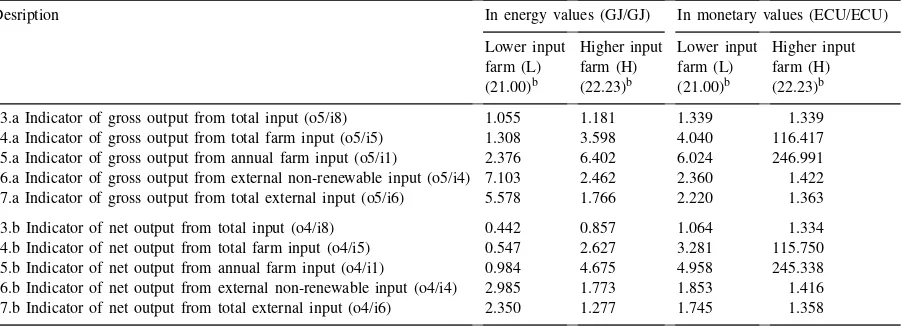
2.2.1.3. Functional indicators. These indicators re-produce some of the simplest and most classical in-dicators of farm efficiency analysis. As such they are obtained as ratios of output values to input values. These indicators can be calculated with reference to both gross output and net output. Just as with struc-tural indicators, functional ones are calculated both in energy and in monetary terms.
2.2.1.3.1. Indicator of gross (net) output from total input (o5/i8; o4/i8). This value is simply the number of GJ of energy (or the ECU) obtained from the pro-duction process (gross or net: o5; o4) per GJ (or ECU), from any source, introduced into the system (i8).
2.2.1.3.2. Indicator of gross (net) output from total farm input (o5/i5; o4/i5). This indicator measures the amount of energy (money) produced by the sys-tem (o5; o4) for every unit of energy (money) which, produced by the system itself, is reintroduced into the production process (I5).
2.2.1.3.3. Indicator of gross (net) output from annual farm input (o5/i1; o4/i1). Differently from the previ-ous indicator, this one measures the output from only that input produced on the farm itself in the course of
the year under examination and immediately reintro-duced into the production cycle (i1).
2.2.1.3.4. Indicator of gross (net) output from external non-renewable input (o5/i4; o4/i4). This is certainly the most important functional indicator from the envi-ronmental point of view. It tells us how much energy (money) has been produced by the system (o5; o4) for every unit of non-renewable energy (money) intro-duced into the system (i4). This indicator may drop below parity: in this case the system has produced less energy (money) than it has irremediably destroyed.
2.2.1.3.5. Indicator of gross (net) output from total ex-ternal input (o5/i6; o4/i6). This indicator measures the productivity of all input from outside the farm, both renewable and not (i6).
2.2.2. Crossed agroecosystem performance indicators
Alongside the direct APIs, calculated in both energy and monetary terms, it is also possible to construct a series of crossed APIs, both by relating output (gross and net) expressed in monetary values to the various kinds of energy input, and by relating energy output (gross and net) to the different kinds of input expressed in monetary values.
In the former case (output in monetary values/input in energy) it is possible to evaluate:
1. the gross (and net) economic productivity of the total energy input;
2. the gross (and net) economic productivity of the energy input from outside the farm;
3. the gross (and net) economic productivity of the non-renewable energy input; and
4. the gross (and net) economic productivity of the energy input produced by agriculture.
This is expressed in GJ/ECU and tells us how much money is produced per unit of energy intro-duced into the production process.
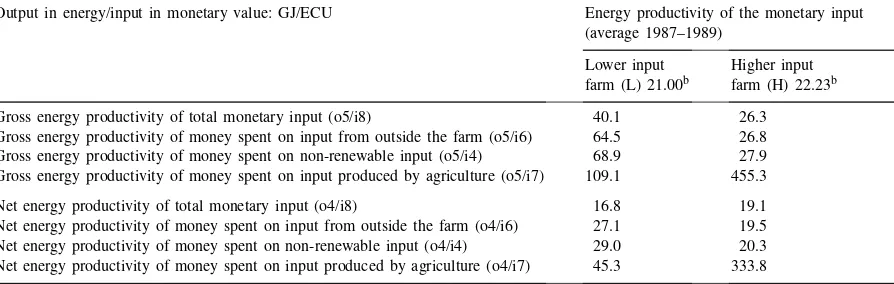
In the latter case (output in energy/input in mon-etary values) it is possible to evaluate:
5. the gross (and net) energy productivity of the total monetary input;
Table 2
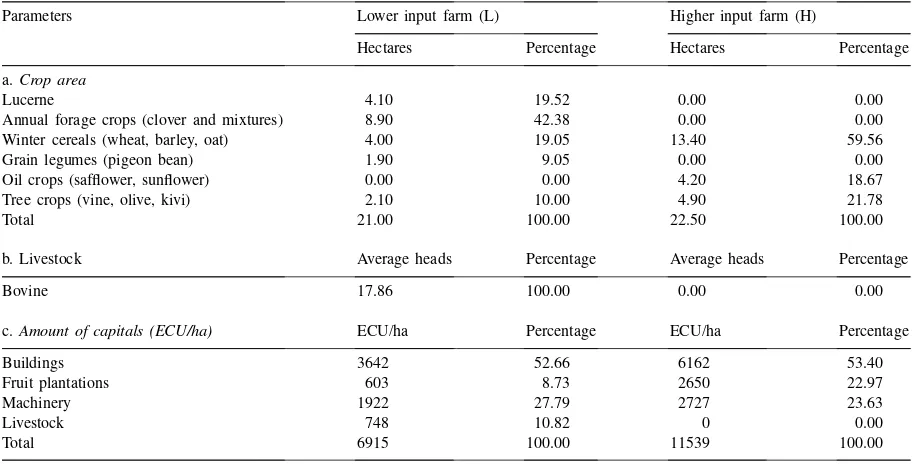
Maremma Park farms: cropping systems and capital amountsa
Parameters Lower input farm (L) Higher input farm (H)
Hectares Percentage Hectares Percentage
a.Crop area
Lucerne 4.10 19.52 0.00 0.00
Annual forage crops (clover and mixtures) 8.90 42.38 0.00 0.00
Winter cereals (wheat, barley, oat) 4.00 19.05 13.40 59.56
Grain legumes (pigeon bean) 1.90 9.05 0.00 0.00
Oil crops (safflower, sunflower) 0.00 0.00 4.20 18.67
Tree crops (vine, olive, kivi) 2.10 10.00 4.90 21.78
Total 21.00 100.00 22.50 100.00
b. Livestock Average heads Percentage Average heads Percentage
Bovine 17.86 100.00 0.00 0.00
c.Amount of capitals (ECU/ha) ECU/ha Percentage ECU/ha Percentage
Buildings 3642 52.66 6162 53.40
Fruit plantations 603 8.73 2650 22.97
Machinery 1922 27.79 2727 23.63
Livestock 748 10.82 0 0.00
Total 6915 100.00 11539 100.00
aSource: direct inquiry.
7. the gross (and net) energy productivity of the money spent on non-renewable input; and 8. the gross (and net) energy productivity of the
money spent on input produced by agriculture. This is expressed in GJ/ECU and tells us how much energy (gross and net) is produced per ECU spent on the acquisition of the various kinds of input.
Clearly these are only some of the APIs that could be proposed, and, once again, each of these ratios can be calculated at both separate sector and whole farm levels.
3. Results of an application of the methodology to two farms in Central Italy
In this section, a comment on the main results ob-tained by the application of the above methodology to two farms in the Maremma Park (on the southern Tus-can coast, in the Province of Grosseto) is provided. The findings date back to the triennium 1987–1989.
Even if the methodology here proposed has still to be perfected and empirically tested on a large number of farms in different environments and management
conditions, it is already capable of yielding indicators of some utility in categorizing farms according to their sustainability.
These are two neighbouring farms, sharing the same pedological and climatic conditions. They are of similar size (21 and 22 ha of cultivated surface area, CSA) but with profoundly different technolog-ical and management styles, which have lasted for more than a decade. One of the farms (farm H) is market-oriented, more specialized and characterized
by higher1 external input, with ‘high environmental
risk’ techniques (monoculture of cereals, exclusive use of chemical fertilizers, etc.). The other (farm L) is characterized by a lower input of external energy, together with cow breeding, a prevalent use of organic fertilizers, and a more varied crop rotation (Table 2).
1Higherthan the other farm. In the same way, the other farm
Maremma Park farms provenance of the input (in energy)a
Provenance of the input Average energy values (1987–1989, GJ/ha)
Lower input farm (B) (21.0)b Higher input farm (A) (22.23)b
i1 Total re-use of current year farm production (internal transfers) 54.7 12.8 i1a obligatory re-use of current year farm production 8.4 5.9 i1b voluntary re-use of current year farm production 46.3 6.8
i2 Total re-use of previous year’s farm production 43.8 9.9 i2a obligatory re-use of previous year’s farm production 12.4 8.2 i2b voluntary re-use of previous year’s farm production 31.5 1.8
i3 External input produced by agriculture 4.3 13.0
i4 External input produced by other sectors (non-renewable) 19.5 32.8
i5 Input produced on the farm (i1 + i2) 98.5 22.7
i6 Input external to the farm (i3 + i4) 23.8 45.9
i7 Input produced by agriculture (i1 + i2 + i3) 102.8 35.7
i8 Total input (i1 + i2 + i3 + i4) 122.3 68.6
aSource: direct inquiry.
bValues in parentheses indicate cultivated surface (ha).
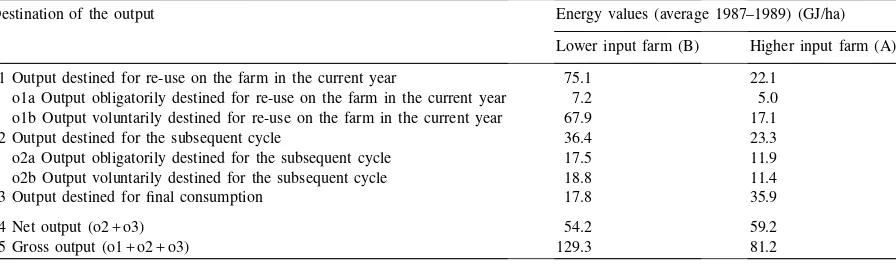
Table 4
Maremma Park farms destination of the output (in energy)a
Destination of the output Energy values (average 1987–1989) (GJ/ha)
Lower input farm (B) Higher input farm (A)
o1 Output destined for re-use on the farm in the current year 75.1 22.1 o1a Output obligatorily destined for re-use on the farm in the current year 7.2 5.0 o1b Output voluntarily destined for re-use on the farm in the current year 67.9 17.1
o2 Output destined for the subsequent cycle 36.4 23.3
o2a Output obligatorily destined for the subsequent cycle 17.5 11.9 o2b Output voluntarily destined for the subsequent cycle 18.8 11.4
o3 Output destined for final consumption 17.8 35.9
o4 Net output (o2 + o3) 54.2 59.2
o5 Gross output (o1 + o2 + o3) 129.3 81.2
aSource: direct inquiry.
It should be emphasized that, unlike farm H, farm L is not run according to criteria aimed at maximizing overall economic results.
In Tables 3, 4, 5 and 6, it is reported, respectively, the energy and monetary profiles of the two farms. Farm L shows a much higher total energy input per hectare of CSA (i8), and higher input from the farm itself (i1 and i2), whereas external input, both renewable (i3) and non-renewable (i4), is much lower. When evaluated in monetary terms, the differences are similar as far as external non-renewable input is concerned, much larger with regard to total re-use of farm production and much smaller for the external input produced by agriculture. This all suggests that the market, i.e., the
most powerful source of action-orientating informa-tion, discourages recycling while rewarding imports from the outside, thus undermining the very basis of agroecosystem sustainability.
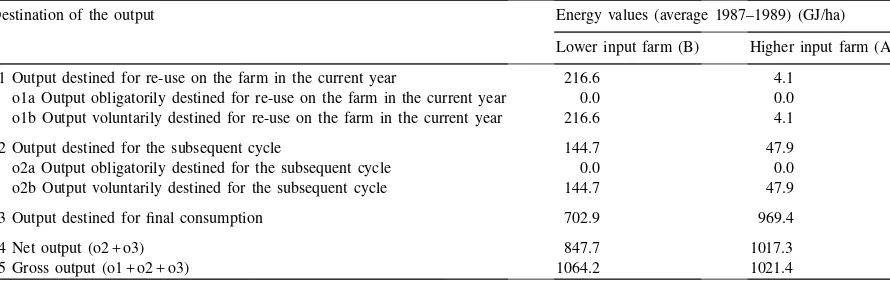
Although the gross output of farm L is notably higher in energy terms (o5), it is not in monetary terms. This is due to the low pricing of the very high quantity of output destined for re-use.
Table 5
Maremma Park farms provenance of the input (in monetary values)a
Provenance of the input Average values (1987–1989) (ECU/ha)
Lower input farm (B) (21.0)b Higher input farm (A) (22.13)b
i1 Total re-use of current year farm production (internal transfers) 205.6 2.6 i1a obligatory re-use of current year farm production 0.0 0.0 i1b voluntary re-use of current year farm production 205.6 2.6
i2 Total re-use of previous year’s farm production 78.9 9.3 i2a obligatory re-use of previous year’s farm production 0.0 0.0 i2b voluntary re-use of previous year’s farm production 78.9 9.3
i3 External input produced by agriculture 30.4 33.0
i4 External input produced by other sectors (non-renewable) 481.0 715.3
i5 Input produced on the farm (i1 + i2) 284.5 11.9
i6 Input external to the farm (i3 + i4) 511.5 748.3
i7 Input produced by agriculture (i1 + i2 + i3) 314.9 44.9
i8 Total input (i1 + i2 + i3 + i4) 796.0 760.2
aSource: direct inquiry.
bValues in parentheses indicate cultivated surface (ha).
Table 6
Maremma Park farms destination of the output (in monetary values)a
Destination of the output Energy values (average 1987–1989) (GJ/ha)
Lower input farm (B) Higher input farm (A)
o1 Output destined for re-use on the farm in the current year 216.6 4.1 o1a Output obligatorily destined for re-use on the farm in the current year 0.0 0.0 o1b Output voluntarily destined for re-use on the farm in the current year 216.6 4.1
o2 Output destined for the subsequent cycle 144.7 47.9
o2a Output obligatorily destined for the subsequent cycle 0.0 0.0 o2b Output voluntarily destined for the subsequent cycle 144.7 47.9
o3 Output destined for final consumption 702.9 969.4
o4 Net output (o2 + o3) 847.7 1017.3
o5 Gross output (o1 + o2 + o3) 1064.2 1021.4
aSource: direct inquiry.
the indicator of dependence on non-renewable energy for farm H is only 1.5 times higher. In other words, the market reduces by one half the distance existing between the two farms in energy terms, thus mini-mizing the crucial role of the agroecosystem pattern of organization.
The indicators of farm autonomy are the mirror im-age of those of dependence: almost 81% for farm L and little >33% for farm H in terms of energy. Here a kind of land ‘buffer mechanism’ can be observed, i.e., an automatic mechanism aimed at guaranteeing that a fairly consistent quota of total output is forcibly kept within the system itself. On both farms the indicator
of obligatory re-use assumes fairly high values, which remain reasonably constant over time. It is interesting to observe that in the farm with higher external input the percentage of input re-used independently of the entrepreneur’s will is, on average (and consistently), higher: almost 21% against 17%. On the other hand, the global indicator of voluntary re-use is decidedly higher for farm L, which chooses to re-use almost two-thirds of total input, as against a bare 13% for farm H.
Maremma Park farms — direct indicators: structural indicatorsa
Description In energy values (GJ/GJ) Monetary values
(Average 1987–1989) (ECU/ECU)
Lower input Higher input Lower input Higher input farm (L) farm (H) farm (L) farm (H) 21.00b 22.23b 21.00b 22.23b 1 Indicator of dependence on non-renewable energy sources (i4/i8) 0.158 0.477 0.601 0.941 2 Indicator of obligatory re-use [(i1a + i2a)/i8] 0.169 0.207 0.000 0.000 3 Indicator of immediate voluntary re-use (i1b/i8) 0.378 0.100 0.261 0.003 4 Indicator of deferred voluntary re-use (i2b/i8) 0.259 0.026 0.100 0.012 5 Global indicator of voluntary re-use [(i1b + i2b)/i8] 0.637 0.126 0.361 0.016
6 Indicator of farm autonomy (i5/i8) 0.806 0.333 0.361 0.016
7 Indicator of overall sustainability (i7/i8) 0.842 0.523 0.399 0.059 8 Indicator of immediate removal (o3/o5) 0.145 0.426 0.662 0.948
9 Indicator of total removal (o4/o5) 0.415 0.708 0.791 0.995
10 Indicator of obligatory internal destination [(o1a + o2a)/o5] 0.186 0.199 0.000 0.000 11 Indicator of immediate voluntary internal destination (o1b/o5) 0.530 0.233 0.209 0.005 12 Global indicator of immediate internal destination (o1/o5) 0.585 0.292 0.209 0.005
aSource: direct inquiry.
bValues in parentheses indicate cultivated surface (ha).
Table 8
Maremma Park farms — direct indicators: functional indicators (average 1987–1989)a
Desription In energy values (GJ/GJ) In monetary values (ECU/ECU)
Lower input Higher input Lower input Higher input farm (L) farm (H) farm (L) farm (H) (21.00)b (22.23)b (21.00)b (22.23)b
13.a Indicator of gross output from total input (o5/i8) 1.055 1.181 1.339 1.339 14.a Indicator of gross output from total farm input (o5/i5) 1.308 3.598 4.040 116.417 15.a Indicator of gross output from annual farm input (o5/i1) 2.376 6.402 6.024 246.991 16.a Indicator of gross output from external non-renewable input (o5/i4) 7.103 2.462 2.360 1.422 17.a Indicator of gross output from total external input (o5/i6) 5.578 1.766 2.220 1.363
13.b Indicator of net output from total input (o4/i8) 0.442 0.857 1.064 1.334 14.b Indicator of net output from total farm input (o4/i5) 0.547 2.627 3.281 115.750 15.b Indicator of net output from annual farm input (o4/i1) 0.984 4.675 4.958 245.338 16.b Indicator of net output from external non-renewable input (o4/i4) 2.985 1.773 1.853 1.416 17.b Indicator of net output from total external input (o4/i6) 2.350 1.277 1.745 1.358
aSource: direct inquiry.
bValues in parentheses indicate cultivated surface (ha).
emphasizing the fact that the market does not suffi-ciently appreciate the flow of energy directed mainly at the soil.
The two farm situations are similarly differentiated as far as output destination is concerned. While farm H shows an indicator of immediate removal of slightly
<43%, farm L removes <15% of total energy, the
remaining 85% being destined for re-use on the farm either during the current cycle (o1) or in future cycles
(o2). Once again, the land’s ‘buffer mechanism’ can be observed, and, once again, it is farm H that shows a higher value of the obligatory internal destination indicator: almost 20% against less than 19%.
Table 9
Maremma Park farms crossed indicators: economic productivity of the energy inputa
Output in monetary value/input in energy: ECU/GJ Economic productivity of the energy input (average 1987–1989)
Lower input Higher input farm (L) 21.00b farm (H) 22.23b
Gross economic productivity of total energy input (o5/i8) 8.8 14.8 Gross economic productivity of energy input from outside the farm (o5/i6) 46.5 22.0 Gross economic productivity of non-renewable energy input (o5/i4) 61.6 30.7 Gross economic productivity of energy input produced by agriculture (o5/i7) 10.4 28.7
Net economic productivity of total energy input (o4/i8) 7.0 14.7 Net economic productivity of energy input from outside the farm (o4/i6) 36.6 21.9 Net economic productivity of non-renewable energy input (o4/i4) 48.3 30.6 Net economic productivity of energy input produced by agriculture (o4/i7) 8.3 28.6
aSource: direct inquiry.
bValues in parentheses indicate cultivated surface (ha).
Table 10
Maremma Park farms crossed indicators: energy productivity of the monetary inputa
Output in energy/input in monetary value: GJ/ECU Energy productivity of the monetary input (average 1987–1989)
Lower input Higher input farm (L) 21.00b farm (H) 22.23b Gross energy productivity of total monetary input (o5/i8) 40.1 26.3
Gross energy productivity of money spent on input from outside the farm (o5/i6) 64.5 26.8 Gross energy productivity of money spent on non-renewable input (o5/i4) 68.9 27.9 Gross energy productivity of money spent on input produced by agriculture (o5/i7) 109.1 455.3
Net energy productivity of total monetary input (o4/i8) 16.8 19.1 Net energy productivity of money spent on input from outside the farm (o4/i6) 27.1 19.5 Net energy productivity of money spent on non-renewable input (o4/i4) 29.0 20.3 Net energy productivity of money spent on input produced by agriculture (o4/i7) 45.3 333.8
aSource: direct inquiry.
bValues in parentheses indicate cultivated surface (ha).
this in terms of both gross (o5) and net (o4) output. Nevertheless, farm L is decidedly more efficient as re-gards both total external input (i6) and non-renewable external input (i4). When measured in monetary terms, this superiority is considerably reduced. Farm L cer-tainly contributes less to the production of goods and services for final consumption, but it provides higher quality energy in the form of animal products. It also consumes much fewer non-renewable resources and exploits them much better, i.e., it is more sustainable. Finally, the crossed indicators are presented (Tables 9 and 10). The farm with lower input of external factors presents a higher net economic pro-ductivity of both external input and non-renewable
input. But the less efficient management of this farm is evidenced by the lower economic productivity, net and gross (i.e., including internal transfers), of both total energy input and energy input from agriculture.
The situation is much the same for energy produc-tivity of monetary input: farm L has higher values for renewable and non-renewable external input, but lower values for both total input and input from agriculture.
4. Conclusions
monetary values appear not to offer a single coher-ent account of the functioning of farming systems. Bio-physical and socio-cultural interpretations of the situation are not yet in agreement. This explains why there is an urgent need to discover an environmental accounting method capable of integrating the eco-logical and economic aspects (Odum, 1996). Indeed, this is a task of paramount importance, given that it is the economic criteria and not bio-physical ones that are now informing and guiding individual and collective behaviour. Since sustainability must have a bio-physical basis, structural and functional APIs cal-culated in terms of energy values are to be considered more meaningful than those in monetary values. In-dicators which stress the self-sufficiency level of the farm, such as the indicator of farm autonomy, and the willingness of the farmer to pursue this goal, such as the indicator of voluntary re-use, should be taken into consideration when establishing economic support policies for farmers. Conversely, taxes or disincen-tives might be imposed according to the magnitude of the indicator of dependence on non-renewable energy. In conclusion, APIs as cognitive elements can play a doubly useful role by
1. helping researchers develop patterns of farming system organization more oriented towards sus-tainability,
2. helping decision-makers develop regulations, in-centives and taxation as practical correctives to direct private operators toward a more appropriate use of natural resources.
Acknowledgements
The methodology presented has been formulated and applied in the course of a research project funded by the Regione Toscana.
References
Azar, C., Holmberg, J., Lindgren, K., 1996. Socio-ecological indicators for sustainability. Ecological Economics 18, 89–112. Caporali, F., Nannipieri, P., Paoletti, M.G., Onnis, A., Tomei, P.E., Tellarini, V., 1989. Concepts to sustain a change in farm performance evaluation. Agriculture, Ecosystem, Environment 27, 579–595.
Draghetti, A., 1948. Principi di fisiologia dell’azienda agraria. Istituto Ed. Agricolo, Bologna, 354 p.
Janssen, B.H., 1984. A simple method for calculating decomposition and accumulation of young soil organic matter. Plant and Soil 76, 297–304.
Leontief, W., 1936. Quantitative Input and Output Relations in the Economic System of the United States. Review of Economic Statistics, 3, vol. 18, Aug.
Lynam, K.J., Herdt, R.W., 1989. Sense and sustainability: sustainability as an objective in international agricultural research. Agricultural Economics 3, 381–398.
Odend’hal, S., 1993. Intermediary agricultural energetics: a case study of solar energy linkage with Chinese working cattle. Agriculture Ecosystem Environment 43, 217–233.
Odum, H.T., 1996. Environmental accounting. John Wiley and sons, New York.
Tellarini, V., Caporali, F., 1992. An Input/Output Model to Analyse Energy and Money Circulation within a Farm. Proced. International Scientific Conference, IFOAM, November 16 to 21, 1992, Sao Paulo, SP/Brazil.
Tisdell, C., 1996. Economic indicators to assess the sustainability of conservation farming projects: an evaluation. Agriculture Ecosystems and Environment 57, 117–131.
Ulanowicz, R.E., 1986. Growth and Development. Ecosystems Phenomenology, Springer-Verlag, New York.
Wagstaff, H., 1987. Husbandry methods and farm systems in industrialized countries which use lower levels of external inputs: a review. Agriculture Ecosystem Environment 19, 1–27. Webster, J.P.G., 1997. Assessing the economic consequences of sustainability in agriculture. Agriculture, Ecosystem, Environment 64, 95–102.
Wolf, J., Janssen, L.H.M., 1991. Effects of changing land use in the Netherlands on net carbon fixation. Neth. J. of Agric. Sci. 39, 237–246.