Vertical Accuracy Assessment of ZY-3 Digital Surface Model using ICESat/GLAS Laser
Altimeter Data
Guoyuan Li a,b,c, *, Xinming Tang a,b,c, Xiaoqi Yuan b,d, Ping Zhou b,c , Fen Hu b,c a
Resource and Environmental Sciences, Wuhan University, Wuhan,430079, China - (ligy, txm)@sasmac.cn, b Satellite Surveying and Mapping Application Center, NASG, Beijing,100048,China - (zhoup,huf) @sasmac.cn, c
Jiangsu Center for Collaborative Innovation in Geographical Information Resource Development and Application, Nanjing, 210023, China,
d
Changchun University of Science and Technology,Changchun,130022,China - [email protected]
HRIGI17, WG I/9
KEY WORDS: accuracy assessment, ZY-3 stereo images, DSM, ICESat/GLAS
ABSTRACT:
The Ziyuan-3 (ZY-3) satellite, as the first civilian high resolution surveying and mapping satellite in China, has a very important role in national 1:50,000 stereo mapping project. High accuracy digital surface Model (DSMs) can be generated from the three line-array images of ZY-3, and ZY-3 DSMs of China can be produced without using any ground control points (GCPs) by selecting SRTM (Shuttle Radar Topography Mission) and ICESat/GLAS (Ice, Cloud, and land Elevation Satellite, Geo-science Laser Altimeter System) as the datum reference in the Satellite Surveying and Mapping Application Center, which is the key institute that manages and distributes ZY-3 products. To conduct the vertical accuracy evaluation of ZY-3 DSMs of China, three representative regions were chosen and the results were compared to ICESat/GLAS data. The experimental results demonstrated that the root mean square error (RMSE) elevation accuracy of the ZY-3 DSMs was better than 5.0 m, and it even reached to less than 2.5 m in the second region of eastern China. While this work presents preliminary results, it is an important reference for expanding the application of ZY-3 satellite imagery to widespread regions. And the satellite laser altimetry data can be used as referenced data for wide-area DSM evaluation.
*
Corresponding author: [email protected] 1. INTRODUCTION
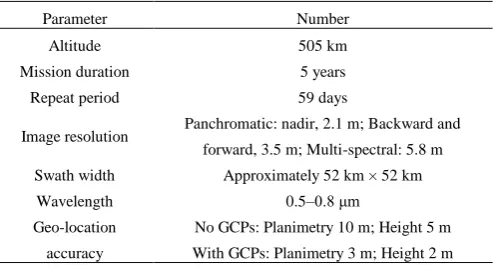
Digital surface model (DSMs) plays a very important role in many fields including hydrology, disaster monitoring, terrain analysis, and so forth. The Ziyuan-3 (ZY-3) satellite is the first civilian surveying and mapping stereo satellite of China, and it was launched on 9 Jan. 2012. The ZY-3 has three line-array panchromatic CCD (charge coupled device) cameras and a multi-spectral camera, and the following geometric resolutions are panchromatic: 2.1 m for nadir, 3.5 m for backward and forward, and 5.8 m for multi-spectral modes. Detailed information about ZY-3 is presented in Table 1. The main objective of ZY-3 is to obtain high resolution stereo images and generate national 1:50,000 digital elevation models (DEMs) and digital ortho maps (DOMs). The ZY-3 DSMs of China are derived from ZY-3 stereo images without ground control points (GCPs) and cover the entire country with a 15 m interval grid; WGS84+EGM96 is used as height reference datum. The accuracy, especially the vertical accuracy of China’s ZY-3 DSMs, is crucial for the use of the DSMs in various applications, and such knowledge needs to be disseminated rapidly to meet the demands for such products. In this letter, the preliminary vertical accuracy in three regions was evaluated by comparing the results to select GLAS (Geo-science Laser Altimeter System) data loaded into the ICESat (Ice, Cloud, and land Elevation Satellite) dataset and some high accuracy GCPs; ICESat was launched in 2003 and ended its mission in 2009, and during this time, it obtained global high accuracy height data spaced at 170 m along the tracks and 5–185 km across the tracks (Schutz, B.E,et al ,2005; Wang, X.et al,2011; Zwally, H.J.,et al,2002).
Table 1. The basic parameters of the ZY-3 satellite (Tang, X. et al, 2012; Li, 2012)
Parameter Number
Altitude 505 km
Mission duration 5 years
Repeat period 59 days
Image resolution Panchromatic: nadir, 2.1 m; Backward and
forward, 3.5 m; Multi-spectral: 5.8 m
Swath width Approximately 52 km × 52 km
Wavelength 0.5–0.8 μm
Geo-location
accuracy
No GCPs: Planimetry 10 m; Height 5 m
With GCPs: Planimetry 3 m; Height 2 m
GCP, ground control points.
Li (2012) and Tang et al. (2012) performed some geometric accuracy assessments during the ZY-3 on-orbit testing period and the preliminary results were attractive. Wang et al. (2014) implemented systematic geo-location validation studies of ZY-3 data and the results validated that ZY-3 can obtain planimetric and vertical accuracy values of 10 m and 5m without GCPs, respectively. d'Angelo (2013) evaluated the performance of ZY-3 during DSM and ortho-photo generation on two scenes east of Munich and the overall root mean square error (RMSE) between the ZY-3 DSM and LIDAR (Light Detection and Ranging) reference products was found to be 2.0 m. Tang et al.(2015) evaluated the overall vertical RMSE of DSMs produced without GCPs in the Shanxi Province of northern China and derived an overall value of 5.56 m; flat terrain was associated with a smaller RMSE (4.37 m) than mountainous
terrain (5.69 m). Reinartz(2006) evaluated the DSM derived from the application of dense image matching to SPOT HRS (Satellite Pour l’Observation de la Terre High Resolution Stereoscopic) stereo data by comparing it to a superior referenced DEM and the height accuracy was found to be approximately 5–10 m.
What’s more, the ICESat/GLAS data was used as control or reference dataset for DSM generation and accuracy evaluation. Wang et al. (2011) reviewed the geo-science applications of ICESat/GLAS data. Harding et al. (1999) evaluated the GTOPO30 by using SLA (Shuttle Laser Altimeter) data. Huber et al. (2009) used GLAS data to ensure the TanDEM-X height accuracy. Gonzalez et al. (2010) selected ICESat data according to multi-criteria as height references for TanDEM-X global DEM calibration and systematic error elimination. Du et al. (2013) assessed the vertical accuracy of SRTM (Shuttle Radar Topography Mission) and ASTER GDEM (Advanced Spacborne Thermal Emission and Reflection Radiometer Global Digital Elevation Map) products by using ICESat/GLAS data in typical regions of China. Arefi and Reinartz (2011) used ICESat laser altimetry to correct the systematic height errors of ASTER global digital elevation models and obtained significant improvements. Li et al. (2016a, 2016b) improved the ZY-3 height accuracy by using the ICESat/GLAS data as reference data. Tadono et al. (2016) implemented the SRTM and GLAS data as control data to generate the 30m mesh global DSM of ALOS Prism. Santillan et al. (2016) evaluated the accuracy of 30m ALOS DSM production using GCPs and GLAS data after selection, which is just the similar work of this paper but for ZY3-DSM.
In this paper, ICESat/GLAS data were selected for use as a vertical reference to evaluate the ZY-3 DSMs in three key areas of China. The DSMs were generated from the three line-array images and by viewing SRTM as datum without any GCPs. Weinan contains mountainous terrain, whereas Lianyungang and Tianjin contain flat terrain. In Section 2, the method is introduced, and then, the experimental data and results are presented in Section 3. The conclusions are given in Section 4. The results for the ZY-3 DSMs described in this letter were better than 5.0 m compared with GLAS data that were selected by applying specific criteria. And the GLAS laser altimetry data can be used to evaluate the wide-area DSM.
2. METHODS 2.1 ZY-3 DSM Generation without GCPs
Many algorithms for deriving DSMs from satellite images with dense matching have been presented(Reinartz, P.et al ,2006;Alobeid, A.et al, 2010; Hobi, M.L.et al, 2012;Baltsavias, E. et al, 2008;)Here, the ZY-3 DSMs were derived from ZY-3 stereo image data by use of the PixelGrid V5.0 workstation, which implemented the MPGC (multi-image geometrically constrained matching) algorithm(Zhang, L,et al,2004; Zhang, L.,et al ,2006) .
Before the stereo image matching, freedom adjustment was performed with the affined parameters to compensate for the rational polynomial coefficients (RPCs). The ZY-3 images were processed with the conventional Rational Function Model (RFM) to describe the relation between the image point coordinates (c, r) and the ground point coordinates (X,Y,H), which can be expressed as follows:
coordinates and corresponding normalized object space coordinates, respectively. p1ijk , p2ijk , p3ijk , and p4ijk are the
polynomial coefficients, and the total number was 80. The normalized coordinates are expressed as follows:
0 0 The Seven-Parameter Transform Model based on SRTM-DEM as a reference was introduced to evaluate the ZY-3 DSMs; this eliminated the coordinate systematic deviation. The transform model is as follows:
•
V
,U are the pre and after transformation coordinate vectors. So, the seven parameters are (
, , , , , ,
t t tx y z
), which can between the return pulse width and the diverse angle of the laser, the altitude of the satellite, etc., is described by Eq.(6) (Gardner, C.S. et al, 1992). Then,mcan be constrained to smaller than the threshold value to select a GLAS point as a vertical controlpoint.
transmitted pulse width, his the stretched part of the waveform caused by hardware equipment, is the diverse angle of the laser,
c
is the velocity of light, and S is the slope of the surface. In this paper, the threshold of mis determined as 3.2ns and only one peak to select the GLAS point better than 1.0m.The detail selection is introduced in multi-constraint strategy method (Li et al,2017) .The SRTM data are distributed as orthometric elevations with respect to the World Geodetic System WGS84, and the Earth Gravity Model EMG96(Lemoine, F.,et al, 1998) was used to convert from ellipsoidal elevations. So, the vertical data of the ZY-3 DSM products generated based on SRTM are the WGS84+EGM96 results, while ICESat GLA14 data contain elevations with respect to the TOPEX/Poseidon Jason ellipsoid (Schutz, B.E., et al, 2005). In order to make comparisons with the ZY-3 DSMs, the ICESat footprint elevations were converted to WGS84 ellipsoid data and then to orthometric elevations by using the EGM96 geoid values interpolated according to the footprint location. Eq. (7) describes the conversion from TOPEX/Poseidon to the WGS84 ellipsoid (Li, J.; Fan, C., et al, 2008): where B is the latitude and da, db are the deviation of WGS84 and TOPEX/Poseidon along the major axis and semi-minor axis, respectively. dh is the revised value for height; HW and HT are the height values of WGS84 and TOPEX/Poseidon, respectively.
2.3 Vertical Accuracy Evaluation Method
In order to evaluate the vertical accuracy, we applied four kinds of parameters; these included the height difference mean value (MH ), standard deviation (STDH ), and root mean square
error ( RMSEH ), which are illustrated in Eq.(8), and the
absolute linear error at the 90% confidence level (LE90). The LE90 was calculated empirically by determining the elevation difference at which 90% of the data point pairs evaluated fell
Bi-linear interpolations were performed to locate the ICESat/GLAS laser footprint points on the given ZY-3 DSMs of China according to the latitude and longitude, and the elevation values HGLASi and HDSMi were used to evaluate the accuracy.
3. EXPERIMENTAL DATA AND RESULTS 3.1 Experimental Data
In order to evaluate the vertical accuracy of the ZY-3 DSMs, three regional experimental datasets from western China, eastern China, and northern China representing different terrain were implemented; the locations of the three ZY-3 experimental datasets were as follows: (1) 112.15°–112.85° E and 37.82°– 38.65° N, (2) 116.78°–117.83° E and 34.80°–39.41° N, and (3) 118.95°–119.71° E and 34.35°–34.95° N, respectively (cf. Figure2.(a), Figure3.(a), Figure4.(a)). The terrain height in the first region ranged from 706.7 m to 2414.6 m, that in the second region ranged from 1.4 m to 618.2 m, and that in the third region ranged from 1.3 m to 141.1 m; the names of these regions are Weinan, Lianyungang, and Tianjin, respectively. The DSMs were generated from ZY-3 three line-array images without any GCPs but were referenced to SRTM-DEM data, and the interval was interpolated to 15 m with reference to WGS84+EGM96 as height datum. The ICESat/GLAS data were derived from GLA14 products collected between 2003 to 2009 according to the selection criteria described in Subsection2.2 .In order to ensure the elevation accuracy of selected GLAS points, the criterion of the fitting standard deviation in Eq. (6) was fixed as 3.2 ns, and thus, the results for GLAS points will be better than 1.0 m theoretically in the vertical direction.
Moreover, in order to evaluate and highlight the high elevation accuracy of selected GLAS points, some airborne LIDAR data in Taiyuan were implemented as a reference dataset. The absolute vertical accuracy of the LIDAR cloud points was better than 0.15 m. The LIDAR cloud points located in the footprint of GLAS were collected, and the deviation between GLAS results and the average elevations was calculated.
3.2 Experimental Results deviation distribution is illustrated in Table 2. These results prove that the footprint of GLAS after selection by certain criteria has a very high elevation accuracy, and thus, it can serve as a suitable reference to evaluate the accuracy of the ZY-3 DSM dataset.
Table 2. Statistical results for the deviation between GLAS and LIDAR average elevations. Figure 2(b), Figure 3(b)). The histograms describe the elevation difference in statistical numbers that detail how many points were situated in the various locations, and these data again
illustrate that the GLAS points after selection by the criteria can be viewed as the elevation reference dataset; then, we calculated the elevation difference for points derived from the ZY-3 DSM according to the GLAS point geo-locations.
In the first experimental region, which is Weinan, there were 3936 GLAS points in total, but only 1446 points were reserved
as elevation references after applying the selection criteria; the distribution is shown in Figure 1(a). The number of total GLAS points and reserved points used in Lianyungang and Tianjin were 4188 and 3094, and 4183 and 3099, respectively.
Height (meter)
GLAS Point
East (degree) North (degree)
112.0 112.2 112.4 112.6 112.8
37.8 38.2 38.6
38.0 38.4
Unit:meter Unit:Count
s
H
Figure 1. (a) Geo-location illustration of the ZY-3 DSM dataset and GLAS points in Weinan, western China; (b) statistical histogram of the differences in height between the two datasets.
Height (meter) GLAS
Point
East (degree) North (degree)
119.0 119.2 119.4 119.6
34.35 34.55
34.45 34.65 34.85
34.75 34.95
Unit:meter
Unit:Counts
Figure 2. (a) Geo-location illustration of the ZY-3 DSM dataset and GLAS points in Lianyungang, eastern China; (b) statistical histogram of the differences in height between the two datasets.
GLAS Point
East (degree) North (degree)
116.8 117.0 117.2 117.4 34.80
34.10
34.95 34.25 39.40
Height (meter)
117.6 117.8
count
meter
Figure 3. (a) Geo-location illustration of the ZY-3 DSM dataset and GLAS points in Tianjin, northern China; (b) statistical histogram of the differences in height between the two datasets.
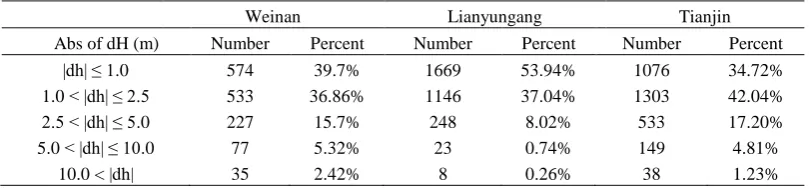
Table 3. Statistical results for the elevation differences in the three experimental regions.
Weinan Lianyungang Tianjin
Mean error, MH -0.66 -0.66 -0.28
Standard deviation, STDH 4.09 1.74 2.91
Root mean square error, RMSEH 4.15 1.74 2.93
LE90 5.39 2.29 3.83
(Unit: meter)
Table 4. Segmentation point numbers for elevation differences in the three experimental regions.
Weinan Lianyungang Tianjin
Abs of dH (m) Number Percent Number Percent Number Percent
|dh| ≤ 1.0 574 39.7% 1669 53.94% 1076 34.72%
1.0 < |dh| ≤ 2.5 533 36.86% 1146 37.04% 1303 42.04% 2.5 < |dh| ≤ 5.0 227 15.7% 248 8.02% 533 17.20%
5.0 < |dh| ≤ 10.0 77 5.32% 23 0.74% 149 4.81%
10.0 < |dh| 35 2.42% 8 0.26% 38 1.23%
4. CONCLUSIONS
A comparison between ZY-3 DSM (digital surface model) and ICESat/GLAS data for three key experimental regions in China was performed in this letter. The GLAS points were chosen by certain selection criteria, which defined the GLAS return waveform with only one peak and a 3.2 ns narrow pulse width. Over 80% of the chosen GLAS points showed that the elevation accuracy was better than 1.0 m, according to the comparison with LIDAR points in the Taiyuan experimental region. Compared with GLAS points, the evaluation results indicated that the elevation accuracy of the ZY-3 DSMs was better than 5.0 m (cf. Table3). In the Weinan experimental region, the standard deviation and root mean square error of the elevation difference was approximately 4.09 m and 4.15 m, respectively, while the LE90 was 5.39 m. In the Lianyungang and Tianjin experimental regions, which represent flat terrain, the results were better than those in Weinan, which contains mountainous terrain. Therefore, the new findings support the application of ZY-3 DSMs in these three regions and in similar terrain. Additionally, as shown in Figure1.(b), Figure2.(b), Figure3.(b), and Table 4, it is clear that there were still a few points whose elevation difference was worse than 5.0 m, even worse than 10.0 m. The reason for these unusual findings may have involved terrain change; notably, the GLAS points were collected during 2003 to 2009, while ZY-3 was launched in Jan. 2012. Lastly, the criteria for GLAS point selection may need improvement. All of these issues would be fruitful areas for further research. But it is valuable that the conclusion of this paper offer the accuracy result of ZY3-DSM for further application and a way to evaluate the wide-area DSM without other referenced data.
ACKNOWLEDGEMENTS
This work was supported the National Science Foundation for Young Scientists of China (Grant No. 41601505) and the National Fund for Basic Surveying and Mapping (Grant No. 2017KJ0204). The authors also thank the National Snow and Ice Data Center (NSIDC) for providing the GLAS data and anonymous reviews for their constructive comments and suggestions.
REFERENCES
Alobeid, A., Jacobsen, K., Heipke, C., 2010. Comparison of matching algorithms for DSM generation in urban areas from Ikonos imagery. Photogramm. Eng. Remote Sens. 76(9), 1041– 1050.
Arefi, H., Reinartz, P., 2011. Accuracy enhancement of ASTER global digital elevation models using ICESat data. Remote Sens.
3(7), 1323–1343.
Baltsavias, E., Kocaman, S., Wolff, K., 2008. Analysis of Cartosat-1 images regarding image quality, 3D point measurement and DSM generation. Photogramm. Record.
23(123), 305–322.
d’Angelo, 2013. Evaluation of ZY-3 for DSM and ortho image generation. ISPRS Int. Arch. Photogramm. Remote Sens.
Spatial Inf. Sci. XL-1/W1, 57–61.
Du, X., Guo, H., Fan, X., et al, 2013. Vertical accuracy assessment of SRTM and ASTER GDEM over typical regions of China using ICESat/GLAS. Earth Science-J. China Univ.
Geosci. 2013, 38(4), 887–897, DOI:10.3799/dqkx.2013.087.
Gardner, C., 1992. Ranging performance of satellite laser altimeters. IEEE Trans. Geosci. Remote Sens. 30(5), 1061–1072.
Gonzalez, J.H., Bachmann, M., Scheiber, R., et al, 2010. Definition of ICESat selection criteria for their use as height references for TanDEM-X. IEEE Trans. Geosci. Remote Sens.
48(6), 2750–2757.
Gruen, A., Akca, D., 2004. Least squares 3D surface and curve matching. ISPRS Int. Arch. Photogramm. Remote Sens. Spatial Inf. Sci. 59, 151–174.
Harding, D., Gesch, D., Carabajal, C., et al, 1999. Application of the Shuttle Laser Altimeter in an accuracy assessment of GTOPO30, a global 1-kilometer Digital Elevation Model.
ISPRS Archives 1999, XXXII-3/W14.
Hobi, M., Ginzler, C., 2012. Accuracy assessment of digital surface models based on WorldView-2 and ADS80 stereo remote sensing data. Sensors. 12(5), 6347–6368.
Huber, M., Wessel, B., Kosmann, D., et al, 2009. Ensuring globally the TanDEM-X height accuracy: Analysis of the reference datasets ICESat, SRTM, and KGPS-Tracks. In:
Proceedings of IGARSS 2009, Cape Town, South Africa, 2009,
in print.
Lemoine, F., Kenyon, S., Factor, J., et al, 1998. The development of the Joint NASA GSFC and the National Imagery and Mapping Agency (NIMA) Geopotential Model EGM96, NASA Tech. Pap., TP–1998-206861, 575 pp.
Li, D. 2012. China’s first civilian three-line-array stereo mapping satellite: ZY-3. Acta Geodaetica et Cartographica
Sinica. 41(3), 317–322.
Li, G., Tang, X., Gao, X., et al, 2016a. ZY-3 Block Adjustment Supported by GLAS Laser Altimetry Data. The
Photogrammetric Record, 31(153): 88-107. DOI:
10.1111/phor.12138.
Li, G., Tang, X., Gao, X., et al, 2016b. Improve the ZY-3 Height Accuracy Using ICESat/GLAS Laser Altimeter Data [J].
International Archives of the Photogrammetry Remote Sensing & S, XLI-B1:37-42.
Li, G., Tang, X., Zhang, C., et al, 2017. Multi-criteria constraint algorithm for selecting ICESat/GLAS data as elevation control points. Journal of Remote Sensing, 21 (1):1993-2002.
Reinartz, P., Müller, R., Lehner, M., et al, 2006. Accuracy analysis for DSM and orthoimages derived from SPOT HRS stereo data using direct geo-referencing. ISPRS J. Photogramm.
Remote Sens. 2006, 60(3), 160–169.
Schutz, B., Zwally, H., Shuman, C., et al, 2005. Overview of the ICESat Mission. Geophys. Res. Lett. 32(21), 97–116.
Santillan,J., Makinanosantillan, M.,2016. Vertical Accuracy Assessment of 30-M Resolution Alos, Aster, and Srtm Global Dems Over Northeastern Mindanao, Philippines. ISPRS - International Archives of the Photogrammetry, Remote Sensing
and Spatial Information Sciences, XLI-B4:149-156.
Tadono, T., Nagai, H., Ishida, H., et al, 2016. Generation of the 30m-Mesh Global Digital Surface Model by Alos Prism. ISPRS -International Archives of the Photogrammetry, Remote
Sensing and Spatial Information Sciences, XLI-B4:157-162.
Tang, X., Zhang, G., Zhu X., et al, 2012. Triple linear-array image geometry model of Ziyuan-3 surveying satellite and its validation. Acta Geodaetica et Cartographica Sinica. 41(3), 191–198.
Tang, X., Zhou, P., Zhang, G., et al, 2015. Verification of ZY-3 satellite imagery geometric accuracy without ground control points. IEEE Geosci. Remote Sens. Lett. 12(10), 2100–2105.
Wang, T., Zhang, G., Li, D., et al. 2014. Geometric accuracy validation for ZY-3 satellite imagery. IEEE Geosci. Remote
Sens. Lett. 11(6), 1168–1171.
Wang, X., Cheng, X., Gong, P., et al, 2011. Earth science applications of ICESat/GLAS: a review. Int. J. Remote Sens.
32(23), 8837–8864.
Zhang, L., Gruen, A., 2004. Automatic DSM generation from linear array imagery data. ISPRS Int. Arch. Photogramm.
Remote Sens. Spatial Inf. Sci. 35 (Part B3), 128–133.
Zhang, L., Gruen, A., 2006. Multi-image matching for DSM generation from IKONOS imagery. ISPRS Journal of
Photogrammetry and Remote Sens. 60(3), 195–211.
Zwally, H.J., Schutz, B., Abdalati W., et al. 2002. ICESat’s laser measurements of polar ice, atmosphere, ocean, and land.
J. Geodynamics. 34, 405–445.
Revised March 2017