WETLAND VEGETATION INTEGRITY ASSESSMENT WITH LOW ALTITUDE
MULTISPECTRAL UAV IMAGERY
* M. A. Boon ab*, S. Tesfamichael c
a
Department of Zoology University of Johannesburg, PO Box 524 Auckland Park, 2006, South Africa. b
Kite Aerial Imagery (Pty) Ltd, 1422 Topaas Street, Waverley, 0186, South Africa - [email protected] c
Department of Geography, Environmental Management and Energy Studies University of Johannesburg, PO Box 524 Auckland Park, 2006, South Africa - [email protected]
Commission VI, WG VI/4
KEY WORDS: multispectral imagery, wetlands, vegetation, UAV, Structure-from-motion, NDVI.
ABSTRACT:
The use of multispectral sensors on Unmanned Aerial Vehicles (UAVs) was until recently too heavy and bulky although this changed in recent times and they are now commercially available. The focus on the usage of these sensors is mostly directed towards the agricultural sector where the focus is on precision farming. Applications of these sensors for mapping of wetland ecosystems are rare. Here, we evaluate the performance of low altitude multispectral UAV imagery to determine the state of wetland vegetation in a localised spatial area. Specifically, NDVI derived from multispectral UAV imagery was used to inform the determination of the integrity of the wetland vegetation. Furthermore, we tested different software applications for the processing of the imagery. The advantages and disadvantages we experienced of these applications are also shortly presented in this paper.
A JAG-M fixed-wing imaging system equipped with a MicaScene RedEdge multispectral camera were utilised for the survey. A single surveying campaign was undertaken in early autumn of a 17 ha study area at the Kameelzynkraal farm, Gauteng Province, South Africa. Structure-from-motion photogrammetry software was used to reconstruct the camera position’s and terrain features to derive a high resolution orthoretified mosaic. MicaSense Atlas cloud-based data platform, Pix4D and PhotoScan were utilised for the processing. The WET-Health level one methodology was followed for the vegetation assessment, where wetland health is a measure
of the deviation of a wetland’s structure and function from its natural reference condition. An on-site evaluation of the vegetation integrity was first completed. Disturbance classes were then mapped using the high resolution multispectral orthoimages and NDVI. The WET-Health vegetation module completed with the aid of the multispectral UAV products indicated that the vegetation of the
wetland is largely modified (“D” PES Category) and that the condition is expected to deteriorate (change score) in the future. However a lower impact score were determined utilising the multispectral UAV imagery and NDVI. The result is a more accurate estimation of the impacts in the wetland.
1. INTRODUCTION
The use of UAV multispectral imagery for precision farming applications is recently receiving a lot of attention (Nebiker et al., 2016). This technology is used in agricultural planning for example to define management zones and create precise variable rate application maps. In a similar way, this technology has the potential to aid in the determination of the health (integrity) status of a wetland, define management zones within the wetland and to perform precision monitoring of changes within these ecosystems.
Adam et al. (2010) compiled a review on multispectral and hyperspectral remote sensing for the identification and mapping of wetland vegetation. They indicated that remote sensing of wetland vegetation has particular challenges. Key limitations included low spatial, spectral and temporal resolutions from commonly used digital multispectral imagery. These problems are however being addressed in recent years. UAV photogrammetry, for example, can provide centimeter-level spatial resolution. UAV multispectral sensors can discriminate
spectral reflectance which is specifically important when one needs to indicate vegetation health (Colmina and Molina, 2014). Marcaccio et al. (2015) demonstrated that this technology provide the opportunity for researchers to easily obtain seasonally-relevant imagery themselves instead of using out-of-date commercial imagery.
Recent wetland related studies where UAV technologies were applied for vegetation related purposes ranged from the characterisation of upland swamps using object based classification methods (Lechner et al., 2012) to the delineation of fine-scale vegetation communities (Zweig et al., 2015). Husson et al. (2016) demonstrated the feasibility of extracting ecologically relevant information on non-submerged aquatic vegetation from UAV-orthoimages in an automated way. Limited research has however been undertaken specifically using multispectral imagery acquired from an UAV for wetland and wetland vegetation studies. The AggieAir autonomous aerial remote sensing platform that has been developed at the Utah State University was for example applied for riparian and wetland applications (Jensen et al., 2011).
This same platform was also used to quantify the spread of an invasive wetland specie (Zaman et al., 2011).
In previous studies we showed that UAV derived RGB imagery can inter alia significantly enhance wetland vegetation assessment through the extraction of relevant information from these imagery (Boon et al., 2016a). In this study we focused on wetland vegetation integrity assessment (WET-Health) using specifically multispectral UAV imagery.
1.1 Aim
The aim of this study was to evaluate the performance of high spatial resolution multispectral UAV imagery for enhancement of the WET-Health (Macfarlane et al., 2009) assessment of vegetation. In order to inform the determination of the integrity of the wetland vegetation we also computed the NDVI from the UAV multispectral imagery. The idea of the study is to work towards a more accurate estimation and prediction of impacts that is practical, standardised and repeatable to ensure better and more sustainable outcomes. Furthermore, we tested different software applications for the processing of the multispectral imagery. The advantages and disadvantages we experienced of these applications are also briefly presented in this paper.
2. STUDY AREA
The channelled valley-bottom wetland (Figure 1) is located on the Kameelzynkraal farm to the east of Pretoria in the Kungwini Local Municipal area, Gauteng Province, South Africa. The size of the study area is 17 ha although the actual UAV survey area included an area of approximately 50 ha. Large sections of the study area was transformed from its original benchmark condition.
Figure 1. The Cors-Air study area to the east of Pretoria, Gauteng Province.
3. MATERIALS AND METHODS
The methodology can be divided into four phases briefly discussed in sections 3.1 to 3.3.
3.1 On site preparation, UAV system and flight planning
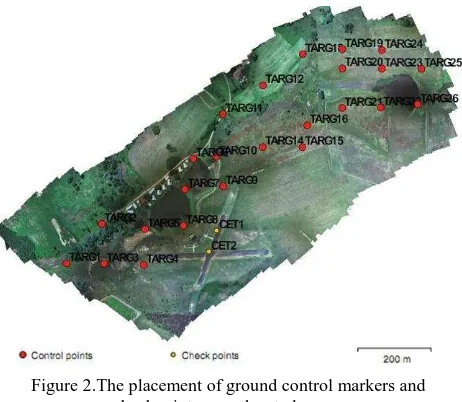
Ground control points (GCPs) were positioned in a grid formation where possible. Where vegetation would hinder accurate GCP identification and wetland areas make the actual placement difficult the placement was made in the best position in close proximity. A total of 26 GCPs were placed (Figure 2) using a Trimble (SPS882 GNSS GPS) survey system. Two check points (CPs) that comprised of fixed land marks within the study area were further identified for verification of the positional and height accuracy of the derived UAV data. A JAG-M fixed-wing UAV (Figure 3 and Table 1) were utilised for the collection of the images. A MicaSense RedEdgeTM multispectral camera was used for the collection of the images. The camera simultaneously captures five discrete spectral bands: Blue, green, red, red edge, near IR (narrowband).
Figure 2.The placement of ground control markers and checkpoints over the study area.
Table 2 presents specifications of the sensor used for the survey. The UAV flight lines were calculated with Mission Planner software, and were spaced 26.1 m apart which equated to a 70% forward overlap and a 70% side overlap utilising the MicaSense camera. The flying altitude determined for the UAV survey was 100 m above ground level (AGL).
Figure 3. The JAG-M fixed-wing UAV.
UAV type fixed-wing Aircraft weight: 3.7 kg Aircraft
dimensions
180 cm wingspan, 130 cm length
Flight time 75 min
3.2 Data acquisition and processing
The multispectral UAV images were collected in the middle of the day in the early autumn of 2017. One flight of approximately 28 minutes were carried out acquiring 3815 images. The reflectance values of the different spectral bands (channels) was calibrated using the RedEdge calibration panels. Panel images taken before and after the flight were used to compensate for the lighting conditions at the time of image capture. This provided an accurate representation of the amount of light reaching the ground at the time of image acquisition.
Structure-from-motion photogrammetry software was used to
reconstruct the camera position’s and terrain features to derive a
high resolution orthoretified mosaic. The images (including the reflective panel calibration images) were uploaded onto the ATLAS (AS) cloud platform for processing. Each layer is registered at the sub-pixel level, with the value for each pixel indicative of percent reflectance for that band. AS transformed the raw images into a 5-band georeferenced orthomosaic image. Pix4D (PD) Mapper professional and Agisoft PhotoScan (PS) professional were additionally used to process the images and to derive an orthomosaic. The GCPs and CPs were imported into both PD and PS to achieve geometrical precision and georeferencing accuracy. The AS cloud platform did not include this functionality. The images of the radiometric calibration panels were also used in PD to correct the image reflectance, taking the illumination and sensor influence into consideration. At the time of the study, PS did not support radiometric calibration using reflectance panels. The Normalized Difference Vegetation Index NDVI [NDVI= (NIR-R) / (NIR+R)] was then calculated from the AS, PD and PS datasets. The results were saved as raster (GeoTIFF) and vector (shape) formats where applicable.
3.3 Analysis, data classification and interpretation
This step of the methodology included analysis, interpretation and extraction of necessary attributes from the orthomosaics. This was achieved through a combination of visual analysis and empirical computation of the UAV orthomosaics including extraction of information from the NDVI calculations. The result of the calculation of NDVI index is a dimensionless value that falls between -1 and 1. Interpretations were made based on actual field evaluation knowledge.
The level one “WET-Health” methodology was used to assess the vegetation integrity of the wetland unit, where health is a
measure of the deviation of a wetland’s structure and function
from its natural reference condition (Macfarlane et al., 2009) or changes in vegetation composition and structure due to site transformation or disturbance. The level one assessment is a rapid assessment used in situations where limited time and/or resources are available. Table 3 shows the WET-Health disturbance classes (activities taking place within the wetland) that have an impact on wetland vegetation that were assessed for both the rapid on-site evaluation of vegetation and the UAV multispectral NDVI vegetation assessment.
Vegetation Disturbance Classes Intensity 1. Identify and estimate the extent of each
disturbance class in the wetland
Infrastructure 10
Deep flooding by dams 10
Shallow flooding by dams 6
Crop lands 9
Annual pastures 9
Dense alien vegetation patches. 7
Areas of Infilling and sediment deposition 8
Eroded areas 7
Minimal human disturbance 1
2. Assess the intensity and magnitude (extent / 100 * intensity of impact. for each disturbance class)
Table 3. Vegetation disturbance classes
4. RESULTS AND DISCUSSION
4.1 Data quality
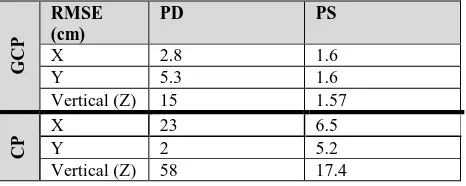
The results of the root mean squared error (RMSE) of the data based on the 24 GCPs and the two CPs are presented in Table 4. The accurate identification of the landmark CPs was problematic as indicated by the high RMSE values. The ground spatial resolution obtained for the different datasets ranged from 0.0682 m to 0.0752 m.
Table 4. RMSE in cm for the ground control and check points.
The results of the computation of the NDVI reflectance values were similar for AS and PD although there was a major difference compared to the PS values. The PS values was much lower (Table 5). The mean value for PS dataset was only 0.159 compared to 0.603 (AS) and 0.605 (PD). This can be ascribed to the fact that PS did not have the option to correct the image reflectance. Figure 4 shows the trend of the reflectance values of each dataset, while Figures 5 to 7 show the NDVI maps calculated from the AS, PD and PS datasets, respectively.
Statistic AS PD PS
Minimum -0.49 -0.201 -0.583
Maximum 0.948 0.913 0.729
Mean 0.603 0.605 0.159
StdDev 0.257 0.193 0.202
Table 5. NDVI reflectance values obtained from each dataset
Figure 4. Graph of the NDVI values
The most noticeable observation comparing the different NDVI maps is that the negative values (-0.255) and the low positive values (0.0733) in the PS dataset represent inter alia wetland vegetation. These values also represented infrastructure such as roads, eroded areas, earthen dams and areas of infilling. The PD dataset have positive 0.356 to 0.635 values for these areas that indicate live dense vegetation. The Wetland vegetation such as the Pragmites australis (Common Reed) was starting to die back during this time in autumn but was still a long way from the winter dormancy. This specific example indicates that the PD reflectance values correlated with field observations in the study area; in contrast, the uncorrected reflectance values from the PS dataset does not reflect the true conditions. The disadvantage of the AS data was that it was not georectified with GCPs. We therefore utilised and concentrated mostly on the PD data for analysis and interpretation in section 4.2.
Figure 5. NDVI calculated from the AS dataset.
Figure 6. NDVI calculated from the PD dataset.
Figure 7. NDVI calculated from the PS dataset.
4.2 Data analysis and interpretation
The assessment of various WET-Health vegetation disturbance classes were significantly enhanced using the multispectral UAV imagery and derived NDVI. The high resolution multispectral UAV imagery provided the opportunity to complete fine scale extent determination and easy distinguish between the disturbance classes. We firstly completed a visual analysis of the 5-band UAV orthomosaics where after we analysed and extracted information from the NDVI calculation.
The extent of hydrophilic (wetland) vegetation was determined from the UAV multispectral imagery (Figure 8) with the help of information from the on-site evaluation. This provided information to determine the extent of areas with minimal human disturbance (limited disturbance). The determination of extent of alien woody plant types was easily completed; the extent of species such as the Black and Silver wattle (Acacia spp) could be estimated well. Areas of infestation of the Kikuyu (Pennesitum clandestinum) grass species was further easily determined from the 5-band orthomosaic.
The extent and intensity of anthropogenic impacts such as infilling/historic sand mining and eroded areas was determined from the orthomosaic as seen in Figure 9. This was also done for the other disturbance classes such as deep and shallow flooding by dams, areas of pasture and cultivation within the wetland.
Figure 8. Vegetation extents within the wetland.
Figure 9. Determination of extent and intensity of disturbance classes from the UAV orthomosiac.
4.2.1 NDVI vegetation integrity assessment
The PD NDVI index value regions was exported from the raster files as shape files using a 1-m grid spacing. A system similar to the one used in precision agriculture using application maps was used to define the WET-Health disturbance classes in the wetland. Ten classes were generated from NDVI The Jenks optimisation method (McMaster et al., 2002) was used to determine the best arrangement of values into different classes. The respective reflectance values (NDVI classes) correlated to different vegetation disturbance classes. While the reflectance values differ at different times of the year including the correlation with the vegetation disturbance classes, a similar trend will still apply. Figure 10 shows the correlation of the lower NDVI values with disturbed areas that include deep and shallow flooding by dams, areas of infilling and farm roads.
Figure 10. Low NDVI values indicating disturbed areas within the wetland
Figure 11 shows the correlation of the intermediate NDVI values with areas that include wetland and grassland vegetation although the end of this range value (0.59) also included areas with seasonal weeds and eroded Kikuyu grass. Dense stands of the invasive Kikuyu grass and alien wattle tree species (Figure 12) was indicated by the high reflectance values (0.755 and 0.838). An interesting observation made was that the specific area where the majority of 0.838 reflectance value is represented include an area with agricultural runoff from the adjacent Kikuyu plantings. Vigorous growth of the Kikuyu is observed in this area and it is also the area with the largest infestation.
Figure 11. Intermediate NDVI values indicating wetland and grassland vegetation
Figure 12. High NDVI values indicating dense stands of invasive grass (Kikuyu) including alien trees (Acacia spp)
Table 6 indicates the NDVI classes, the extent of each class including the extents of the corresponding WET-Health classes determined though the on-site evaluation. Comparison of the NDVI extents with the extents determined through the onsite evaluation showed considerable differences between the two. The NDVI classes more accurately represented the disturbed areas (dams, infilling, infrastructure), indicating that the on-site evaluation was overestimated. Eroded areas were also overestimated in the on-site evaluation. Areas with alien and invader vegetation were underestimated with the on-site evaluation. With the UAV multispectral NDVI vegetation assessment, it was possible to more accurately map areas with invader vegetation such as the Kikuyu grass. The areas with minimal human disturbance (areas with wetland vegetation and grassland) was also underestimated with the on-site evaluation.
NDVI Extent (ha)
NDVI Disturbance Classes Extent (%)
On-site field evaluation WET-Health Disturbance classes
Extent (%) -0.13000 0.85 Deep flooding by dams, farm roads and
areas of infilling
5.06 Deep flooding by dams, infrastructure, eroded areas
36 0.17700 0.54 Shallow and some deep flooding by
dams/farm roads/sediment deposition and areas of infilling
3.217 Shallow and deep flooding by dams, Infrastructure, eroded areas
0.26000 0.4810 Shallow flooding dams, farm roads and areas of infilling
2.866 Shallow flooding by dams, infrastructure, eroded areas 0.34200 0,6490 Shallow flooding by dams, dam edges,
farm roads and eroded areas
3.867 Shallow flooding by dams, Infrastructure, eroded areas 0.42500 0.9390 Dam edge vegetation, moribund
wetland vegetation and moribund grass in disturbed place
5.59 Eroded areas 5.4
0.50700 2.115 Moribund grassland, moribund wetland vegetation, road edge grass
12.60 Minimal human disturbance 8
0.59000 3.830 Wetland vegetation, grassland, seasonal weeds, eroded dry Kikuyu grass
22.82 Minimal human disturbance and annual pastures
17
0.67200 4.220 Grassland, Kikuyu plantings, alien herbs and shrubs, small alien trees
25.1 Minimal human disturbance 25
0.75500 2.820 Kikuyu grass plantings, Kikuyu grass wetland invasions, Cynodon dactylon and other opportunistic grass species, large alien trees (wattle species)
16.80 Dense Alien vegetation patches and crop lands (Kikuyu)
7.6
0.83800 0.340 Kikuyu grass invasions (wet areas with fertiliser), large alien trees, other invader plants
2.026 Dense Alien vegetation patches 1
Table 6. NDVI classes, the extent of each NDVI class, the extents of the WET-Health classes determined with the on-site evaluation.
The assessment using the multispectral UAV products reveals a decrease of the extent of the disturbances within the wetland (excluding minimal human disturbance) from 62% to 53.5%.
The information from the NDVI classes was further used to estimate the intensity and calculate the magnitude of impact for each disturbance class category. The WET-Health vegetation module supplemented with information from multispectral UAV products still indicates that the vegetation of the wetland
is largely modified (“D” PES Category) and that the vegetation
of the wetland will further deteriorate (change score). However a lower impact score (activities taking place within the wetland) were determined (Table 7). The result is a more accurate estimation of the impacts in the wetland
Present State of
Table 7. Vegetative Health of the system and trajectory of change.
5. CONCLUSION
We evaluated the performance of low altitude multispectral UAV imagery to determine the state of the vegetation of a wetland. Furthermore, we tested different processing software applications for the processing of the imagery.
The results in terms of the data quality indicates that the PS data was the most accurate in terms of geometric accuracy.
The results of the NDVI computations was similar for AS and PD although the PS data did not provide the true reflectance values (no radiometric calibration). The PD data was used for analysis and interpretation (AS data not georectified with GCPs).
The results in terms of the data analysis and interpretation indicate that the UAV multispectral imagery and derived NDVI provided accurate and refined mapping that enhanced the overall vegetation integrity assessment. We conclude:
(i) Determination of extents of disturbed areas within the wetland was significantly enhanced and correctly assigned to the correct disturbance classes.
(ii) Determination of wetland and grassland vegetation extents (areas with minimal human disturbance) was significantly enhanced. The on-site evaluation was difficult and time consuming while the UAV multispectral NDVI vegetation assessment provided more accurate and refined results.
(iii) Mapping of invasive and alien vegetation extents was significantly enhanced. This included the determination of extents of infestation with invader grass.
(iv) Future studies should determine the correlation of NDVI with the vegetation disturbance classes at different times of the year (seasons) to determine the trend of vegetation dynamics and utility of NDVI in monitoring these dynamics.
Valuable information is extracted from the multispectral UAV imagery and derived products that can enhance and facilitate better environmental planning and decision making. It is however important to take note that the use of UAV imagery can and may not fully replace field studies but are an excellent tool if used in combination with field studies.
ACKNOWLEDGEMENTS
We would like to thank Gillcor CC who provided the equipment, resources and expertise to complete the surveying for this project. University of Johannesburg (UJ) Department of Geography, Environmental Management and Energy Studies for partially funding the conference attendance.
REFERENCES
Adam, E., Mutanga, O., and Rugege, D., 2010. Multispectral and hyperspectral remote sensing for identification and mapping of wetland vegetation: a review. Wetlands Ecology and Management, 18(3), pp. 281-296.
Boon, M.A., Greenfield, R. and Tesfamichael, S., 2016. Wetland Assessment using Unmanned Aerial Vehicle (UAV) Photogrammetry. International Archives of the Photogrammetry, Remote Sensing and Spatial Information Sciences, 41, pp. 781-788.
Boon, M.A., Greenfield, R., and Tesfamichael, S., 2016. Unmanned Aerial Vehicle (UAV) photogrammetry produces accurate high-resolution orthophotos, point clouds and surface models for mapping wetlands. South African Journal of Geomatics, 5(2), pp. 186-200
Colomina, I., and Molina, P., 2014. Unmanned aerial systems for photogrammetry and remote sensing: A review. ISPRS Journal of Photogrammetry and Remote Sensing, 92, pp. 79-97.
Husson, E., Ecke, F., and Reese, H., 2016. Comparison of Manual Mapping and Automated Object-Based Image Analysis of Non-Submerged Aquatic Vegetation from Very-High-Resolution UAS Images. Remote Sensing, 8(9), 724.
Lechner, A. M., Fletcher, A., Johansen, K., and Erskine, P., 2012. Characterising upland swamps using object-based classification methods and hyper-spatial resolution imagery derived from an unmanned aerial vehicle. ISPRS Annals of the Photogrammetry, Remote Sensing and Spatia l Information Sciences, 4, pp. 101-106.
Jensen, A. M., Hardy, T., McKee, M., and Chen, Y., 2011. Using a multispectral autonomous unmanned aerial remote sensing platform (AggieAir) for riparian and wetlands applications. IEEE International Geoscience and Remote Sensing Symposium, pp. 3413-3416.
Macfarlane, D.M., Kotze, D.C., Ellery, W.N., Walters, D., Koopman, V., Goodman, P., and Goge, C., 2009. WET-Health: A technique for rapidly assessing wetland health.Water Research Commission, Pretoria. WRC Report No TT 340/09
McMaster, R., and McMaster, S., 2002. A history of twentieth-century American academic cartography. Cartography and Geographic Information Science, 29(3), pp 305-321.
Marcaccio, J., Markle, C., and Chow-Fraser, P., 2015. Unmanned aerial vehicles produces high-resolution, seasonally- relevant imagery for classifying wetland vegetation. International Archives of the Photogrammetry, Remote Sensing and Spatial Information Sciences, Toronto, Canada, Vol. XL-1/W4, pp. 249-256
Nebiker, S., Lack, N., Abächerli, M., and Läderach, S., 2016. Light-Weight Multispectral UAV sensors and their capabilities for predicting grain yield and detecting plant diseases. International Archives of the Photogrammetry, Remote Sensing and Spatial Information Sciences, Prague, Czech Republic, Vol. XLI-B1, pp. 963-970.
Zaman, B., Jensen, A. M., and McKee, M., 2011. J Use of high-resolution multispectral imagery acquired with an autonomous unmanned aerial vehicle to quantify the spread of an invasive wetlands species IEEE International Geoscience and Remote Sensing Symposium, pp. 803-806.
Zweig, C.L., Burgess, M.A., Pecival, H.F., and Kitchens, W.M., 2015. Use of Unmanned Aircraft Systems to Delineate Fine- Scale Wetland Vegetation Communities. Wetlands, 35, pp.303-309.
APPENDIX
Disturbance Class Extent (%) Intensity (0 - 10)
Areas of sediment deposition/ infilling & excavation
9,5 8
Eroded areas 15,4 7
Seepage below dams 1 3
Minimal Human Disturbance 38 1
Overall weighted impact
score 5.4
Table 8. WET-Health vegetation module completed for the on-site evaluation.
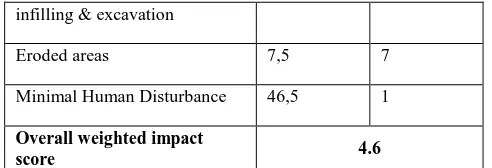
Disturbance Class Extent (%) Intensity (0 - 10)
infilling & excavation
Eroded areas 7,5 7
Minimal Human Disturbance 46,5 1
Overall weighted impact
score 4.6
Table 8. WET-Health vegetation module completed with the UAV multispectral assessment.