CHANGE DETECTION AND DYNAMIC ANALYSIS BASED ON
REMOTE SENSING IMAGES
G. Luzia, M. Crosettoa, N. Devanthérya, M. Cuevasa, X. Mengb, *
a
Institute of Geomatics, Barcelona, Spain - [email protected]
b Nottingham Geospatial Institute, The University of Nottingham, UK – [email protected]
KEY WORDS: Non-destructive Measurement, Real Aperture Radar, Structural Health Monitoring, Structural Dynamics, Change Detection, Vibration Analysis
ABSTRACT:
A radar uses the time elapsed between the transmission and reception of an electromagnetic waveform to locate targets present in the illuminated area. Different objects will reflect the radiation with different intensities and phase. The signal provided by standard radar is a profile of the intensity backscattered from the scene as a function of the distance. The resolution, i.e. the capability to distinguish different targets, is related to instrumental parameters and, for conventional radar, is in the range of tens of centimetres. The elementary sampling volume of a radar measurement is usually called radar bin. A radar image can be obtained when an azimuth and a range resolution is available, and this can be attained in different ways: performing a mechanical scanning of the antenna, the most familiar mode used for surveillance, meteorological radar etc, or modifying its spatial features by changing the characteristics of the radiated signal or finally through a specific processing of the acquired data, as in the case of Synthetic Aperture Radar (SAR). In this paper only 1D data without any cross range resolution are used. The vibration of a target corresponds to a small and rapid variation of the radar-target distance to which the phase of the received signal is related. Coherent radar is able to provide measurements of the phase variation along time exploiting the interferometric technique. The received radar signals permits to retrieve distance variations of the observed objects in the order of small fractions of the transmitted wavelength, by comparing the phase of signals acquired at different times. Use a short span bridge as a test-bed this study investigates the actual capability of a Real Aperture Radar (RAR) interferometer to detect the natural vibration caused by wind or pass pedestrians. It is found that RAR can pick up bridge displacements of a few tens of m and detect a wide range of vibrations.
* Corresponding author.
1. INTRODUCTION
Different sensors can be used for monitoring bridges of different sizes [Meng, 2002]. In most case geometric displacements and vibration frequencies are used to identify the structural health conditions. To fully understand the spatial and temporal change of a bridge integrated sensor system is used to measure physical, geometric variables together with the measurements of environmental parameters and external excitations such as traffic loading. Meng (2002) compared the advantages and limitation of both individual sensor systems and integrated ones. In recent years, many new technologies have been employed for detecting the dynamics of bridges and the Real Aperture Radar (RAR) interferometry is of a most interesting advance in this area since it is a non-contact survey system and has very high displacement sensitivity of up to a few tens of m (1×10⁻⁶ of a metre) with a sampling rate of 100Hz. Previous papers on bridge monitoring through interferometric radar by the authors can be found from Luzi (2012) and Negulescu (2013). Other researchers have conducted similar work (Gentile, 2012; Pieraccini et al., 2006; Stabile et al., 2013; Coppi et al., 2010). Overall the technique is proved to perform high sensitivity displacement measurements, down to a few microns in a cost effective approach which is very useful to detect the dynamics of key element of different infrastructure where accessibility is a big issue such as bridge cables, high-rising towers.
The Institute of Geomatics in Spain has recently tested a new terrestrial remote sensing device, RAR, which offers three interesting vibration monitoring capabilities: (i) a very high
sensitivity to displacements; (ii) the capability to sample the vibrations in time at high frequencies; (iii) non-contact and easy-to-make remote sensing measurements. These are unmatched capabilities from the point of view of geomatics, which could be exploited to open new applications. The University of Nottingham in the UK is leading the research of using integrated Earth Observation (EO) technologies such as InSAR with GNSS measurement for detecting deformations of long bridges. These two organisations have identified the necessity to start collaboration in the identification of structural health conditions with new detection and analysis methods. In this article, we report the preliminary results of an experimental investigation aimed at evaluating the effectiveness of coherent Real Aperture Radar (RAR) sensor to estimate the vibration of a test-bed bridge in Spain, through an ambient vibration testing. The first section of this paper introduces the RAR technique and the instrument. This is followed by the description and analysis of some experimental results aimed at evaluating the reliability of the use of a microwave apparatus presently available on the market. The final section includes future work and the conclusions drawn from this experiment and analysis.
2. THE TECHNIQUE AND THE INSTRUMENT
As a remote sensing technology, a radar uses the time elapsed between the transmission and reception of an electromagnetic waveform to locate targets present in the illuminated area. Different objects will reflect the radiation with different intensities and phase. The signal provided by standard radar is International Archives of the Photogrammetry, Remote Sensing and Spatial Information Sciences,
Volume XL-7/W1, 3rd ISPRS IWIDF 2013, 20 – 22 August 2013, Antu, Jilin Province, PR China
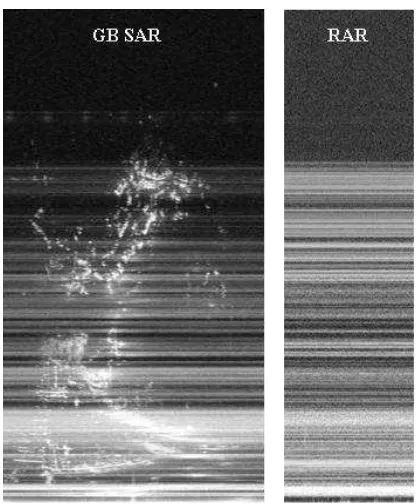
a profile of the intensity backscattered from the scene as a function of the distance. The resolution, i.e. the capability to distinguish different targets, is related to instrumental parameters and, for conventional radar, is in the range of tens of centimetres. The elementary sampling volume of a radar measurement is usually called radar bin. A radar image can be obtained when an azimuth and a range resolution is available, and this can be attained in different ways: performing a mechanical scanning of the antenna, the most familiar mode used for surveillance, meteorological radar etc, or modifying its spatial features by changing the characteristics of the radiated signal or finally through a specific processing of the acquired data, as in the case of Synthetic Aperture Radar (SAR). In this paper only 1D data without any cross range resolution are used. An example of the difference between a standard SAR image and a Real Aperture Radar (RAR) is shown Figure 1.
The difference between RAR and InSAR can be found from: http://www.lsgi.polyu.edu.hk/sTAFF/zl.li/vol_2_1/02_chen.pdf.
Figure 1. Example of a GB-SAR image (one pixel corresponds to azimuth and range radar sampling of the observed area) and a RAR 1D image of the same area
The vibration of a target corresponds to a small and rapid variation of the radar-target distance to which the phase of the received signal is related. Coherent radar is able to provide measurements of the phase variation along time exploiting the interferometric technique. The received radar signals permits to retrieve distance variations of the observed objects in the order of small fractions of the transmitted wavelength, by comparing the phase of signals acquired at different times. The radar system used for the experiments in this paper works at 17.2 GHz centre frequency (Ku band), i.e. 1.74 cm wavelength. It is important to stress that the interferometric technique can estimate distance variations only along the line-of-sight (LOS) direction. When a target associated to a radar bin vibrates, its distance to the radar, d(t), varies over time and it is linearly related to the corresponding phase variation of the radar bin. This differential phase is directly related to the vibration displacement along the LOS. The relationship between the
interferometric phase and the distance variation along the LOS, dLOS, is the well-known basic interferometric relationship:
measured interferometric phase. It is strongly recommended to find the radar bin displaying the best SNR before performing a measurement, because the best precision achievable in the measurement of radar phases is directly related to the SNR achieved by the analysed radar bin.
The radar equipment consists of a continuous-wave (CW) step-frequency (SF) transceiver, which transmits continuous waves at discrete frequency values, sampling a bandwidth at a constant interval (Coppi et al., 2010). The main operational characteristics of the system are summarized in Table 1. As far as the accuracy in displacement measurements is concerned, case studies demonstrated that it can be down to a few tens of microns (Negulescu et al., 2013). The location and the dimension of the measured radar bins are also dictated by the transmitting and receiving antennas. The antennas used in this work are two pyramidal horns whose half power beam-width is about 0.18 radians, which means that at 10 m distance from the target a 3 m2 area approximately is illuminated, and this value increases as the observation angle increases. The system consists of a sensor module, a control PC, and a power supply unit. The sensor is installed on a tripod equipped with a rotating head able to adjust the bearing of the sensor towards the investigated structure (Figure 2).
TABLE 1. IBIS-S main characteristics.
Parameter Value
Operating frequency 17.2 GHz (Ku band) Max. distance (@ 40 Hz sampling
Figure 2. An IBIS-S System for bridge monitoring International Archives of the Photogrammetry, Remote Sensing and Spatial Information Sciences,
Volume XL-7/W1, 3rd ISPRS IWIDF 2013, 20 – 22 August 2013, Antu, Jilin Province, PR China
3. THE EXPERIMENTAL CAMPAIGN
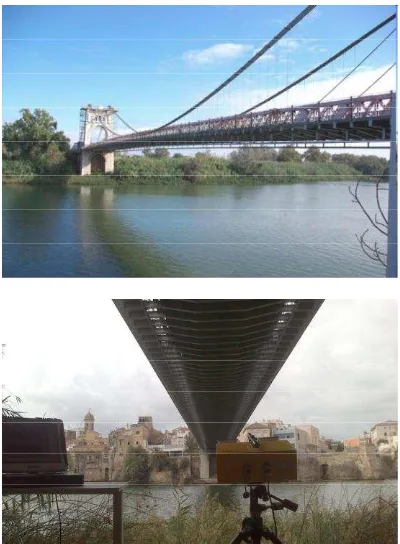
The monitored structure is a suspension bridge located in Amposta (Catalonia), over the Ebro River in Spain (Figure 3).
Figure 3. Two views of the monitored bridge and of the measuring RAR system
It is a two-way two-lane 134m long bridge. Its metal structure (see Figures 3) allows the radar sensor acquiring high signal responses due to its high reflectivity. A typical profile of the received radar signal is shown in Figure 4: each peak, regularly spaced, correspond to the response from a girder. Observing Figure 4 it can be found that as the distance increases the signal intensity decreases till the end of the bridge where a final peak due to the pier is noticeable.
Figure 4. Range profile of the received radar signal. Red arrows mark the peaks corresponding to the bridge gilders
Three different RAR installations as depicted in Figure 4 have been used. In the following preliminary results for each case are separately analysed.
Here only the first configuration Position 1, aimed at monitoring the bridge deck deformation, is analysed. The radar is located underneath the bridge as shown in Figure 3. The data acquisition duration is 30 minutes; the sampling frequency used is 166.11 Hz. The observation angle (elevation) is 12.5º and a maximum range of 150m is considered. From the range profile, shown in Figure 6, some points of the bridge have been selected to analyse their displacement history.
Figure 5. Geometrical configurations used during the experimental campaign
Figure 6. Vertical displacement measured during the passage of a car (a) of bins 25, 47, 66 and 81; (b) Those displacements of bins106 and 121
Figures 6a and 6b show an example of the vertical displacement detected by the radar during the passage of a car; the measured values increase as the bin approaches the central part of the bridge reaching its maximum, 2.3 mm, for bin 121 to which the middle of the bridge corresponds.
International Archives of the Photogrammetry, Remote Sensing and Spatial Information Sciences, Volume XL-7/W1, 3rd ISPRS IWIDF 2013, 20 – 22 August 2013, Antu, Jilin Province, PR China
Figure 7 is another occasion for the vertical displacements of different locations on the bridge. In this figure the maximum displacements retrieved from radar acquisition are depicted in the corresponding point of the bridge.
Figure 7. Values of the maximum displacements retrieved from radar acquisition depicted in the corresponding point of the bridge
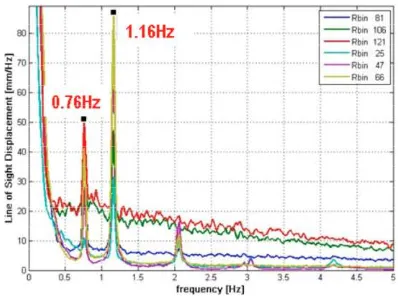
Using Welch (1967) method, an estimate of the power spectral density (PSD) has been calculated for the time history of different bins. In Figure 8 the PSD corresponding to various bins is shown. Some peaks, corresponding to the vibration frequencies of the monitored structure, can be individuated among which 0.76 Hz and 1.16 Hz stand out.
Figure 8. PSD calculated with Welch method for bins: 81, 106,121, 25, 47, and 66
4. CONCLUSIONS
This paper presented some preliminary results of detecting bridge dynamics with Real Aperture Radar (RAR). The initial results have demonstrated that RAR could be used to detect subtle vertical displacements of a few tens of microns at a high sampling rate of up to 100 Hz. Since RAR could only provide 1D measurements and GNSS have problem for provision of high vertical deformations sensor integration is necessary to attain precise 3D deformation measurements and further tests have been arrange to identify the pros and cons of RAR for bridge deformation of different sizes.
References
References from Journals:
Gentile, C., 2012. Deflection measurement on vibrating stay cables by non-contact microwave interferometer. NDT&E
International, 43(2010), pp. 231-240.
Luzi, G., Monserrat, O., and Crosetto, M., 2012. The Potential of coherent radar to support the monitoring of the health state of buildings. Research in Nondestructive Evaluation, 23(3), 125-145.
Negulescu, C., Luzi, G., Crosetto, M., Raucoules, D., Roullé, A., Monfort, D., Pujades, L., Colas, B., Dewez, T., 2013. Comparison of seismometer and radar measurements for the modal identification of civil engineering structures. Engineering
Structures, 51(2013), pp. 10–22.
Pieraccini, M., Fratini, M., Parrini, F. and Atzeni, C., 2006. Dynamic monitoring of bridges using a high-speed coherent radar. IEEE Trans. Geosci. Remote Sens., 40(11), pp. 3284-3288
Stabile, T. A., Perrone, A., Gallipoli, M. R., Ditommaso, R., and Ponzo, F. C., 2013. Dynamic survey of the Musmeci Bridge by joint application of ground-based microwave radar interferometry and ambient noise standard spectral ratio techniques. IEEE Geosci. Remote Sens. Lett., 10(4), pp. 870-874.
Welch, P. D., 1967. The use of fast Fourier transform for the estimation of power spectra: A method based on time averaging over short, modified periodograms. IEEE Trans. Audio
Electroacoust, AU-15(2), pp. 70-73.
References from Other Literature:
Coppi, F., Gentile, C., and Ricci, P., 2010. A software tool for processing the displacement time series extracted from raw radar data. In: The 9th Int. Conference on Vibration Measuerements by Laser and non-contact Techniques and short
Course, Ancona, Italy.
Meng, X., 2002. Real-time Deformation Monitoring of Bridges Using GPS/Accelerometers. PhD Thesis, The University Of Nottingham, UK.
International Archives of the Photogrammetry, Remote Sensing and Spatial Information Sciences, Volume XL-7/W1, 3rd ISPRS IWIDF 2013, 20 – 22 August 2013, Antu, Jilin Province, PR China