ROLE ASSESSMENT OF GIS ANALYSIS AND ITS RELIABILITY WHILE RANKING
URBAN SUSTAINABILITY USING SCENARIOS SPECIFIC TO REGIONAL CLIMATE,
COMMUNITY AND CULTURE
Huda Al Salmi, Hussein M. Abdulmuttalib*
a ADM, Abu Dhabi City Municipality Spatial Data Directorate, Salam Street Head Quarters, UAE -
b ADM, Abu Dhabi City Municipality Spatial Data Directorate, Salam Street Head Quarters, UAE – [email protected]
Commission IV/8: 3D Spatial Data Integration for Disaster Management & Env. Monitoring
KEY WORDS: GIS, Environment, Urban, Sustainability, Spatial Analysis
ABSTRACT:
Urban Sustainability expresses the level of conservation of a city while living a town or consuming its urban resources, but the measurement of urban sustainability depends on what are considered important indicators of conservation besides the permitted levels of consumption in accordance with adopted criteria. This criterion should have common factors that are shared for all the members tested or cities to be evaluated as in this particular case for Abu Dhabi, but also have specific factors that are related to the geographic place, community and culture, that is the measures of urban sustainability specific to a middle east climate, community and culture where GIS Vector and Raster analysis have a role or add a value in urban sustainability measurements or grading are considered herein. Scenarios were tested using various GIS data types to replicate urban history (ten years period), current status and expected future of Abu Dhabi City setting factors to climate, community needs and culture. The useful Vector or Raster GIS data sets that are related to every scenario where selected and analysed in the sense of how and how much it can benefit the urban sustainability ranking in quantity and quality tests, this besides assessing the suitable data nature, type and format, the important topology rules to be considered, the useful attributes to be added, the relationships which should be maintained between data types of a geo- database, and specify its usage in a specific scenario test, then setting weights to each and every data type representing some elements of a phenomenon related to urban suitability factor. The results of assessing the role of GIS analysis provided data collection specifications such as the measures of accuracy reliable to a certain type of GIS functional analysis used in an urban sustainability ranking scenario tests. This paper reflects the prior results of the research that is conducted to test the multidiscipline evaluation of urban sustainability using different indicator metrics, that implement vector GIS Analysis and Raster GIS analysis as basic tools to assist the evaluation and increase of its reliability besides assessing and decomposing it, after which a hypothetical implementation of the chosen evaluation model represented by various scenarios was implemented on the planned urban sustainability factors for a certain period of time to appraise the expected future grade of urban sustainability and come out with advises associated with scenarios for assuring gap filling and relative high urban future sustainability. The results this paper is reflecting are concentrating on the elements of vector and raster GIS analysis that assists the proper urban sustainability grading within the chosen model, the reliability of spatial data collected; analysis selected and resulted spatial information. Starting from selecting some important indicators to comprise the model which include regional culture, climate and community needs an example of what was used is Energy Demand & Consumption (Cooling systems). Thus, this factor is related to the climate and it‟s regional specific as the temperature varies around 30-45 degrees centigrade in city areas, GIS 3D Polygons of building data used to analyse the volume of buildings, attributes „building heights‟, estimate the number of floors from the equation, following energy demand was calculated and consumption for the unit volume, and compared it in scenario with possible sustainable energy supply or using different environmental friendly cooling systems this is followed by calculating the cooling system effects on an area unit selected to be 1 sq. km, combined with the level of greenery area, and open space, as represented by parks polygons, trees polygons, empty areas, pedestrian polygons and road surface area polygons. (initial measures showed that cooling system consumption can be reduced by around 15 -20 % with a well-planned building distributions, proper spaces and with using environmental friendly products and building material, temperature levels were also combined in the scenario extracted from satellite images as interpreted from thermal bands 3 times during the period of assessment. Other examples of the assessment of GIS analysis to urban sustainability took place included Waste Productivity, some effects of greenhouse gases measured by the intensity of road polygons and closeness to dwelling areas, industry areas as defined from land use land cover thematic maps produced from classified satellite images then vectors were created to take part in defining their role within the scenarios. City Noise and light intensity assessment was also investigated, as the region experiences rapid development and noise is magnified due to construction activities, closeness of the airports, and highways. The assessment investigated the measures taken by urban planners to reduce degradation or properly manage it. Finally as a conclusion tables were presented to reflect the scenario results in combination with GIS data types, analysis types, and the level of GIS data reliability to measure the sustainability level of a city related to cultural and regional demands.
*. Corresponding author:
1. INTRODUCTION
1.1 Forward to Grading Urban Sustainability
Sustainability is a way of thinking, a way of understanding, a way of acting and a way of living, for that a city planner besides and together with many other specialists should think, understand, act and live for sustainability. That‟s living in a world where everyone takes part in protecting it, conserving its resources, thus sustain it. Ok, that‟s one thing but who can tell or indicate the right way to do that, and who can measure if the correct method is followed, besides the closeness to this sort of ambiguous status of our world or part of it.
Thus, for planners and others to do so in a spatial geographic world, Geoscientists provided spatial tools which if used effectively, the indicators of sustainability will start to flow in the same stream or perhaps same direction, and the closeness of some works or activities to satisfy an indicator can be much more comprehensively planned, implemented and measured. Giving an example of which, someone might say the emission level of greenhouse gases is an indicator or part of an indicator, or the closeness of industrial areas to dwelling is a negative indicator, or whatever valuable measures they can be that are set by specialized organizations, and herein comes the role of spatial analysis tools to provide an assistant for thinking about, understanding it, acting in accordance to, and living a life of such. This paper reflects role assessment using some activity works with practical examples of sustainability spatial analysis, targeting monitoring and protecting our world environment letting the process work flow show and prove how to use the different sustainability indicators particularly in urban planning.
1.2 Analysis of some layers affecting CO2 emission
It‟s well known that CO2 is the major part of greenhouse gasses, these gasses off course are related to many activities which can be positive or negative to an indicator, but only some of which will be assessed herein. That is because this assessment shall be further continued in two parallel works which are going on, those works or researches have some factors in common, and they also differ in their goals, and the gap analysis they are working on, one of them is dealing with urban sustainability in general, while the other is only using the environmental spatial analysis to grab the quality measures associated with the process of analysis. Further using the tools that Geographic Information Science provides inclusive of remote sensing tools, or in other words “vector and Raster spatial analysis” the following factors were considered in the analysis:
1. The energy consumption of particular buildings were calculated from the available sample data
2. The suspected energy consumption of all the buildings in the test area were calculated
3. Calculating the energy of a sample building that had implemented energy reduction strategy for one year 4. Calculate the suspected hypothetical reduced energy
for all the buildings if implemented a similar strategy for energy reduction
5. Measure the value of equivalent Co2 reduction that is caused by the reduction in energy consumption 6. Distribute the reduced values to the volumes of
9. Calculate the resultant hypothetical reduced energy summation of the sub areas and for the total test area 10. Repeat the works changing the methods of calculation
forming scenarios to compare the results
11. Collect actual environmental sample measurements from in-situ instrumentations and verify its consistency with the results from the scenario consider such as green roofs and sustainable buildings 14. Reproduce the values of the quality model and further tune them, that they shall be usable generally with similar spatial analysis works.
The test area comprised high rise buildings and also distributed villas that range of approximately on three floors, the floor average height was selected to be three meters initially, further the actual building height will be used for calculating the volume of a building for the sake of calculating the average unit energy consumption of each building hypothetically. The problem is the lack of actual data of energy consumption, but once more data is available then only the parameters will be verified, which off course will increase the reliability of the results.
The statistics of the tables always played a role in deciding the values that will be used for the equations, more specifically histograms were generated for each resulted table values, and using them equations were constructed for further analysis as will be shown below.
The major data sets were used for the analysis are characterized by table , they were selected after considering the relations of the different existing feature classes to those indicators touched by or involving the greenhouse gasses, besides them having relations to cultural, regional and community aspects.
Feature class Type
Major role in the analysis Specific indicator
Table1. Major initially used feature classes International Archives of the Photogrammetry, Remote Sensing and Spatial Information Sciences, Volume XXXIX-B4, 2012
2. CONDUCTING URBAN SUSTAINABILITY SPATIAL ANALYSIS
As a measure of showing and proving the usefulness of GIS spatial analysis in the process of ranking the sustainability in the urban design, a process was conducted in a practical manner starting with selecting the test area, selecting some indicator related specific factors which are cultural, regional and climate specific, selecting the layers of feature classes that relate to those indicator factors, then by combining the results scenarios of assessments were conducted for the purpose, to finally buildings, a total number of six buildings data provided annual energy consumption in kWh and besides this those buildings which have used energy reduction plans, has provided also the saved amount in kWh. This sample data is extremely small and insufficient, but on the other hand can give the bases for calculating approximate values of energy consumption, which will be refined in a later stage using more data collected. But what is important here is not only get the amount of energy consumption but also if environmental friendly methods are being used in a building to reduce the energy, what type of activities are those, how much do they effect the energy conservation on annual or periodic bases, and most importantly as a result to that how much CO2 is reduced in tones. As an example of that one building was producing 21961993 KWh per annum and with a reduction baseline of 8 % managed to save 1756959 KWh which is equivalent to a measure of 878.5 tones saving more than 70 thousand dollars for the first year of the reduction plan, it is off course anticipated that an investment has been made for following such a strategy but its sure benefiting for the long run.
2.2 Spatial & Statistical Analysis to Calculate Energy
The geographic places, geometries, and attributes for the buildings provided in sample data, were spatially searched and those falling within the test area where categorized. The plan is to use only those falling in the test area, but the results showed the results on table 2 where variance and standard deviation of the calculated factors need to be refined.
Table 2 Statistic of averaging energy consumption
The next step performed was based on a decision towards using the sample data which falls outside the test area to enrich the sample without actually changing the test area when performing the other activities and analysis, this is valid as the buildings
have similarities, uses the same sources of energy, but variability will not harm anyway in such a case, perhaps variability will make the sample more reliable to represent the data. This is presented by Table 3 herein where an improvement of the variance and standard deviation can clearly be seen.
Table 3 Larger Sample of Statistic for averaging energy For further narrowing the gap embedded within the sample data, those values were dropped comprising higher deviations or residuals. Further, the analysis was continued until a satisfaction of values was reached as follows in table 4:
12052.4732
Variance
109.783756
STD
Table 4
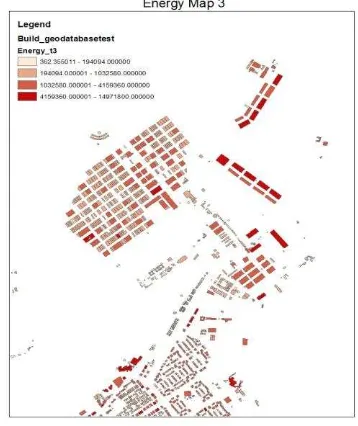
Now using areas of buildings and the number of floors attributes in the building data with the assumption of averaging The height of each floor to 3 meters, the equation that contain the factor value was used and the hypothetical energy consumption for all the buildings within the test area were calculated as shown by Map 3 on figure 1
Figure 1 Energy Map of the Test Area
volume Energy Factor squared
deviations 389487 38205250 98 315939 Variance
562 STD
Thus the resulted values were off course directly proportional to the volumes of buildings, know when adding other factors to some particular building types or buildings falling into a certain zones, such as those within industrial areas, or using some attributes such as the construction date, further if remote sensing will provide from images or Lidar data some parameters that can indicate the building material or the greenness of a building, as much as if a green roof exits then a further refinement can be inserted to the spatial tables and further analysis can indicate the relations to the mentioned factors to the energy consumption and subsequently the reduction of the emitted CO2 caused by power plants.
2.3 First values and Maps of reduced CO2
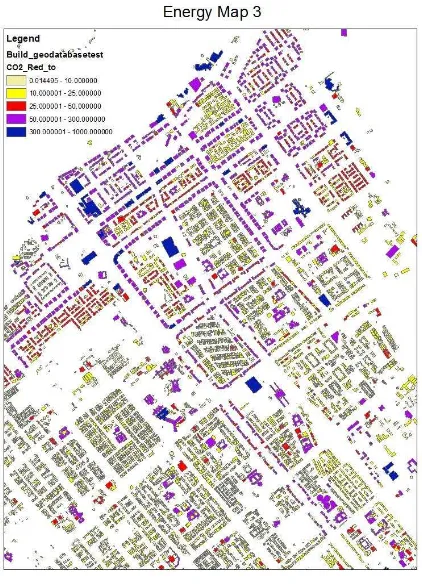
The sample data associated some relationships between reduced energy values in KWh and the equivalent carbon dioxide associated to it in tones, thus once the reduced energy is calculated maps of reduced CO2 can be generated out of which. Nonetheless, CO2 values are more sophisticated and can be related to many types of factors, such as factors of greenery areas, and road surfaces besides many others, but herein those tow feature class layers were selected as a start to the assessment, the primitive CO2 reduction map is illustrated in figure 2 uses five classes of energy reduction in tons of the test area, but again linearity to the volume is initially kept and will be verified by the other factors in further analysis and assessments.
Figure 2 CO2 Reduction Map
These are not actual CO2 values, but values that effect CO2 produced by the power plant supplying the energy to the area, as it‟s clear from the image above more emission is caused by concentrated dwelling areas, the fact which shall be further proved when using greenery and transformational feature Classes. The histogram generated from this data set as
illustrated in figure 3 show high repetitions at the lower CO2 reduction values.
Figure 3 Data Histogram of CO2 Reduced values
3. RASTER ANALYSIS AND CO2 VALUES
The role of GIS in ranking urban sustainability is further illustrated by conducting some operations using pixel values.
3.1 Rasterizing Vector Maps of CO2 Reduction
Working on the previously shown energy data and map of which transferring it to point data, as an intermediate operation for rasterizing its values as a step forward to prepare creating multi raster layers and perform processes among which. The raster map is then generated from vector point map as illustrated in figure 4 and data sets are classified and ranked with colours for the purpose of showing the frequency of classes using colours distributed spatially on the margins of maps.
Figure 4 Rasterized CO2 Reduced values
Again most of the areas show a lower reduction of CO2 represented by dark green and followed by lighter green for the second class, after which come the other classes occupying only a small part of the distributed map.
To add more values to this map point data is also calculated from greenery layers and road surface layers, leaving the other open space feature classes to be included in the future analysis once more sample energy data will be available, perhaps from private villas and flats, also the shape, combination and distance International Archives of the Photogrammetry, Remote Sensing and Spatial Information Sciences, Volume XXXIX-B4, 2012
between buildings can have an effect specially if combined with some wind and climate information.
3.2 Green feature classes and CO2 Factors
Adding Values to Building Data
Herein the greenery layers is combined with reduced CO2 from building layer to add to it a factor which is given as a percentage hypothetically, this percentage will be replaced by actual spatially varying percentage later as soon as more data will be received in regards, but nevertheless the operations here are more than sufficient because the major aim now is to prepare the basses for further assessment.
A buffer is generated around each building in different scenarios representing multiple buffer sizes, these buffers are related to the greenery layer to get a value out of which using joining and shortest distance calculation, followed with calculating the total greenery area that is covered by each buffer without reusing the greenery area once it‟s selected for a building buffer. Nevertheless this doesn‟t mean that repletion in this case wouldn‟t provide a logical value or measure but this issue is left for the other scenarios where centres represented by buildings are to be compared against each other in concern of the reduction of CO2 related to a certain situation of environmentally favourable factors such as green roofs.
Figure 5 Green factor raster Map
Using the statistic and the histogram of the green factor map illustrated above in figures 5 and in figure 6
Figure 6 Green factor histogram
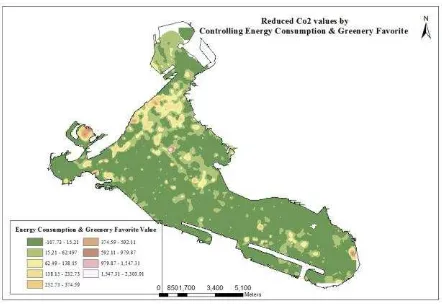
an equation is set and a calculation is performed to provide a resultant reduced CO2 Map that takes into consideration the greenery surroundings of buildings, based on the assumption that the greenery factor will add a maximum percentage value to CO2 reduction map, so using the statistic all the pixels will get a value accordingly but depending on the measure of greenery value at that selected particular buffer of a building. This is then resulted in a new CO2 map with values that are positively affected by the level of greenness.
Figure 7 Reduced CO2 (energy reduction and Green factors)
3.3 Road Surface feature classes and CO2 Factors
Reducing Values to Building Data
Herein the road surface layers are combined with reduced CO2 from building layer to reduce to it a factor which is given as a percentage hypothetically, this percentage again will be replaced by actual spatially varying percentage later as soon as more data will be received in regards, the actual value will be calculated from the vehicle statistical data in combination with the measures of emission of greenhouse gasses.
Practically a factor is calculated using the road surface data with the previously formed building buffers in a similar way such as the greenery, using the statistics and histogram and finally the map is produced to show how CO2 reduced values can be negatively affected by the closeness, type, wideness, traffic intensity, perhaps in combination with wind speed and direction besides many other factors.
Figure 8 Road surface Factors Map
The factor map above calculated is used with the taken value from the histogram below in figure 9
Figure 9 Road surface factor histogram
Combining the road factor map with the original CO2 reduced map, the resultant map will be as illustrated in fig 10 a map of CO2 reduced values but aggregated using the factor from road surface.
Figure 10 Reduced CO2 (energy reduction and Road factors)
3.4 CO2 and Combined effects from Greenery and Roads
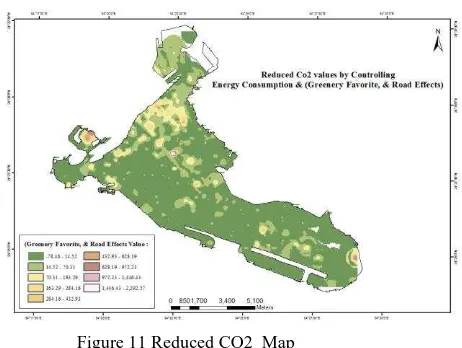
When combing the resultant maps we a get a better understanding of the CO2 reduction that considers not only energy reduction but also factors from greenery and factors from road surfaces., and this off course can be done for several more factors that has a regional, climate, or cultural effect to assess sustainability measures, the resultant map is illustrated below in figure 11.
These maps are to be combined in more scenarios where the pixel level is different; this measure will involve interpolations which will result considering neighbour pixel values.
Again as this practice was performed for CO2 reduction it can be repeated for other gasses, provided that those layers shall be used that has most effect on it, then also combinations of different gasses maps perhaps weighted to their level of harming to the environment and sustainability and finally the results should be used to assist the indicators and to improve the works of urban design, redesign and urban management towards sustainability.
Figure 11 Reduced CO2 Map
(Energy reduction + Green factor - Road factors)
4. CONCLUSION
GIS role to assist ranking urban sustainability is shown using the practical examples above, where tangible results could be measured, and clear understanding is provided, conducting the scenarios thus provide urban planners the tools to manage sustainability and use the indicators more effectively relating them to GIS layers.
The results on the other hand showed that condensing greenery areas and decreasing some categories of road surfaces help sustain urban planning by providing more accurate results of CO2 reduction, further assessments should take place to replace the assumptions with actual values and consequently verify the scenarios results.
References:
ADM, ADM Energy Management Report 2011
Wilson, J., Tyedmers, P, Pelot, R 2007. Contrasting and Comparing sustainable development indicator metrics. Reza Banai, Land Resources Sustainability for Urban Development
Abdulmuttalib h, Quality Aspects of Monitoring Environmental Variations Using Combined GIS & Remote Sensing Techniques with Emphases on Data Modelling, FIG 2006
Abdulmuttalib h, Total Quality Measures for Environmental Coastal Monitoring Using Remote Sensing, Lidar Bathymetry, Radar Altimetry and GIS Techniques, FIG Congress 2006 Abdulmuttalib H, Aspects of Data modelling of Fused Surfaces with Planimetric Data In a Topographic Geodatabase,
ISPRS Congress Istanbul
Abdulmuttalib H., (1998), “GIS Modeled Surfaces And Total Quality Management”, 2nd Int. Ph.D. Symposium in Civil Engineering 1998 Budapest.
4.1 Acknowledgements
We thank those whom participated in the support activities of conducting the analysis or in providing some data, and particularly Albert Agasthyan and Khalid Khamis.