BENCHMARKING MOBILE LASER SCANNING SYSTEMS USING A PERMANENT
TEST FIELD
Harri Kaartinen*, Antero Kukko, Juha Hyyppä, Anttoni Jaakkola
Finnish Geodetic Institute, FI-02431 Masala, Finland – [email protected]
Inter-Commission Working Group V/I
KEY WORDS: GPS/INS, Reference Data, Systems, Laser scanning, Point Cloud, Accuracy, Mobile, Geometric
ABSTRACT:
The objective of the study was to benchmark the geometric accuracy of mobile laser scanning (MLS) systems using a permanent test field under good coverage of GNSS. Mobile laser scanning, also called mobile terrestrial laser scanning, is currently a rapidly developing area in laser scanning where laser scanners, GNSS and IMU are mounted onboard a moving vehicle. MLS can be considered to fill the gap between airborne and terrestrial laser scanning. Data provided by MLS systems can be characterized with the following technical parameters: a) point density in the range of 100-1000 points per m2 at 10 m distance, b) distance measurement accuracy of 2-5 cm, and c) operational scanning range from 1 to 100 m. Several commercial, including e.g. Riegl, Optech and others, and some research mobile laser scanning systems surveyed the test field using predefined driving speed and directions. The acquired georeferenced point clouds were delivered for analyzing. The geometric accuracy of the point clouds was determined using the reference targets that could be identified and measured from the point cloud. Results show that in good GNSS conditions most systems can reach an accuracy of 2 cm both in plane and elevation. The accuracy of a low cost system, the price of which is less than tenth of the other systems, seems to be within a few centimetres at least in ground elevation determination. Inaccuracies in the relative orientation of the instruments lead to systematic errors and when several scanners are used, in multiple reproductions of the objects. Mobile laser scanning systems can collect high density point cloud data with high accuracy. A permanent test field suits well for verifying and comparing the performance of different mobile laser scanning systems. The accuracy of the relative orientation between the mapping instruments needs more attention. For example, if the object is seen double in the point cloud due to imperfect boresight calibration between two scanners, this will make especially the automatic modelling of the object much more challenging.
* Corresponding author.
1. INTRODUCTION
Experiences gained in earlier research have shown, that permanent test fields with accurate ground truth are valuable tools for analyzing the performance of remote sensing systems and methods in mapping tasks. To be able to compare various systems or methods, test data should be from a common test field. (Kaartinen and Hyyppä, 2006 and 2008.) This is a key factor in ensuring that the methods or systems are compared under equal conditions, and thus, the results are comparable. Comparing mobile laser scanning systems is challenging, as the accuracy of the georeferenced point cloud is highly dependent on the GNSS visibility during the data acquisition (Haala et al. 2008). Also the season can affect the satellite visibility, when tall deciduous trees are close to the trajectory.
Recent studies on MLS systems and their accuracy as well as environmental modelling done with MLS can be found in Barber et al. (2008), Brenner (2009), Clarke (2004), El-Sheimy (2005), Früh and Zakhor (2004), Graham (2010), Haala et al. (2008), Hassan and El-Sheimy (2008), Jaakkola et al. (2008), Kukko et al. (2007), Kukko and Hyyppä (2009), Lehtomäki et al. (2010), Lin et al. (2010), Lin and Hyyppä (2011), Manandhar and Shibasaki (2002), Petrie (2010), Shen et al. (2008), Steinhauser et al. (2008), Tao and Li (2007), Weiss and Dietmayer (2007), Yu et al. (2007) and Zhao and Shibasaki (2003a,b, 2005). System manufacturers have carried out and published their own tests, but few scientific publications exist
where system performances are examined and compared using a test field established by and results analyzed by an independent actor. Haala et al. (2008) demonstrated that the Streetmapper system could produce dense 3D measurements at an accuracy level of 30 mm in good GNSS conditions. They also reported that under degraded GNSS conditions a georeferencing error up to 1 m for the horizontal position can occur. Barber et al. (2008) used RTK-GPS measurements to collect reference data on two test sites to validate the geometric accuracy of the Streetmapper system. The main focus was on the elevation accuracy, only a few control points measured on white line markings on the road was used for planimetric accuracy analysis. University of California at Davis used total station and static terrestrial laser scanning (TLS) data to analyze the accuracy of MLS systems (Streetmapper 360, Optech Lynx and Ambercore Titan) in producing digital terrain models of pavement surfaces (Yen et al., 2010). In this test only elevation accuracy was concerned.
Finnish Geodetic Institute (FGI) established in 2009 a permanent test field for MLS system performance testing and calibration, and for data testing and development. Test field reference data comprises of georeferenced TLS point clouds. Tested system included two systems by FGI (ROAMER and Sensei) and three commercial systems (Optech Lynx, RIEGL VMX-250 and Streetmapper 360). System specific geometric accuracies were evaluated by comparing the extracted common targets from the reference and MLS data sets.
2. TEST FIELD FOR MOBILE LASER SCANNING RESEARCH
2.1 Test Field Requirements
When selecting the test field, following properties were searched for:
1. Areas with varying GNSS visibility.
2. Large number of different structures and objects along the route.
3. Flat and undulating terrain.
4. Easily accessible for reference measurements and operation.
5. Spacious public parking spaces for measurement preparations and special tasks, such as laser intensity research.
The aim was to create a test field suitable for geometric accuracy analysis and for acquiring data sets for object extraction method development and testing.
2.2 Espoonlahti Test Field
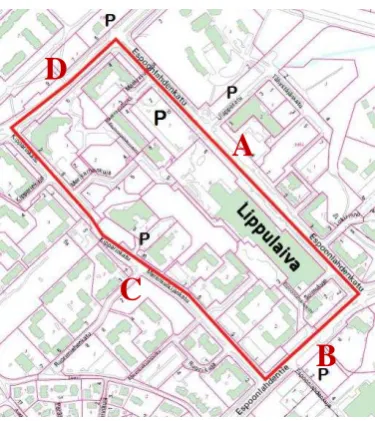
Established mobile laser scanning test field is located in Espoonlahti, about 16 km west of Helsinki. The test site covers one block around the shopping mall Lippulaiva covering 1700 meters of road environment (Figure 1).
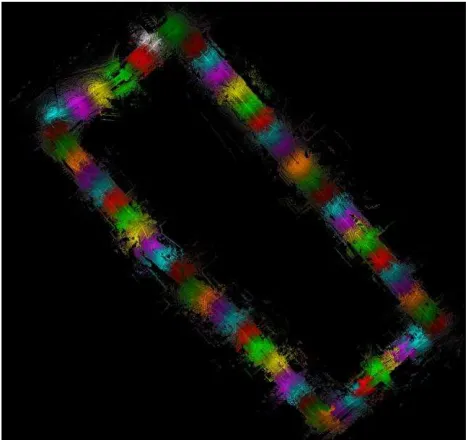
Test field can be divided into four sections, which are separated naturally by road crossings, as can be seen in Figure 1. Sections A, B and D have a good GNSS visibility, although some trees and higher buildings may limit the visibility of lower satellites. As can be seen in the digital surface model in Figure 2, section D has large trees growing close to the road, thus making GNSS conditions much more challenging. There are many types of buildings and other constructions such as stairs and walls in the area, as well as hundreds of pole type objects such as lamp posts, traffic signs and trees. In section A the road area, as well as most of the terrain close to the road, is very flat. On other sections there is more variation in terrain elevation, both in the road and in the surroundings. The height difference between the lowest and highest point on the road is 12 meters (Figure 2).
Figure 1. Espoonlahti test field. Driving route is marked with red line, and sections are marked with red letters A-D. Parking
spaces are marked with P. (Background map data © City of Espoo.)
Figure 2. Digital surface model of Espoonlahti test field (based on MLS data). (Background map data © City of Espoo.)
2.3 Reference Data
2.3.1 Terrestrial Laser Scanning Point Clouds were used
to obtain reference targets for geometric accuracy analysis. Reference point clouds were collected May 7th 2009 using FGI’s mobile mapping system Road Environment Mapper ROAMER (Kukko, 2007) in static mode. ROAMER was installed on top of a car, and the car was standing static on the road during each 360 degree scanning of the Faro Photon 80 terrestrial laser scanner (TLS) (Figure 3). The scanning resolution was set to 0.0013 rad point separation. After each TLS scanning the vehicle was moved about 30 meters (min 19 and max 42 m) to a new scanning location, resulting in total 58 TLS scannings to cover the whole route (Figure 4).
Figure 3. ROAMER in Espoonlahti test field. Lowest point on the road, elevation 31 m.
Highest point on the road, elevation 43 m.
A
B
C
D
Figure 4. Top view of the 58 TLS point clouds covering the Espoonlahti test field.
The georeferencing of individual scannings was computed in post-processing: scanner position and heading were obtained from ROAMER’s SPAN –navigation system, and scannings were levelled using the inbuilt inclinometer of the scanner. Virtual GPS reference station data used in GPS post-processing was downloaded from GPSNet.fi-service. SPAN-data was processed using Waypoint Inertial Explorer –software, which gave the estimated accuracies of 11 mm in 3D-position and 0.027 degrees in heading (RMS) for the ROAMER inertial measurement unit (IMU) during the measurements. The offset between the IMU and the scanner origin as well as the offset between the SPAN and the scanner heading were determined in system calibration.
2.2.2 Validation of Reference Point Clouds. ROAMER
data was validated against 150 check points measured using a total station (Trimble 5602S DR200+). For total station setup nine ground control points (GCPs) were measured around the Espoonlahti test field (Figure 5) using repeated real-time -GPS-measurements (Leica SR530). Altogether eight individual measurements on each point were taken, using different reference data sources (RTK-GPS using own reference station and VRS-GPS using virtual reference station) and different satellite constellations (a few hours between the measurements). On every GCP first two sessions were measured using RTK-GPS (accuracy 1 cm + 1-2 ppm in plane and 1.5-2 cm + 2 ppm in elevation (Bilker and Kaartinen, 2001)), and then two sessions using VRS-GPS (accuracy 2 cm in plane and 4 cm in elevation (Häkli, 2004)). Between every session a new initialisation was acquired. This procedure was carried out for a second time after a few hours. GCP-coordinates were then computed as a mean of the obtained eight coordinates. Maximum standard deviation of the eight ‘original‘ coordinates was 23 mm in plane and 30 mm in elevation (average 13 mm and 20 mm respectively).
Figure 5. Nine ground control points were measured around the test site. (Background map data © City of Espoo.)
On most ROAMER –scans the comparison showed that check points and point clouds match to each other within the standard deviation of the GCPs, i.e. a couple of centimetres, but on a few scans there was error in the levelling of the point cloud. On these cases there was a passing bus visible in the scanning data, so it is obvious that a large vehicle has disturbed the scanner inclinometer. These point clouds could be levelled by using neighbouring point clouds and check points.
2.3.2 Reference Targets for Accuracy Analysis. After point
cloud validation, targets for accuracy analysis were measured from a 350 meter long area of the test field section A. TerraScan-software by TerraSolid Ltd. was used for all point cloud operations. First ground points were classified and a regular grid with 5 cm point spacing was computed to achieve an even distribution of ground points. This grid was thinned by selecting every 1000th point, and these thinned points were compared to the original ground points. All thinned points deviating more than 5 mm from original data were removed, and all remaining points were selected as reference points for elevation accuracy analysis.
Reference data for elevation consists of 3283 points, for which also the planimetric distance and direction to all possible driving trajectories were determined. Ground points were used to separate all laser points within 10 cm below and 50 cm above ground, and these close-to-ground points were used to measure reference targets for planimetric accuracy evaluation. These targets include centres of poles, building corners and curb corners. Another one meter thick slice of laser points was taken at approximately five meters above the ground, and these laser points were used to measure more building corners and centres of poles. Altogether 273 planimetric reference targets were measured. Pole coordinates were measured by visually fitting a circle to the point cloud in top view, and the centre of the circle was used as the reference location (Figure 6).
Figure 6. A detail of measured reference pole locations from collected with commercial and research systems (Table 1). With all systems the test site was driven around twice, in clockwise and counter-clockwise direction, at speed of about 30-40 km/h. All systems can collect also image data (still cameras or video), but in this research only laser point cloud data was used.
MLS system Operated by Data acquisition date
Streetmapper 360 3D Laser Mapping June 2011 Optech Lynx TerraTec AS June 2011
Table 1. Tested MLS-systems.
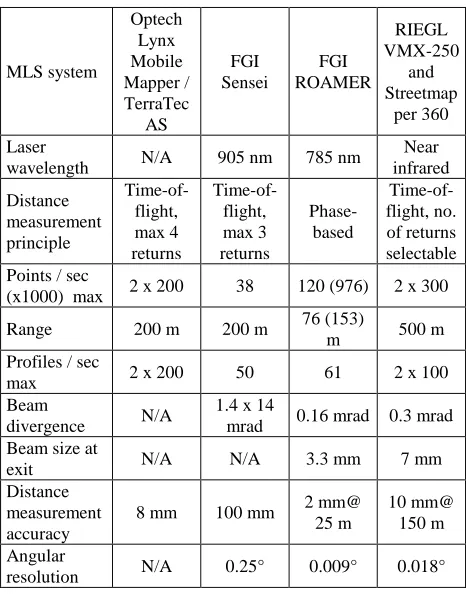
Specifications for tested MLS-systems are given in Table 2. The Faro scanner used in ROAMER was upgraded in 2010, in Table 2 the changed specifications are shown in brackets.
MLS system
Table 2. System specifications, for ROAMER the current values are shown in brackets (Faro, 2008 and 2009; Ibeo, 2011;
Optech, 2011; Riegl, 2011; TerraTec, 2011).
3.2 Methods for Accuracy Evaluation of Mobile Laser Scanning Point Clouds
First all received point clouds were checked by comparing with the reference data to detect any gross errors either in elevation or in plane. If there were larger systematic shift than a few centimetres, this was removed to assure valid comparison, as especially a large systematic shift in plane can lead to distorted elevation accuracy results.
Comparison between the elevation reference points and received point clouds was carried out using the Output control report –tool in TerraScan-software (Terrasolid, 2005). It reads in the reference points and loads every laser point within a given search radius from the individual reference point. Then a small triangulated surface model is created from the laser points and laser elevation is computed for each reference point easting-northing location from the triangulated model surface. This effectively interpolates a laser elevation from three laser points which are closest to a reference point. Search radius used for the most dense point clouds (RIEGL, Streetmapper and Optech Lynx) was 20 cm, for others a search radius of 50 cm was used. Maximum allowed slope in the triangulated model was set to 20 degrees.
Planimetric accuracy was evaluated by measuring the reference targets in the received point clouds and computing the differences in easting and northing. The most deviating values were checked against the ground truth and removed from the analysis if there was any doubt that the error is due to the target, not due to the system. These errors were mainly detected in elevation accuracy analysis due to parked cars or changes in
vegetation. After this ‘gross error filtering’, systematic errors were removed, in plane separately for easting and northing, and accuracy values were computed. Standard deviation values were computed for both elevation and planimetric accuracy.
3.3 Results
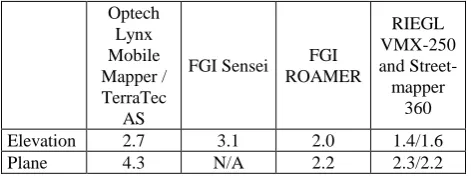
Results of elevation and planimetric accuracy for tested MLS systems are depicted in Table 3. Standard deviation values are the mean of two runs, i.e. the clockwise and counter-clockwise run on the test field. In Sensei the divergence of the laser beam is 14 mrad in horizontal direction when mounted on a car, indicating that objects may appear extended in the horizontal direction. For this reason most of the reference targets for planimetric accuracy analysis could not be reliably measured, and the performance analysis was completed only for elevation accuracy.
Table 3. Elevation and planimetric accuracies (STD) in cm for tested MLS systems.
Result show that all systems can deliver accuracies that meet the requirements for various mapping tasks. Even with the low cost Sensei system, the price of which is less than tenth of the other systems, the accuracy is within a few centimetres in ground elevation determination. More detailed results are given in Kaartinen et al. (forthcoming).
4. CONCLUSIONS AND DISCUSSION
A permanent test field suits well for verifying and comparing the performance of different mobile laser scanning systems. It can also be utilized in data processing development and testing, for example when compiling new algorithms for automatic feature extraction.
The geometric accuracy of MLS derived point cloud in good GNSS conditions can be within 1-2 cm. The relative accuracy can be even higher, when for example individual scanning lines are considered. The commonly used requirement for reference data is that the accuracy should be at least an order of magnitude better than the property to be evaluated. It is clear that this requirement is hard, if not impossible, to fulfil in practice. Robust test field data can still be used to validate the performance of MLS systems in varying measurement conditions, and permanent test field is still the only way to change e.g. due to wear and tear of asphalt, regular updates are required to ensure that reference data and test data are comparable.
REFERENCES
Barber, D., Mills, J. and Smith-Voysey, S., 2008. Geometric validation of a ground-based mobile laser scanning system. ISPRS Journal of Photogrammetry & Remote Sensing, 63 (1), scanning data for future driver assistance systems. In: Proc. 12th Agile Conference, AGILE, Hannover, 2–5 June, pp. 12–45.
Clarke, K.C., 2004. Mobile mapping and geographic information systems. Cartography and Geographic Information Science, 31 (3), pp. 131–136.
El-Sheimy, N., 2005. An overview of mobile mapping systems. FIG Working Week 2005 and GSDI-8—From Pharaos to Geoinformatics, FIG/GSDI, Cairo, 16–21 April. 24 p. (on CDROM).
Faro, 2008. Faro Photon 80 specifications.
Faro, 2009. Faro Photon 120 specifications.
Früh, C. and Zakhor, A., 2004. An automated method for large-scale, ground-based city model acquisition. International Journal of Computer Vision, 60 (1), pp. 5–24.
Graham, L., 2010. Mobile mapping systems overview. Photogrammetric Engineering & Remote Sensing, 76 (3), pp. 222–228.
Haala, N., Peter, M., Kremer, J. and Hunter, G., 2008. Mobile LIDAR mapping for 3D point cloud collection in urban areas— a performance test. International Archives of Photogrammetry, Remote Sensing and Spatial Information Sciences, 37 (Part B5), pp. 1119–1130.
Hassan, T. and El-Sheimy, N, 2008. Common adjustment of land-based and airborne mobile mapping system data. International Archives of Photogrammetry, Remote Sensing and Spatial Information Sciences, 37 (Part B5), pp. 835–842.
Häkli, P., 2004. Practical test on accuracy and usability of Virtual Reference Station method in Finland. FIG Working Week 2004. Conference proceedings. Athens, Greece, May 22-27, 2004. 16 p.
Ibeo, 2011. http://www.ibeo-as.com/
Jaakkola, A., Hyyppä, J., Hyyppä, H. and Kukko, A., 2008. Retrieval algorithms for road surface modelling based on mobile mapping. Sensors, 8 (9), pp. 5238–5249.
Kaartinen, H, and Hyyppä, J., 2006. EuroSDR-Project Commission 3 "Evaluation of Building Extraction", Final Report, In: EuroSDR - European Spatial Data Research, Official Publication, No 50, pp. 9-77.
Kaartinen, H. and Hyyppä, J., 2008. EuroSDR/ISPRS Project Commission II, Tree Extraction, Final Report. EuroSDR.
European Spatial Data Research, Official Publication, No 53, 56 p.
Kaartinen, H., Kukko, A., Hyyppä, J. and Lehtomäki, M. EuroSDR Project Commission II, Mobile Mapping - Road Environment Mapping using Vehicle-based Laser Scanning, Final Report (forthcoming).
Kukko, A., Andrei, C.-O., Salminen, V.-M., Kaartinen, H., Chen, Y., Ronnholm, P., Hyyppä, H., Hyyppä, J., Chen, R., Haggrén, H., Kosonen, I. and Čapek, K., 2007. Road environment mapping system of the Finnish Geodetic Institute - FGI ROAMER. International Archives of Photogrammetry, Remote Sensing and Spatial Information Sciences, 36(3/W52), pp. 241–247.
Kukko, A. and Hyyppä, J., 2009. Small-footprint laser scanning simulator for system validation, error assessment and algorithm development. Photogrammetric Engineering & Remote Sensing, 75 (10), pp. 1177–1189.
Lehtomäki, M., Jaakkola, A., Hyyppä, J., Kukko, A. and Kaartinen, H., 2010. Detection of vertical pole-like objects in a road environment using vehicle-based laser scanning data. Remote Sensing, 2 (3), pp. 641–664.
Lin, Y., Jaakkola, A., Hyyppä, J. and Kaartinen, H., 2010. From TLS to VLS: Biomass Estimation at Individual Tree Level. Remote Sensing, 2(8), pp. 1864-1879. http://www.mdpi.com/2072-4292/2/8/1864/
Lin, Y. and Hyyppä, J., 2011. k-segments-based Geometric Modeling of VLS Scan Lines. IEEE Geoscience and Remote Sensing Letter, 8(1), pp. 93-97.
Manandhar, D. and Shibasaki, R., 2002. Auto-extraction of urban features from vehicle-borne laser data. International Archives of Photogrammetry, Remote Sensing and Spatial Information Sciences, 34 (4), 6 p. (on CDROM).
Optech, 2011. Lynx Mobile Mapper Spec Sheet. http://www.optech.ca/pdf/ Lynx_SpecSheet_110909_web.pdf
Petrie, G., 2010. An introduction to the technology, mobile mapping systems. Geoinformatics, 13 (1), pp. 32–43.
RIEGL, 2011. Datasheet RIEGL VQ-250, http://riegl.com/uploads/tx_pxpriegldownloads/
10_DataSheet_VQ250_13-04-2010.pdf
Shen, Y., Sheng, Y., Zhang, K., Tang, Z. and Yan, S., 2008. Feature extraction from vehicle-borne laser scanning data. In: Proc. International Conference on Earth Observation Data Processing and Analysis. SPIE, Wuhan, 28–30 December. 10 p. (on CDROM).
Steinhauser, D., Ruepp, O. and Burschka, D., 2008. Motion segmentation and scene classification from 3D LIDAR data. In: Proc. IEEE Intelligent Vehicles Symposium. IEEE, Eindhoven, pp. 398–403.
Tao, C.V. and Li, J. (Eds.), 2007. Advances in Mobile Mapping Technology. In: ISPRS Book Series, Vol. 4. Taylor & Francis, 176 p.
Terrasolid, 2005. TerraScan User’s Guide 03.10.2005.
TerraTec, 2011. Report 16.09.2011, Mobile Mapping, Geodetic Institute.
Weiss, T. and Dietmayer, K., 2007. Automatic detection of traffic infrastructure objects for the rapid generation of detailed digital maps using laser scanners. In: Proc. IEEE Intelligent Vehicles Symposium. IEEE, Istanbul, pp. 1271–1277.
Yen, K.S., Akin, K., Lofton, A., Ravani, B. and Lasky, T.A., 2010. Using Mobile Laser Scanning to Produce Digital Terrain Models of Pavement Surfaces. Final report of the Advanced Highway Maintenance and Construction Technology Research Center research project, University of California at Davies. http://ahmct.ucdavis.edu/pdf/UCD-ARR-10-11-30-01.pdf
Yu, S.-J., Sukumar, S.R., Koschan, A.F., Page, D.L. and Abidi, M.A., 2007. 3D reconstruction of road surfaces using an integrated multi-sensory approach. Optics and Lasers in Engineering, 45 (7), pp. 808–818.
Zhao, H. and Shibasaki, R., 2003a. Reconstructing a textured CAD model of an urban environment using vehicle-borne laser range scanners and line cameras. Machine Vision and Applications, 14 (1), pp. 35–41.
Zhao, H. and Shibasaki, R., 2003b. A vehicle-borne urban 3-D acquisition system using single-row laser range scanners. IEEE Transactions on Systems, Man and Cybernetics, 33 (4), pp. 658–666.
Zhao, H. and Shibasaki, R., 2005. Updating a digital geographic database using vehicle-borne laser scanners and line cameras. Photogrammetric Engineering & Remote Sensing, 71 (4), pp. 415–424.
ACKNOWLEDGEMENTS
All participants, i.e. Gerald Zach at RIEGL Laser Measurement Systems GmbH, Iain Lorraine at 3D Laser Mapping, Halvor Holvik, Morten Taraldsten Brunes, Heikki Luukkonen and Jan Biström at TerraTec AS, are gratefully acknowledged for cooperation in the project. Hannu Hyyppä from Aalto University also contributed significantly.