LINE-BASED MULTI-IMAGE MATCHING FOR FAÇADE RECONSTRUCTION
Tee-Ann Teo a, *, Chung-Hsuan Kao b
a
Dept. of Civil Engineering, National Chiao Tung University, Hsinchu, Taiwan 30010 - [email protected]
bDept. of Civil Engineering, National Chiao Tung University, Hsinchu, Taiwan 30010 - [email protected]
Commission III, WGIII/1
KEY WORDS: building, façade, linear feature, multiple images matching.
ABSTRACT:
This research integrates existing LOD 2 building models and multiple close-range images for façade structural lines extraction. The major works are orientation determination and multiple image matching. In the orientation determination, Speeded Up Robust Features (SURF) is applied to extract tie points automatically. Then, tie points and control points are combined for block adjustment. An object-based multi-images matching is proposed to extract the façade structural lines. The 2D lines in image space are extracted by Canny operator followed by Hough transform. The role of LOD 2 building models is to correct the tilt displacement of image from different views. The wall of LOD 2 model is also used to generate hypothesis planes for similarity measurement. Finally, average normalized cross correlation is calculated to obtain the best location in object space. The test images are acquired by a non-metric camera Nikon D2X. The total number of image is 33. The experimental results indicate that the accuracy of orientation determination is about 1 pixel from 2515 tie points and 4 control points. It also indicates that line-based matching is more flexible than point-based matching.
* Corresponding author.
1. INTRODUCTION
Three-dimensional building model is an important geospatial data for a cyber city. A building model not only meets the need of a cyber city but also provides useful information in the domain of Location-Based Service (LBS). OGC (Open Geospatial Consortium) has established a standard format called CityGML for 3D building models (Gröger et al., 2008). The detail of building models in CityGML can be distinguished into LOD 1 (only block model), LOD 2 (with roof structure), LOD 3 (with façade structure) and LOD 4 (with indoor structure). A detailed building model is not only similar to its true appearance, but also facilitates decision making procedures.
As the LOD 1 and LOD 2 models focus on the shape of roof top, airborne sensors are usually selected to generate them. On the contrary, LOD 3 and LOD 4 model which are usually obtained by ground-based sensors, concentrate on the detail of façade and indoor facilities. Regardless of the types of LOD, the core process of model generation is feature extraction for different building structures.
Image matching is a technique to relate the same location in different images. The correspondent features can be extended to three-dimensional features using space intersection technique. The matching algorithms can be classified into three categories, i.e. area-based matching, feature-based matching and hybrid matching. Area-based matching calculates the similarity of gray value while feature-based matching compares the geometric similarity of extracted features. Hybrid matching utilizes the characteristics of both area-based and feature-based matching.
From another point of view, matching strategy can be characterized by the data processing space, i.e., image-based matching (Habib et al., 2003) and object-based matching
(Zhang and Gruen, 2006). Both approaches consider the similarity and geometric constraints simultaneously. The image-based matching starts from an image point of the master image. Then, the corresponding conjugate points are obtained from the slave images. The image point of the master image is fixed in the image-based matching. On the contrary, the object-based matching starts from an object point in the object space. Then, the object point is back-projected to the image spaces and the similarity of images in a specific window will be calculated. The image point for image matching is not fixed in the object-based matching.
The target for image matching can be a point or a line. The linear feature is a high level feature which can provide more geometric properties than point feature. As most of the façades, such as windows and doors, are composed of straight lines, the linear features are more suitable for the façade reconstruction when comparing to the point features.
Several researchers have reported on the line matching for building reconstruction. Baillard et al., (1999) employs geometric constraints for line matching of aerial images based on multiview geometry and photometric similarity. McIntosh and Krupnik (2002) integrate airborne lidar data and aerial images to generate breaklines for digital surface model. The edge matching utilizes several constraints like epipolar lines, angle between lines, and correlation of gray value surround line. Pu and Vosselman (2009) integrate terrestrial lidar and images in a semiautomatic building façade reconstruction. Lidar provides plane features while the image provides linear features. The integration of these two data is able to modelling the façade as well as texture mapping.
Façade reconstruction using close-range images is a challenging problem for several reasons. The scale variety of close-range
images is quite large when compared to airborne vertical images. Moreover, relief displacement caused by façade structure is relatively large when the images are taken from different look directions. Consequently, image matching cannot find the conjugated feature correctly or find it incompletely. The aim of this paper is to solve these problems. This paper uses a coarse building model (i.e. LOD 2 building model without façade structure) to overcome the problem of scale and tilt displacement in object-based matching. We correct the distortion of close-range images using wall of LOD-2. Moreover, multi-view and multi-widow matching strategies are proposed to improve the reliability of image matching.
Figure 1(a) shows an example of a window taken by a hand-held camera. The tilt displacement of window is caused by different camera stations while the relief displacement is caused by the depth of window. The boxes in Figure 1(a) indicate matrixes for image matching. The gray values of the matrixes are different and may affect the correctness of matching. The corrected images are shown as Figure 1(b). This paper uses LOD 2 building model to correct the image displacement for matching. The red boxes in Figure 1(b) indicate the corrected matrixes for image matching. The selection of red box is better than yellow box in Figure 1(a) as it is able to improve the similarity between images.
(a) original images for matching
(b) corrected images matching
Figure 1. An example of a façade structure from original and corrected images.
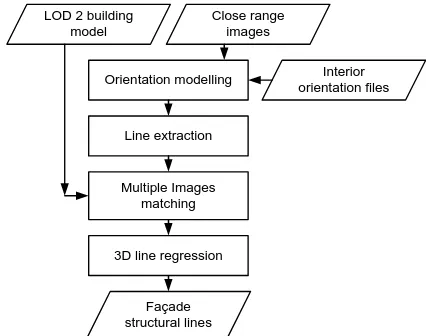
The objective of this paper is to extract the façade structure using multiple close-range images and LOD 2 building model. In order to improve the level of detail of building models, this research develops a façade linear extraction procedure using multi-image matching. The major works are orientation determination, line extraction, multiple images matching, and 3D line regression. In orientation determination, Speeded Up Robust Features (SURF) is applied to extract tie points automatically. Then, the tie points and control points are combined for block adjustment. The line extraction combines canny edge detector and Hough transform to obtain 2D straight line in image space. In multiple images matching, the multiple images are projected to LOD 2 building using different depths. Then, the multiple windows are generated based on the target features. The average of normalized cross correlation is calculated from all object images. Finally, a least squares line regression is used to obtain 3D façade structural lines.
2. METHODOLOGIES
The proposed method includes four major parts: (1) orientation determination, (2) generation of linear feature, (3) multiple images matching, and (4) generation of 3D line. The workflow of the proposed method is shown in Figure 2. The explanations of each step are stated as follows.
Orientation modelling
Figure 2. Flowchart of proposed method.
2.1 Orientation Modelling
Assume that the interior orientation parameters are available. Orientation modelling establishes the relationship between multiple close-range images using tie points and control points. Speeded Up Robust Features (SURF) (Bay et al., 2006) is applied in automatic tie point extraction as it can overcome the scale and rotation effects between close-range images. Then, a large number of automatic-extracted tie points and sparse of manual-measured control points are integrated in bundle block adjustment. As the mismatching is unavoidable in tie point matching, the tie points with large positioning error are removed iteratively in bundle block adjustment.
2.2 Line Extraction
Canny edge detector (Canny, 1986) and Hough transform (Hough, 1962) are used to extract the line features on building façades. Canny edge detector extracts edges by pixel gradient and double thresholds. After the Canny edge detector, the edges of all objects such as the façade texture, trees and surface features in the image are extracted. In order to specify the façade structures in huge amount of edges, Hough transform is applied to extract the straight lines. Hough transform converts each pixel of edges into parametric space, where all pixels are represented as curves. The peak of accumulated curves represents the location of the line which appears most of the times that is the significant straight lines of all edges.
2.3 Object-based Multiple Image Matching
The highly overlapped close-range images provides favourable geometrical configuration with high redundancy. The high similarity between contiguous stereo images is beneficial to the reliable image matching. Hence, the 3D features generated from image matching have a great potential in 3D modelling. The aim of multiple image matching is to consider all the available images for similarity measurement simultaneously. The advantage is not only to increase the measurement from different views, but also to ensure the correctness of matching.
There are two ways to perform multiple image matching. The first one is an image-based method which utilizes the idea of pass point between overlapped images. The matched points on the first stereo pair are passed to the next stereo pair to ensure the correctness. This process will stop when the matched points meet the end of the image strips. The second method is an
object-based method that starts from a set of hypothesis planes in object space. These planes are back projected to different images. Then, each plane is filled with the gray values from an image. Finally, a similarity index is calculated to find the best hypothesis planes. Comparing these two methods, the first one is a sequential processing while the second one is a simultaneous processing. Hence, this research selects the second method for multiple image matching.
In order to generate reasonable hypothesis planes in object space, we use a LOD 2 building model to provide the initial location of façade structure. Besides that, we also have the façade feature from line extraction. The object-based multiple image matching is implemented by selecting a feature in the master image. Then, we use the line-of-sight of the selected feature and LOD 2 building model to derive the intersection point. This intersection point is the initial location of façade structure. A number of rectangles in different depths are then generated based on this initial location. These rectangles are back-projected to images and resampled the gray value. Finally, a number of corrected image chips are generated for further process. Figure 3 illustrates the idea of object-based matching. C1 to C6 denote camera stations. The blue rectangles indicate the hypothesis planes while the red and green lines are the line-of-sight. These hypothesis planes are along the line-of-sight of the master image.
Figure 3. Illustration of object-based matching.
The next step calculates the matching scores from the corrected image chips. The matching score is based on normalized cross correlation (NCC) (Schenk, 1999). A number of NCCs is calculated between the master and slave images at a certain depth. Then, average NCC (AvgNCC) is obtained by equation (1) in different depths. The AvgNCC indicates the similarity between the corrected image chips at a certain depth. We get different AvgNCCs by changing the depth along the line-of-sight. Finally, we choose the maximum correlation as the best hypothesis planes.
Where, IMaster and ISlave are the master and slave corrected image
chips; n is the number of slave image; AvgNCC is average NCC.
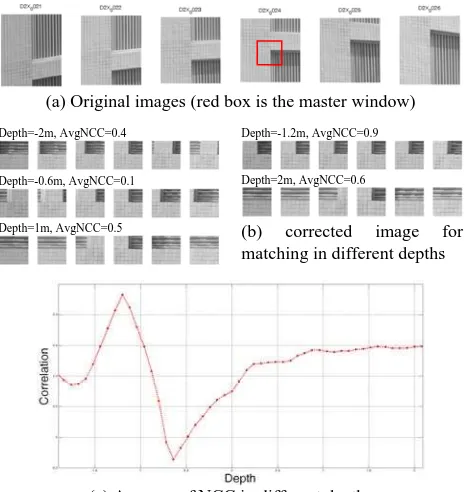
Figure 4 is an example of multiple image matching. Figure 4(a) shows 5 original images. Due to the relief displacement of façade structures, these images look different from different views. The red box indicates the master window for matching. We use different depths to generate the hypothesis planes and the corrected image chips in object space as shown as Figure 4(b). The corrected image chips may correct the tilt displacement of image. Then, the AvgNCC is calculated at different depths as shown as Figure 4(c). In this example, the maximum AvgNCC is located at -1.2m after the wall of LOD 2 building model.
(a) Original images (red box is the master window)
Depth=-2m, AvgNCC=0.4 Depth=-1.2m, AvgNCC=0.9
Depth=-0.6m, AvgNCC=0.1 Depth=2m, AvgNCC=0.6
Depth=1m, AvgNCC=0.5 (b) corrected image for
matching in different depths
(c) Average of NCC in different depths Figure 4. An example of multiple image matching
(a) endpoints matching (b) line matching
(c) edge matching (d) structural lines in different directions
Figure 5. Different matching methods for a line
There are three possibilities to do the matching for a line. The first one only performs matching on the two endpoints of a line. The matching area is shown as Figure 5(a). A 3D line can be reconstructed by 3D endpoints. Multiple image matching is a time consuming process. The advantage of endpoints matching may save the computation time; but, the endpoint should be a well-defined endpoint without occlusion. The second strategy performs matching on a line. The matching window of a line is shown as Figure 5(b). The advantage is that it can cover the whole gray value of a line for matching. The last one is an edge matching, which means, we divide a line into a set of edge’s points. Then, we use every point on the edge for matching. Figure 5(c) shows the idea of edge matching. Comparing the
line and edge matching, the former can only handle 3D lines that are parallel to a wall as the hypothesis plane is parallel to a wall. The latter is suitable for 3D lines in different directions. Figure 5(d) shows two examples of structural lines in different directions.
2.4 3D Line Fitting
For endpoints matching and line matching, we can directly generate 3D lines in object space. However, for edge points matching, a number of 3D points are generated after the multiple images matching. There are two major steps in line regression. In the first step, we use Random Sample Consensus (RANSAC) to obtain the collinear points in object space. The advantage of RANSAC is to remove the outliers in 3D line fitting. We iteratively and randomly select two points to calculate the line parameters, i.e. direction and starting points of a line. Then, we find the maximum cluster in parameter space. The maximum cluster represents the collinear points. In the second step, we use least square adjustment to calculate the optimal lines. Figure 6 is an example of 3D line regression. The red circles are the 3D points from matching. The blue line is the extracted line.
Figure 6. An example of 3D line fitting from 3D points
3. EXPERIMENTAL RESULTS
The test data are multiple close-range images taken by Nikon D2X camera. The target is a façade of a building. The average image scale is about 1/3000. The base-to-depth ratio between the two camera stations is about 1/10. The LOD 2 building model is generated from 1/5000 aerial images. The estimated accuracy of the building model is about 30cm. Table 1 is the related information of the test images.
Table 1. Related information of test images
Date 2011/3/29
Camera Nikon D2X
Number of image 33
Image size(pixel) 4288x2848
CCD size(um) 5.5
Focal length(mm) 18
Spatial resolution(mm) 6
Overlap (%) 90
3.1 Orientation modelling
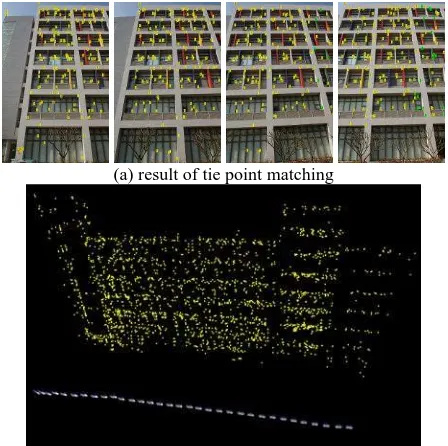
The automatic image matching has generated 2515 tie points. Among these tie points, 2166 points is the intersection of two rays, the remaining points is the intersection of three or more rays. Figure 7(a) shows four images with matched points. The control and check points are collected by a total station. The
number of control and check points are 4 and 26 points, respectively. The mean error of check points in three directions are 3.3, 5.2 and 2.6 cm, respectively. The RMSE of check points in three directions are 4.1, 4.5 and 1.8 cm, respectively. As the Y direction is the look direction of the camera, the error in Y direction is larger than the other directions. Figure 7(b) shows the distribution of camera stations. The yellow points in Figure 7(b) are the object points intersected from tie points.
(a) result of tie point matching
(b) perspective view of camera station and 3D points Figure 7. Results of orientation modelling
3.2 Comparison of Line-based and Endpoints Matching
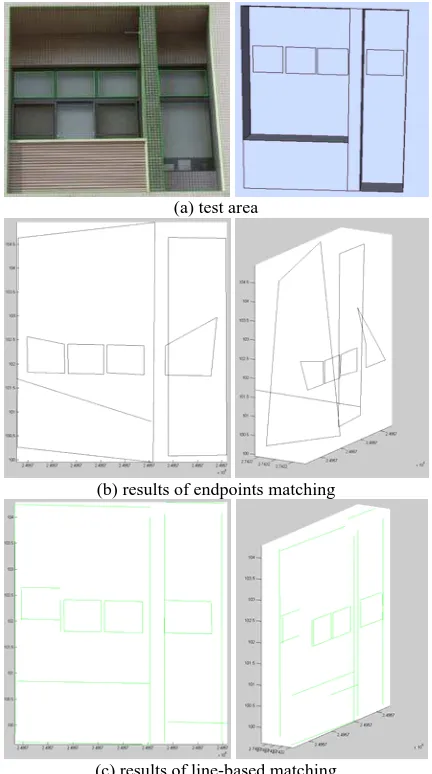
In order to compare the line-based matching and endpoints matching for linear features, we selected a window as a target area for comparison. The target area is about 3.5m by 3.5m in object space. A close-range image is selected as the master image. The linear features on master image are manually digitized at the boundaries of window. The green lines in Figure 8(a) are the digitized lines. Figure 8(a) also shows the shape of the target window in object space. The digitized line on the master image is ray-tracing to the wall of LOD-2 building model, then, back project to other images to find the slave images. Six slave images are automatically selected out of 32 images. The depth for AvgNCC is ranged from -2m to +2m with the step of 0.05m. The window size for matching is 0.21cm by 0.21 cm.
Figure 8(b) is the perspective view of matched lines in object space by endpoints matching. The straight lines on the window are deformed after the matching. The endpoints matching only consider the vertices of a line. Hence, The lack of information caused the distortion of 3D lines. It is especially true when the vertex of a line is occluded by other objects. Figure 8(c) is the perspective view of matched lines in object space by line matching. The results of line-based matching are better than endpoints matching. The shape of extracted lines is more regular when compared to the results of endpoint matching. A few incorrect lines located at the bottom of the window are caused by self-occlusion.
(a) test area
(b) results of endpoints matching
(c) results of line-based matching
Figure 8. Comparison of endpoints and line-based matchings
3.3 Comparison of Line-based and Edge-based Matching
We also select a linear feature to compare the results of line-based and edge-line-based multiple matching. Line-line-based matching utilized the whole line for matching while edge-based matching divided a line into a set of points for matching. The red points in Figure 9(a) indicate the edge’s points while the yellow line in Figure 9(b) is the line for matching. The extracted points and lines by edge-based matching are shown as Figure 9(c). There are a few outliers caused by the insufficient information of matching window in edge-based matching. After line fitting, these outliers are removed. Figure 9(d) is the average NCC in different depths. The highest average NCC reached 0.9. Figure 9(e) overlapped the two extracted 3D lines. Table 2 compares the coordinates of these two lines. The maximum difference is about 4cm. Then, we back project the 3D line from object space to image space as shown as Figure 9(f).
Table 2. Vertices of extracted 3D line
X(m) Y(m) Z(m)
Edge-based P1 249570.52 2742218.16 101.33
P2 249572.76 2742218.11 101.32
Line-based P1 249570.56 2742218.20 101.36
P2 249572.80 2742218.15 101.32
Difference P1 -0.04 -0.04 -0.03
P2 -0.04 -0.04 0
(a) edges (b) line
(c) extracted points and line (d) average NCC and depth
(e) 3D line extracted from edge-based and line-based matching (red: edge-based; green: line-based)
(f) back-projection of extracted line.
Figure 9. Comparison of edge-based and line-based matchings
4. CONCLUSIONS AND FUTURE WORKS
In this research, we have proposed a feasible scheme to obtain the 3D linear features by object-based multiple images matching. We have also demonstrated the orientation modeling by SURF and bundle adjustment. A coarse building model is employed to correct the tilt displacement of the façade structure. It is beneficial to the similarity measurement between images. Moreover, the multi-view images are simultaneously considered in similarity measurement by average NCC (AvgNCC). The AvgNCC is a useful index to locate the highest correlation among master and slave images. The targets for line matching can be endpoints of a line, edge’s points, and line. The experiment indicates that line-based matching is better than point matching while the point is occluded by other objects. The future work will focus on the processing of high similarity repeated textures. As the tiles of the façade usually have high similarity, we will combine the geometric, radiometric and parameters constraints for multiple images matching.
ACKNOWLEDGEMENTS
This investigation was partially supported by the National Science Council of Taiwan under project number NSC 100-2221-E-009 -133.
REFERENCES
Baillard, C., Schmid, C. and Zisserman, A., Fitzgibbon, A., 1999. Automatic Line Matching and 3D Reconstruction of Buildings from Multiple Views, International Archives of Photogrammetry and Remote Sensing, pp. 69-80.
Bay, H., Tuytelaars, T. and Gool, L.V., 2006. Surf: Speeded up Robust Features, European Conference on Computer Vision, pp. 404-417.
Canny, J., 1986. A Computational Approach to Edge Detection. IEEE Transactions on Pattern Analysis and Machine Intelligence, 8(6): 679-698.
Gröger G., T.H. Kolbe, A. Czerwinski, C. Nagel, 2008. OpenGIS® City Geography Markup Language (CityGML) Encoding Standard, Open Geospatial Consortium Inc., URL: http://www.opengeospatial.org/ .[Accessed Feb., 2012]. Habib, A., Lee, Y. and Morgan, M., 2003. Automatic Matching and Three-Dimensional Reconstruction of Free-Form Linear Features from Stereo Images, Journal of Photogrammetric Engineering and Remote Sensing, 69(2):189-197.
Hough, P.V.C., 1962. A Method and Means for Recognizing Complex Patterns, U.S. Patent 3,069,654.
McIntosh, K. and Krupnik, A., 2002. Integration of Laser-Derived DSMs and Matched Image Edges for Generating an Accurate Surface Model. ISPRS Journal of Photogrammetry & Remote Sensing 56: 167-176.
Pu, S. and Vosselman, G., 2009. Building Façade Reconstruction by Fusing Terrestrial Laser Points and Images. Sensors 9, 4525-4542.
Schenk, T., 1999. Digital Photogrammetry, TerraScience, Laurelville, Ohio, 428 p.
Zhang, L. and Gruen, A., 2006. Multi-image Matching for DSM Generation from IKONOS Imagery, ISPRS Journal of Photogrammetry and Remote Sensing, 60(3): 195-211.