EVALUATION OF SPATIAL ACCESSIBILITY TO PRIMARY
HEALTHCARE USING GIS
S. Jamtsho a and R. J. Corner b
Department of Spatial Sciences, Curtin University of Technology, Perth, Australia a
[email protected] b [email protected] Technical Commission II
KEY WORDS: Health accessibility, spatial accessibility, primary healthcare
ABSTRACT
Primary health care is considered to be one of the most important aspects of the health care system in any country, which directly helps in improving the health of the population. Potential spatial accessibility is a very important component of the primary health care system. One technique for studying spatial accessibility is by computing a gravity-based measure within a geographic information system (GIS) framework. In this study, straight-line distances between the associated population clusters and the health facilities and the provider-to-population ratio were used to compute the spatial accessibility of the population clusters for the whole country. Bhutan has been chosen as the case study area because it is quite easy to acquire and process data for the whole country due to its small size and population. The spatial accessibility measure of the 203 sub-districts shows noticeable disparities in health care accessibility in this country with about only 19 sub-districts achieving good health accessibility ranking. This study also examines a number of different health accessibility policy scenarios which can assist in identifying the most effective health policy from amongst many probable planning scenarios. Such a health accessibility measuring system can be incorporated into an existing spatial health system in developing countries to facilitate the proper planning and equitable distribution of health resources.
1. INTRODUCTION
Primary health care (PHC) is an important aspect of the healthcare system in many countries which has helped in administering and managing population health. PHC is relatively inexpensive and can be well distributed to many places, unlike specialist and inpatient hospital care (Guagliardo, 2004). In Bhutan, primary healthcare is delivered to the majority of the population through hospitals, basic health units (BHU) and outreach clinics (ORC). The ease of access to primary healthcare services and availability of primary health care providers are important aspects of the healthcare delivery system (Aday and Anderson, 1981).
Access to healthcare can be segregated in to two parts: potential for healthcare delivery and realized delivery of care (Aday and Anderson, 1981). Potential healthcare refers to the potential need for health care services of all the population within a healthcare servicing region. Realized healthcare refers to the actual utilization of healthcare services by the needy population. Of the five dimensions of the healthcare system, availability and accessibility fall into the spatial category whereas affordability, acceptability and accommodation fall into the non-spatial category (Penchansky and Thomas, 1981). This study will only examine the spatial components of the healthcare accessibility system, which are commonly referred to as spatial accessibility.
There are three important aspects of spatial accessibility to primary healthcare, namely the supply of healthcare providers, the demand for healthcare services and the distance or time impedance between the locations of the population and the health care providers. The supply of healthcare providers and the demand for healthcare services are commonly used to define the provider-to-population ratio which serves as an important indicator by which to gauge the healthcare delivery system. However, provider-to-population ratio does not measure the ease of access to healthcare providers. Travelling distance or
time between the locations of the population and the health care providers is one of the important spatial impedances to the delivery of health care services (McLafferty, 2003; Aday and Anderson, 1981; Penchansky and Thomas, 1981). The impact of the distance to the health care facilities on utilization of health care services has been studied by Hadley and Cunningham (2004), Lovetta et al. (2002) and Fortney et al. (1999). A distance or time impedance factor in combination with the population demand for health care services and the supply of healthcare providers within the healthcare servicing region can be used together to measure the spatial accessibility of a population cluster.
This paper has been structured into four sections. Section 1 provides a general introduction and background information on spatial health accessibility. Section 2 discusses the type and source of data required for computing the accessibility measure, presents a choice of distance measure, formulates the gravity-based computation method, and outlines the method of implementation in ArcGIS. In Section 3 the results of the gravity-based computation of the spatial accessibility is presented by analysing the individual outcome of two different healthcare providers, by conducting combined analysis using both the healthcare providers and by assessing a number of
‘what if’ probable scenarios. Section 4 presents concluding remarks and opportunities for further work.
2. MEASUREMENT OF SPATIAL ACCESSIBILITY
2.1 Data Sources
In this study, location data of the population clusters and health centres, and the count data of the population and the healthcare providers were used for assessing the spatial health accessibility in Bhutan. The census data of Bhutan only has population cluster data at the sub-district level which is too aggregated use in the computation of accessibility measures. So population ISPRS Annals of the Photogrammetry, Remote Sensing and Spatial Information Sciences, Volume II-2, 2014
clusters at a disaggregated level were formed by integrating and collecting population point features within a distance tolerance of 1000 meters. The location of the population cluster is the mean position of all the point events falling within the tolerance value. The population point features were generated from the georeferenced housing and census data using a randomization technique, where individual population points were randomly generated in the close proximity of the location of the settlement houses. The health centres and healthcare provider data were obtained from the National Health Survey 2011 (NHS 2011) database which contains both spatial and non-spatial
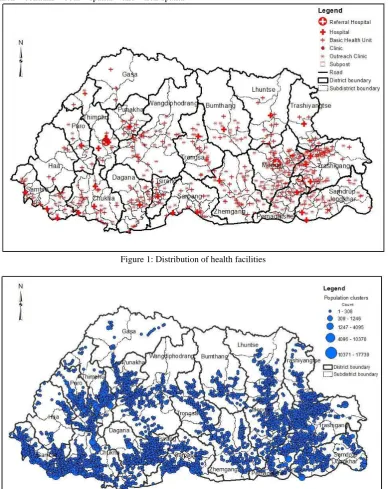
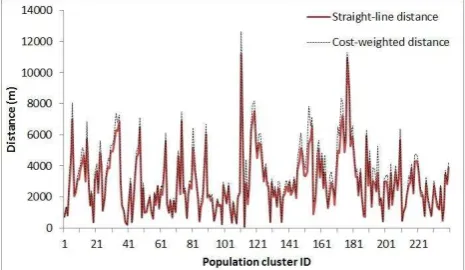
information of health facilities across the country. Figures 1 and 2 show the distribution of population clusters and health facilities in Bhutan respectively. According to the NHS 2011 database there are 28 hospitals, 169 BHUs, 3 clinics, 308 ORCs and 7 sub-posts located across the country which has about 128 doctors and specialists, 520 nurses, 385 health assistants (HA) and 56 basic health workers (BHW). Only the doctors, HA and BHW were used in the computation of the spatial accessibility measure since these healthcare providers are responsible for providing diagnostic health services in Bhutan.
Figure 1: Distribution of health facilities
Figure 2: Distribution of population clusters
2.2 Gravity Model
A number of GIS-based techniques are available to measure accessibility to health care. These include: computation of the
provider-to-population ratio (Brabyn and Barnett, 2004); computation of distance to the nearest provider (Brabyn and Skelly, 2002; Lovetta et al., 2002); computation of average distance of travel time to the provider (Dutt et al., 1986); ISPRS Annals of the Photogrammetry, Remote Sensing and Spatial Information Sciences, Volume II-2, 2014
gravity-based methods (Unal et al., 2007; Joseph and Bantock, 1982; Knox, 1978); the two-step floating catchments area method (Yang et al., 2006); the kernel density method (Yang et al., 2006, Guagliardo, 2004; McLafferty, 2003); and the space-time accessibility technique (Kwan et al., 2003). For Bhutan, the gravity based measurement technique was used to compute the spatial accessibility measure of each population clusters because it is the fundamental formula used in computing spatial accessibility. Other vector-based methods, like the two-step floating catchment, are derived from the gravity formula and they use different weighting models.
The gravity-based accessibility measure at the resident location i was computed as proposed by Weibull (1976), and shown in Equation 1,
n
j j
ij j i
V d S A
1
(1)
where Ai is the gravity accessibility index, n is the total number of healthcare service provider locations, Sj is the number of healthcare providers available at location j, dij is the distance between the locations i and j, β is the decay parameter and Vj is the demand for healthcare services at location j. The demand for the healthcare services in the health centre at location j is derived from the population associated to this health centre, which can be computed using Equation 2,
m k
kj k
j Pd
V
1
(2)
where Pk is the population at location k, m is the total number of population clusters in the computation region and dkj is the distance between the population location k and the provider location j. The straight-line distance such as dij and dkj can be computed for two points, i(x1,y1) and j(x2,y2) using Equation 3.
x2 x1
(y2 y1)dij (3)
2.3 Distance measure
In the absence of the actual pathways and road data between the population clusters and the health centres, the most commonly used distance measures for computing spatial accessibility are straight-line and cost-weighted distances. The straight-line distance is simply a line connecting the locations of the population cluster (origin) and the health centre (destination), computed using Equation 3. The cost-weighted distance is formed by piecing together a series of line segments modelled by using a digital elevation model, land use/land cover data, and the origin and destination points.
The least cost path or cost-weighted distance between two points can be computed by modelling the travel impedance costs due to the slope and type of the land use of the area. That is, higher slopes were weighted as more costly than the lower slopes and land use areas subject to human intervention as less costly than areas without intervention. Figure 3 shows the process model for computing the cost-weighted distance using spatial tools in ArcGIS 10.1 and Figure 4 shows the cost-weighted lines between the population clusters and health centres in the Trashigang district.
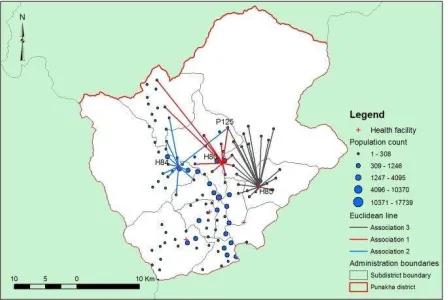
Figure 3: Process model for computing the least cost path
Figure 4: Least cost paths
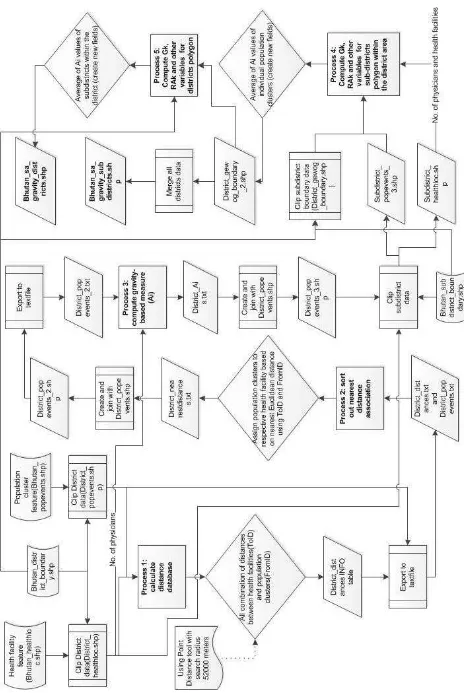
The cost-weighted distance measure is generally expected to be more accurate than the straight-line distance (Sander et al., 2010). Figure 5 shows the plot of differences between the cost-weighted and the straight-line distances. The average difference is 374 meters with maximum and minimum differencse of 2411.01 and .0008 meters respectively. The cost-weighted distances were highly correlated with the straight-line distances (Pearson correlation coefficient of 0.99), which indicates that these two distance measures are very similar. Due to the very high similarity between the distance measures, either one is sufficiently accurate for the computation of the spatial accessibility measure. However, the computation of cost-weighted distance measure can be computationally intensive and time consuming so the straight-line distance measure was chosen for computing the spatial accessibility measure.
Figure 5: Differences between the cost-weighted and straight-line distances
Figure 6: Processing steps for computing the spatial accessibility measure
2.4 Implementation in ArcGIS
The gravity-based computation method is based on the assumption that the residents within a region may seek health services from other health facilities besides the one nearest to their location. In this study only the two nearest health facilities were associated to each population cluster within the computation region, as the use of more than the two nearest health centres caused a huge distance disparity since some of the population clusters are very far away from their third closest facility . The computation region is defined as the district region for the HA and BHW case because the health assistants are available at all the health centres and it is defined as the whole country for doctors case because the services of doctors are generally available only at the district-level health centres due to the acute shortage of doctors in the country.
The gravity-based computation method was implemented exclusively in ArcGIS 10.1 using Python programming. Figure 6 shows the processing steps for computing gravity-based potential spatial accessibility measure for all population clusters within a computation region. There are five processing steps in this method which are described as follows. In Process 1, all possible combinations of straight-line distances between the health facilities and the population clusters were computed using the Point Density tool. A distance threshold value of 52000 meters was used so that at least one health facility will be associated with each population cluster because the largest distance observed between a population cluster and its nearest health facility was about 52 Km. In Process 2, each population cluster was associated with the two nearest health facilities within the computation region using the distances database obtained in Process 1. Figure 7 shows the schematic representation of straight-line distances between population clusters and the associated health facilities. The population cluster, P125 is associated to H80 and H85 health centres whose healthcare providers would serve the population in this cluster.
Figure 7: Straight-line distances between population clusters and health facilities
Process 3 deals with the computation of gravity measure for each population cluster. Firstly, the Vj values of each health facilities within the computation region were computed using Equation 2 where m is equal to the number of population clusters associated to it in accordance to the first two nearest distance condition. Secondly, Ai values of each population clusters were computed using Equation 1 where n is equal to the total number of associated health facilities to each population clusters, i.e. 2.
In Process 4, the spatial accessibility measure was computed at the sub-district level by computing the average of the Ai values of all the individual population clusters located within this sub-district region using Equation 4, the gravity-based accessibility measure of the population cluster at location i and p is the number of population clusters within the sub-district k. Then the Gk values can be transformed into a relative accessibility measure (RAk) using Equation 5,
k transformation process ensures the re-scaled values lie between 0 and 1 where 1 refers to the highest health care accessibility and 0 refers to the lowest accessibility. Therefore the RAk values can be used to rank the health accessibility of regions. In Process 5, the spatial accessibility measure was computed at the district level by computing the mean of the accessibility measures of population clusters within the district region. The relative accessibility measures for the districts can be computed using Equation 5.
3. DISCUSSION OF RESULTS
3.1 Individual analysis
The accessibility ranking values obtained from Process 4 and 5 at the sub-districts and district level respectively were used to produce choropleth maps (Figures 8 and 10). Figure 8 shows district and sub-district accessibility rankings for the whole country for the HA and BHW case. Bold numbers refers to the district ranking while the non-bold numbers represent the ranking of the sub-districts.
Figure 8: Districts and sub-districts accessibility ranking map for HA and BHW
Gakiling sub-district of the Haa district has the highest rank (Rank 1) and the Naro sub-district of the Thimphu district has the lowest rank (Rank 203). The ranking of Gakiling and Naro sub-districts can be explained based on the distance proximity between the population clusters and their two associated health
(5) ISPRS Annals of the Photogrammetry, Remote Sensing and Spatial Information Sciences, Volume II-2, 2014
facilities. Figure 9 shows that the Gakiling sub-district has three population clusters with the first health facility located in the close proximity of these clusters and the second health facility located not too far away in the Sombeykha sub-district. The close proximity between the population clusters and the two health facilities and relatively small population size of 104 people have resulted in Gakiling sub-district being ranked with the highest accessibility in the nation. In contrast, Naro sub-district has three population clusters with no close health facilities. The two nearest health facilities to its population clusters are located in Lingzhi, Khamae and Kawang sub-districts which are far away from the residents of Naro. The longer distance between the population clusters and the two nearest health facilities have caused Naro being ranked lowest in the country. At the national level, Haa district ranks highest (Rank 1) due to the presence of very favourable ranked sub-districts and the Pemagatshel district ranks lowest (Rank 20) because of its poorly ranked sub-districts ranging from Rank 97 to 200.
Figure 9: Distribution of population clusters and health facilities for Gakiling and Naro sub-districts
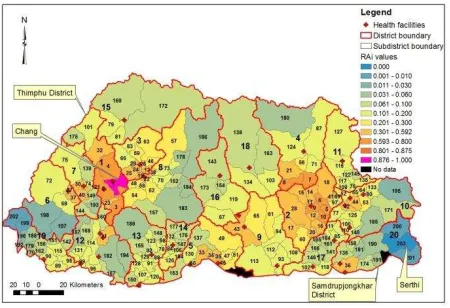
Figure 10 shows the district and sub-district accessibility rankings of the whole country for doctors. Chang sub-district in the Thimphu district has the highest rank (Rank 1) and the Serthi sub-district in the Samdrupjongkhar district has the lowest rank (Rank 203). Thimphu district has the best accessibility for doctor's services while Samdrupjongkhar has the lowest accessibility because of the presence of poorly ranked sub-districts in the later district.
Figure 10: District and sub-districts accessibility ranking map for doctors
3.2 Combined Analysis
The sub-districts are classified into good, medium and poor accessibility categories based on accessibility values of both the
health care providers using a classification method described by Unal et al. (2007). Median and average values of all Gk values of the sub-districts for both the providers were used to classify sub-districts into three classification categories. A poor status indicates that Gk value of the sub-district is lower than the national median value for both the providers. A medium status indicates that the Gk value of the sub-district is greater than the national median value but less than the national average value for both the providers. A good status indicates that the Gk value of the sub-district is greater than the national average value for both the providers.
Figure 11 shows classification of all sub-districts into three accessibility categories. There are 50 sub-districts with poor accessibility to both the service providers, 134 sub-districts that have a medium level of accessibility and 19 sub-districts with good accessibility to both providers. About 24 percent of
Bhutan’s population of 640,000 falls into the poor access category, 64 percent falls into the medium access category and 12 percent have good access. Samtse has 9 sub-districts with poor accessibility rankings followed by Pemagatshel with 8 districts, and Samdrupjongkhar and Chukha with 6 sub-districts each.
Figure 11: Classification of sub-districts using Gk values of both the providers for the reference system
3.3 ‘What if’ Scenario Analysis
Two different spatial health accessibility policy scenarios were examined for both the providers. In Scenario 1, a study was conducted by assuming two different incremental options for increasing health care providers in the health system. In the HA and BHW case, this scenario examines the effect of doubling or trebling the number of providers at each health facilities. In the case of doctors, this study examines what happens when the minimum number of doctors in each of the health facilities is three or five. The difference in the incremental option for the two provider groups is that doctors are not as readily available as HA and BHW, thus the doubling and trebling method was not used for the doctors’ case.
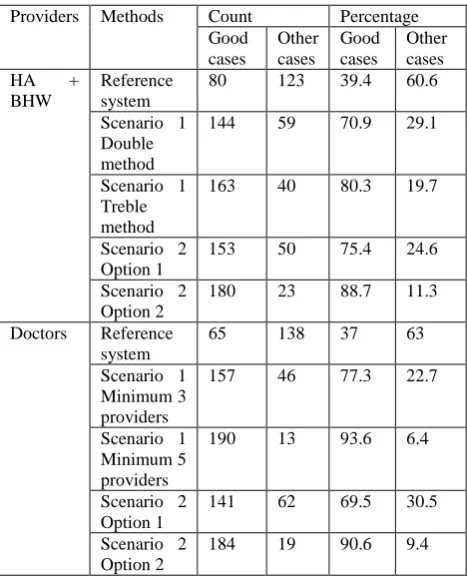
Table 1 shows the accessibility results from all different scenarios. In order to assess the performance of the various policy scenarios the results from the reference system were used as a basis for comparison. The number of sub-districts which would attain good accessibility rank increases from 39.4 percent to 70.9 and 80.3 for the doubling and trebling methods respectively for the HA and BHW case. In the case of the doctors, the number of sub-districts which would attain good accessibility rank increases to 77.3 and 93.6 from 37 percent for ISPRS Annals of the Photogrammetry, Remote Sensing and Spatial Information Sciences, Volume II-2, 2014
a minimum of 3 and 5 doctors respectively.
In Scenario 2, a study was conducted by increasing both the health facilities and health care providers in the health system. As in Scenario 1, two different processing methods were used for Scenario 2. For the HA and BHW case, new health facilities were created using population clusters of the underserved areas by integrating and collecting the population clusters within a 5000 meters cell size. Option 1 involves 74 new health facilities with one health provider each, in addition to the existing facilities and providers. Option 2 also involves 74 new health facilities with a minimum of three health providers in every health facility. The number of sub-districts which would attain good accessibility rank from 39.4 percent increases to 75.4 and 88.7 for Options 1 and 2 respectively.
Table 1: Accessibility results of different policy scenarios
Providers Methods Count Percentage Good
In the case of doctors, Scenario 2 examines what happens when 19 additional health facilities and a varying number of additional doctors are added to the current health system. Option 1 adds 19 additional health facilities with one doctor each, whose locations were identified from a clustering process using a cell size of 15000 meters by integration and collection process. Option 2 consists of 19 additional health facilities and assumes a minimum of three doctors in all health facilities. With the increase in the number of health facilities and doctors, the number of good accessibility ranked sub-districts also increases. The number of sub-districts which would attain good health accessibility increases from 37 percent to 69.5 and 90.6 for Options 1 and 2 respectively.
Figures 12 and 13 show the classification of sub-districts into good, medium and poor ranking groups for the different scenarios. The classification was done by comparing the Gk values of different scenarios with the mean and median values of the reference system. Only the four best scenario combinations between the two groups were chosen out of many possible combinations. These proposed health policy scenarios
do improve the spatial health accessibility across the country when compared to the reference system classification results presented in Figure 11.
Figure 12: Classification of sub-districts - Scenario 1 Minimum 5 Doctors and Scenario 2 Option 2 for HA and BHW (Left), Scenario 2 Option 2 for doctors and Scenario 1 Treble method for HA and BHW (Right)
Figure 13: Classification of sub-districts - Scenario 1 Minimum 3 doctors and Scenario 2 Option 1 for HA and BHW (Left), Scenario 2 Option 1 for doctors and Scenario
1 Double method for HA and BHW (Right)
The number of sub-districts in the good, medium and poor accessibility categories for the four selected scenario combinations is depicted in the figures above. Based on the number of sub-districts in the good, medium and poor categories Scenario 1 Minimum 5 doctors with Scenario 2 Option 2 for HA and BHW produced best results followed by Scenario 2 Options 2 for doctors with Scenario 1 Treble method for HA and BHW, then Scenario 1 Minimum 3 doctors with Scenario 2 Option 1 for HA and BHW and finally Scenario 2 Option 1 for doctors and Scenario 1 Double method for HA and BHW.
4. CONCLUSION
One of the main goals of the health system in Bhutan is to achieve 100 percent coverage of primary healthcare services in the country. However, no concrete scientific method has yet been established to define and measure the primary healthcare coverage in this country. It is possible to achieve nationally or universally accepted healthcare coverage by spatially planning the location of health facilities and health care providers based on the population demand for the health services and the commuting distance between the locations of the healthcare providers and the population. The benefit of spatial accessibility planning is that an equitable geographic distribution of health care providers and facilities can contain the cost of health services by minimizing oversupply and at the same time increase the equity of access to health services for medically underserved areas (Yang et al., 2006).
This paper demonstrates the use of a gravity-based spatial accessibility measure for assessing the spatial distribution of health care providers at regional and national scale in Bhutan. A simple straight-line distance measure was used to define travel distance between the locations of population clusters and of health care providers. Then a gravity-based computation method, which takes into account the travelling distance between the locations of the resident and the healthcare providers, as well as supply and demand of healthcare services was used to determine a regional and national health accessibility measure. It was found out that Haa district ranked first in the country for health accessibility to HA and BHW while Thimphu district ranked first for accessibility to doctors. Samtse district is the most medically underserved region, based on the classification method used in this study.
This type of study can be potentially be used for long term planning of the distribution of health facilities and health care providers by analysing a number of ‘what if’ policy scenarios. Two scenarios were formulated here to study the implication of increasing the number of health facilities and health care providers. Even a simple increase in the number of health care providers by one or two in every health facility would increase the number of sub-districts ranking as having good accessibility by 30 percent. Therefore the findings of this study will help health care policy makers and planners to understand the existing health care system of Bhutan, to identify medically underserved areas for both doctors and lower level health care providers and to formulate future policies to reduce health accessibility disparities across the country.
In order to deploy the proposed health accessibility measuring system at the regional level, it is very important to build a standalone software application system so that the health planners at the districts and sub-districts level can use the system during planning process. It is also important to develop an open source GIS-based system as the local health organizations in developing countries are unable to procure expensive proprietary software due to budget constraints. Therefore the next phase of this research is to conceptualize and develop a spatial decision support system to facilitate evidence-based planning and distribution of health resources using an open-source GIS application platforms and libraries.
ACKNOWLEDGEMENTS
This research has been supported by an Australian Government Endeavour Postgraduate Award to Sonam Jamtsho to study for his PhD in Geographic Information Science.
REFERENCES
Aday, L. and Anderson, R., 1981. Equity of access to medical care: a conceptual and empirical overview. Medical Care 19(12), pp. 4-27.
Brabyn, L. and Barnett, R., 2004. Population need and geographical access to general practitioners in rural New Zealand. New Zealand Medical Journal, 117(1199), pp. 1-3.
Brabyn, L. and Skelly, C., 2002. Modeling population access to New Zealand public hospitals. International Journal of Health Geographics, 3(1), pp. 1-9. beneficiaries. Medical Care, 37(9), pp. 884-93.
Guagliardo, M. F., 2004. Spatial accessibility of primary care: concepts, methods and challenges. International Journal of Health Geographics, 3(3). http://www.ij-healthgeographics.com /content/3/1/3 (7 Mar. 2014).
Hadley, J. and Cunningham, P., 2004. Availability of safety net providers and access to care of uninsured persons. Health Services Research, 39(5), pp. 1527-547.
Joseph, A. E. and Bantock, P. R., 1982. Measuring potential physical accessibility to general practitioners in rural areas: A method and case study. Social Science and Medicine, 16(1), pp. 85-90.
Knox, P., 1978. The intra-urban ecology of primary medical care: Patterns of accessibility and their policy implications. Environment and Planning A, 10(4), pp. 415-435.
Kwan, M.-P., Janelle, D. G. and Goodchild, M. F., 2003. Accessibility in space and time: A theme in spatially integrated social science. Journal of Geographical Systems, 5(1), pp. 1-3.
Lovetta, A., Haynesa, R., Sunnenberga, G. and Galeb, S., 2002. Car travel time and accessibility by bus to general practitioner services: A study using patient registers and GIS. Social Science and Medicine, 55, pp. 97-1111.
McLafferty, S. L., 2003. Population need and geographical access to general practitioners in rural New Zealand. New Zealand Medical Journal, 117(1199), pp. 1-13.
Penchansky, R. and Thomas, J. W., 1981. The concept of access: Definition and relationship to consumer satisfaction. Medical Care, 19(2), pp. 127-140.
Sander, H. A., Ghosh, D., van Riper, D. and Manson, S. M., 2010. How do you measure distance in spatial models? an example using open-space valuation. Environment and Planning B, 37, pp. 874-894.
Unal, E., Chen, S. E. and Waldorf, B. S., 2007. Spatial accessibility of health care in Indiana, Working Papers 07-07, Department of Agricultural Economics, Purdue University, Indiana, USA. http://ageconsearch.umn.edu/bitstream/7329/2/ wp070007.pdf (10 Feb. 2014).
Weibull, J. W., 1976. An axiomatic approach to the measurement of accessibility. Regional Science and Urban Economics, 6, pp. 357-379.
Yang, D. H., Goerge, R. and Mullner, R., 2006. Comparing GIS-based methods of measuring spatial accessibility to health services. Journal of Medical Systems, 30(1), pp. 23-32.