THE EXAMPLE OF USING INTENSITY ORTHOIMAGES IN TLS DATA
REGISTRATION
–
A CASE STUDY
J. S. Markiewicz
Division of Photogrammetry, Remote Sensing and GIS, Faculty of Geodesy and Cartography, Warsaw University of Technology - [email protected]
Commission II
KEY WORDS: cultural heritage, TLS registration, feature-based method, SIFT, orthoimages, accuracy
ABSTRACT
The paper presents the orientation analysis of terrestrial laser scanning (TLS) data. In the proposed data processing methodology, point clouds are considered as panoramic images and orthoimages enriched by depth maps. Computer vision (CV) algorithms were used for the orientation; they were applied to test the correctness of the detection of tie points, as well as the accuracy, number and point distribution. For the source data, point clouds acquired from the terrestrial laser scanner Z+F 50063h for the two chambers in the Museum of King John III’s Palace in Wilanów were utilized.
1. INTRODUCTION consists of the determination of orientation parameters: three rotation angels and three elements of the linear transformation. For this purpose, the 3D affine transformation is performed. It is also possible to apply the similarity transformation in 3D, when a scale difference exists between the exterior and the scanner co-ordinate systems. This transformation is performed based on control points, which should be evenly distributed across the entire area of the common cover of point clouds. At least three points are required for this purpose; when their number is increased, redundant observations are generated, allowing gross errors to be eliminated and increasing orientation accuracy. The Point-Based Registration method is mostly applied for the registration of TLS data (Vosselman, Mass, 2010). This method has two different types: the Target-Based and ICP methods. The Target-Target-Based method is the conventional approach to the Point-Based orientation, which is usually performed using measuring points, which are earlier distributed ion the object. Another commonly applied method of TLS data orientation, is the iterative method to detect the closest pairs of points in the clouds being compared (ICP) (McKay, 1992). The ICP algorithm requires a good first approximation in order to converge to a global minimum. However, even if there is considerable overlap, convergence to a global minimum is not guaranteed. The ICP algorithm can also be computationally intensive and time-consuming in its search for conjugate points in overlapping scans (Kang et al., 2009; Sequeira, 1999). At present, research that aims to eliminate measuring marks from the orientation process is being performed, and recent works are focused on the registration of TLS point clouds, based on their estimated shapes on scans. Existing approaches are based on the detection of corresponding characteristic features in a point cloud, such as lines or planes. Methods utilizing detectors 3D keypoints descriptors are also used (Theiler et al., 2013; Theiler et al., 2014.). A different approach applied for point cloud orientation is the use of raster images, generated on the basis of TLS data and the successive use of image processing algorithms, applied in the CV to identify conjugate points.
2. RELATED WORKS
Modern software packages dedicated to processing terrestrial and aerial photographs utilize algorithms based on a combination of methods commonly applied in ComputerVision (CV), as well as algorithms applied in conventional photogrammetric works. Algorithms applied for those purposes allow for the complete automation of orientation and data processing. At present, attempts to use such solutions for the automatic orientation of TLS data and integration with other data sources are being carried out.
Unfortunately, all of the algorithms have been designed for images projected in the central projection. Such an approach assumes that standard image deformations might be expected. In the case of spherical photographs, acquired based on terrestrial laser scanning data, image deformations are big enough to generate problems concerning explicit identification and matching keypoints (Markiewicz et al., 2015; Markiewicz, 2015). It seems that the problem could be solved by transforming a point cloud into the form of "a virtual photograph in the central projection" (Moussa, et al 2012) by transforming the scan into an orthoimage (Markiewicz et al.,
2015) or the use of descriptors which consider affinity, such as the ASIFT algorithm (Yu and Morel, 2011).
3. ORTHOIMAGE GENERATION
Orthoimages are attractive for archaeological and architectural documentation, as they offer a combination of geometric accuracy and visual quality, and can also be applied to different measuring techniques. Two main approaches to orthoimage generation exist. The first one is based on TLS data and using terrestrial photographs. Despite its many advantages, the TLS technique also has a lot of limitations, such as problems with acquiring sharp edges, poor quality or reflective surfaces, etc. The second approach to orthoimage generation consists of only using terrestrial photographs, processed using software based on Computer Vision (CV) algorithms.
The conventional approach to orthoimage generation is based on processing a terrestrial photograph via the orthorectification process. This process consists of processing a photograph based on a digital surface model (DSM); as a result, deformations caused by distortion and the influence of the central projection can be eliminated. Photographs in orthogonal projection are obtained as a result of such processing. The most important stage in the generation of orthoimages is the interpolation of the digital surface model. generated orthoimage is georeferenced; XZ co-ordinates are determined for each pixel of the image, and the Y co-ordinate is determined from the depth map. When the point cloud is represented by means of an orthoimage, it does not have geometric deformations, as is the case for spherical images.
As a result, data are recorded in an ordered way, the generation of the DSM in GRID form is not a problem and there is no need to interpolate new pixel values. Disadvantages of this approach include the issue of the detection and interpolation of a reference plane, as this is the basis of DSM generation. A description and comparison of different algorithms for detecting reference planes was presented in the paper entitled A New Approach to the Generation of Orthoimages of Cultural Heritage Objects—Integrating TLS and Image Data (Markiewicz et al., 2015)
4. TLS DATA ORIENTATION - PERFORMED EXPERIMENTS
The author of this paper has closely co-operated with the Museum of King John III’s Palace in Wilanów in conservation works, as well as in other projects. The development of metric documentation for complicated historical objects requires an automated technological process to be implemented. One of the most important products used at the museum is the orthoimage. Based on this experience, the orthoimage generation process has been automated. In order to increase the accuracy of point cloud orientation, orthoimages acquired from non-oriented point clouds were utilized.
Data orientation using spherical images from processing TLS point clouds was also selected. Thanks to this, it was possible to compare the results obtained from two independent methods.
4.1. Characteristics of the source data
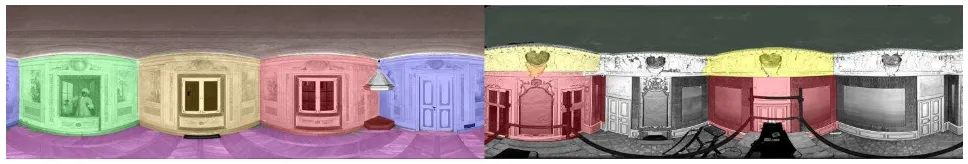
Point clouds from the two chambers in the Museum of King John III’s Palace in Wilanów were used for the analysis. Data were acquired using two different terrestrial laser scanners: Z+F 5006 and 5003. The resolution of the acquired data was equal to 6 mm/10 m. The maximum point cloud range was equal to 360/310 and the distance between the scanner station and the object was 2 to 10 m. In the first step, the acquired data were initially filtered by the reflectance intensity. Additionally, control points commonly applied in TLS data orientation were located on the second test site. The first test site is characterized by a number of adornments such as bas-reliefs, facets or fabrics hanging on the walls. The walls are painted with spatial patterns (Fig. 1a). The second test site is more geometrically complicated. It has rich adornments, such as bas-reliefs, facets or fabrics on the walls. Additionally, mirrors in golden frames and decorative fireplace are located in some sections of the walls (Fig. 1b).
Figure 1: Point clouds of the test sites 1a and 2b in spherical projection, with fragments of the utilized orthoimages marked
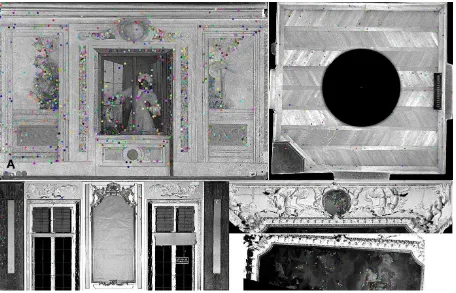
Figure 2: An example of the distribution of control points in images: a) the first test site, b) the second test site
4.2. The orthoimage generation process
The first stage consisted of detecting planes in the point cloud. For that purpose, the transformed Hough algorithm was applied as described in the paper A New Approach to the Generation of Orthoimages of Cultural Heritage Objects—Integrating TLS and Image Data (Markiewicz et al., 2015). Using this data it was possible to automatically generate an orthoimage using LupoScan software. A point cloud of 3 mm resolution was used. Thus, it was not possible to generate an orthoimage with a GSD smaller than 3 mm. The following input parameters were assumed:
• NN interpolation;
• assumed deviation of the automatically generated plane = 5 cm;
• buffer of projected points = ± 3 * 5 cm; • resolution of generated object = 3 mm.
Additionally, depth information was recorded for each orthoimage, as well as information concerning the laser-beam reflectance intensity.
Fig. 2 presents examples of orthoimages applied for the orientation of terrestrial laser scanning data.
4.3. Keypoint detection and description
In order to search for tie points, the SIFT detector and descriptor were applied. Resulting from the use of orthoimages of walls, the point cloud was divided into fragments. This allowed for the detection of evenly distributed points within the entire scan area. Fig. 2 demonstrates examples of orthoimages with tie points (colour dots).
In order to check the correctness of the detected points, as well as to evaluate the accuracy of the point cloud orientation, the accuracy analysis was performed on check points and control points, and the deviations between point clouds were checked. At the first stage, where incorrect points were eliminated from
the set of conjugate points (detected by means of the above algorithms) the iterative method, based on the least square method, was applied.
As a criterion for the correct point determination, the value of the difference between the value calculated in the least square adjustment process and the nominal value, smaller than the scanning resolution (equal to 5 mm), was assumed.
When analysing historical objects, it is not possible to distribute any points marked on the object's surface. In the presented solution, it is proposed to utilize certain automatically detected points as check points. For that purpose, an algorithm was developed which allows for the appropriate selection of points from a set of earlier detected points, evenly distributed across the entire object. The diagram of operations may be presented in four steps:
1. A raster (spherical) image is divided into four equal parts.
2. For each analysed image quarter, the number of points is checked. If it is greater than four, every fourth point is selected.
3. XYZ co-ordinates are determined for each point, based on pixel co-ordinates.
4. Other points are considered as control points.
In cases where orthoimages are applied, the algorithm for division into check points consists of four stages:
1. Each image is divided into four parts
2. For each analysed image quarter, the number of points is checked. If it is greater than four, every fourth point is selected.
3. XYZ co-ordinates are determined for each point, based on pixel co-ordinates.
Test site I
The first stage consisted of testing the number of correctly detected keypoints. Tab. 1 presents the results for particular orthoimages and for the spherical image.
Tab. 1 The number and percentage of correctly detected keypoints
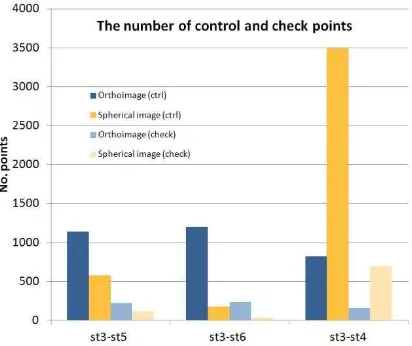
It may be noticed from Tab. 1 that the number of points detected in the orthoimages in these two cases is higher than in the case where spherical images are applied. The smaller number of points in spherical images results is due to the scanner being positioned closed to the wall, resulting in the effect of image "distortion". This geometric deformation may be eliminated by using orthoimages. Position four of the scanner was located close to position three. Only the scanning height was changed; as a result, more points were detected in the spherical images than when orthoimages were used. When the keypoints distribution is analysed, it may be noticed that when spherical images were utilized, the SIFT algorithm incorrectly detected points on the floor and ceiling. Fig. 3 presents diagrams of the numbers of detected control and check points.
Figure 3: The numbers of control and check points detected in spherical images and orthoimages (Test site I)
Test site II
Similar to Test site 1, the number of points detected in spherical images and orthoimages was tested during the first stage. The results are presented in Tab. 2.
Tab. 2 The number and percentage of correctly detected keypoints
Tab. 2 shows that, in the case of the point cloud representation in the form of orthoimages being applied, the number of correctly detected and matched points is considerably higher than when applying spherical images. Terrestrial laser scanning data were not acquired with the full angular resolution. As a result, the SIFT algorithm for spherical images with "distortion" was incorrectly matching features detected in pairs of orthoimages. By representing the point cloud in the form of orthoimages, it was possible to eliminate the impact of that error. This resulted in the increased number and matching of detected points.
Similar to Test site 1, the use of orthoimages influenced the correct detection of keypoints on facets, the floor and the ceiling. Fig. 4 presents the diagrams of the numbers of detected control and check points.
Figure 4: The numbers of control and check points detected in spherical images and orthoimages (Test site II)
4.4. Accuracy analysis of results
In order to analyse the accuracy of terrestrial laser scanning data, the orientation values of deviations were tested for the control and check points.
Test site I
Tab. 3 presents the results of the orientation on the control points. When Tab. 3 is analysed, it may be noticed that the accuracy of the orientation of point cloud fragments (walls) are similar. When spherical images are used, the accuracy of the orientation is insignificantly lower. It results from the uncomplicated geometry of the objects (straight, unadorned walls).
Tab. 3 RMSE of the orientation of point clouds on the control points.
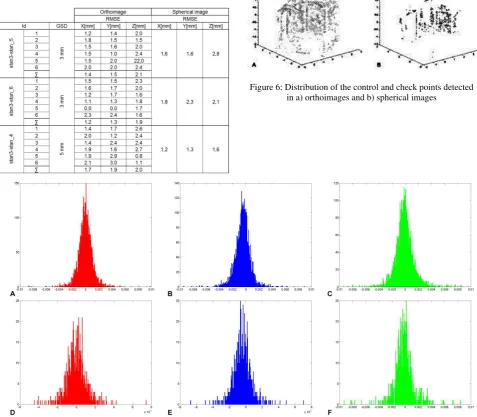
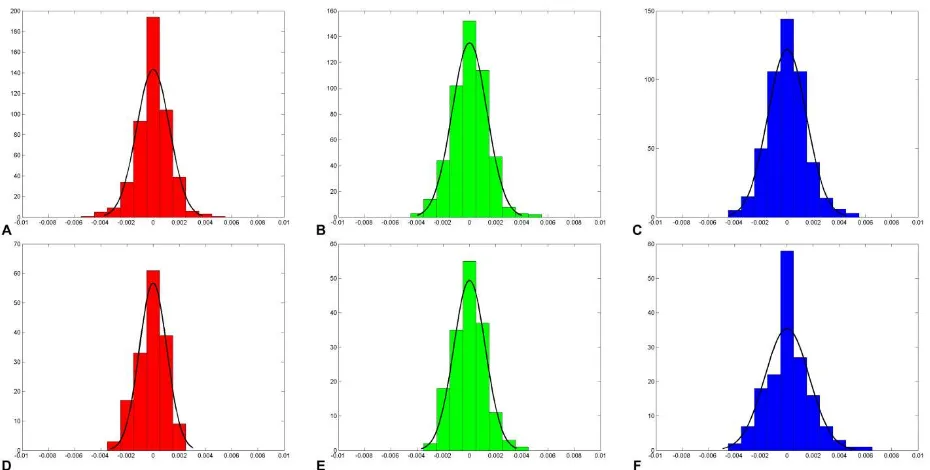
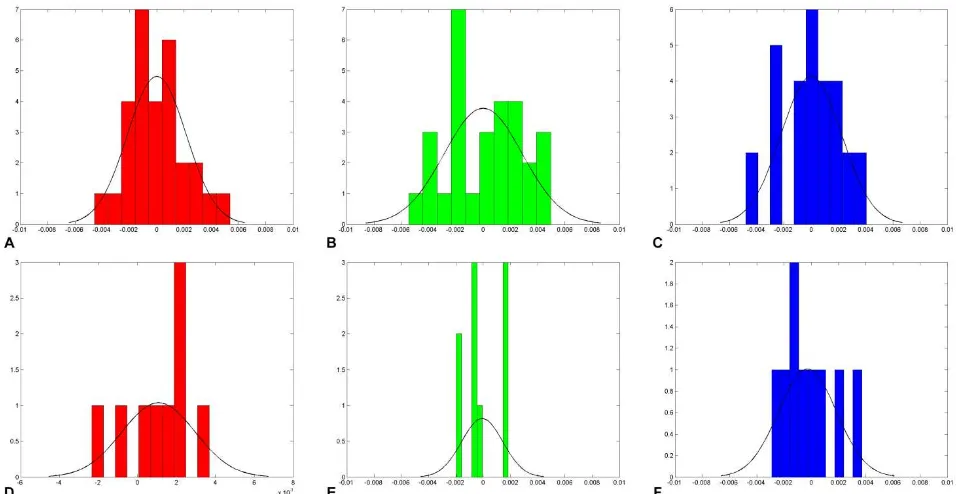
The distribution of errors, based on histograms of the deviations of the control and check points, was analysed. An example is presented in Fig. 5. Fig. 6 presents the spatial distribution of points detected using both methods.
Intervals of between -3 and 3 mm for the X coordinate, -3 and 3 mm for the Y coordinate and -3 and 3 for Z coordinate were taken as measures of accuracy; however, the majority of points oscillated between -5 and 5 pixels, corresponding to a range of ±4 mm. For the check points, deviations are around ± 4 mm. When spherical images are used, the errors achieved on the check and control points are higher. Intervals of between -4 and 4 mm for the X coordinate, -4 and 4 mm for the Y coordinate and -4 and 4 for the Z coordinate were taken as measures of accuracy; however, the majority of the points oscillated between -6 and 6 mm, corresponding to a range of ±6 mm. The deviations for the check points are around ± 5 mm.
Figure 6: Distribution of the control and check points detected in a) orthoimages and b) spherical images
Figure 5: Histograms of the deviations of the control and check points for orthoimages: (a) X direction in pixels - control; (b) Y direction in pixels - control; (c) Z direction in pixels - control; (d) X direction in pixels – check; (e) Y direction in pixels
Figure 7: Histograms of the deviations of the control and check points for spherical images: (a) X direction in pixels - control; (b) Y direction in pixels - control; (c) Z direction in pixels - control; (d) X direction in pixels – check; (e) Y direction in pixels
– check; (f) Z direction in pixels – check.
Additionally, the percentage of points for which the error value on the check points was greater than 2 RMSE is also shown. In the case of Test site 1, a slight improvement in the percentage of such points may be noticed. It may be concluded that using orthoimages for TLS data orientation for objects of uncomplicated geometry only has an influence on improving the distribution of keypoints, and not on the accuracy of the data orientation process.
Test site II
Tab. 4 presents the results of orientation on the control points. When Tab. 4 is analysed, it may be noticed that the accuracy of the orientation of point cloud fragments (the walls) are similar.
Tab. 4 RMSE of point clouds orientation on control points.
When spherical images are used, the orientation accuracy is insignificantly lower. Significant improvements in data orientation may only be noticed when using orthoimages when
fragments are scanned from a wide angle. This is caused by the "pseudo-distortion" effect on spherical images. Additionally, smaller deviations on the control points for the Z component may be noticed. Additionally, in the upper fragments of a scan (on facets) it was not possible to detect the correct tie points on spherical images. In order to prove the advantages of orthoimages as compared to spherical images, Fig. 8 presents the spatial distribution of points detected using both methods. The distribution of errors, based on histograms of the deviations of the control and check points, was analysed. An example is presented in Figs. 9 and 10.
Intervals of between -5 and 5 mm for the X coordinate, -5 and 5 mm for the Y coordinate and -4 and 4 for Z coordinate were taken as measures of accuracy. Deviations for the check points are around ± 5 mm. When spherical images are used, errors achieved on check and control points are similar, but the number of points is lower. When analysing the histograms, it may be noticed that the error values for orthoimages are close to 0. The fact that a greater number of points is utilized for the orientation process (of check points) and for testing the results may be also noticed.
Figure 8: Distribution of the control and check points detected in a) orthoimages and b) spherical images
Figure 9: Histograms of the deviations of the control and check points for orthoimages: (a) X direction in pixels - control; (b) Y direction in pixels - control; (c) Z direction in pixels - control; (d) X direction in pixels - check; (e) Y direction in pixels
- check; (f) Z direction in pixels – check.
Figure 10: Histograms of the deviations of the control and check points for spherical images: (a) X direction in pixels - control; (b) Y direction in pixels -control; (c) Z direction in pixels - control; (d) X direction in pixels - check; (e) Y direction in pixels - check;
(f) Z direction in pixels – check.
5. FINAL REMARKS AND CONCLUSIONS
This paper presents the analysis of computer vision algorithms for the orientation of terrestrial laser scanning (TLS) data. The proposed method of processing data to the raster format (orthoimage and spherical image), as well as searching for and connecting tie points, considerably influenced the improved accuracy of TLS data. When processing complex objects, such as cultural heritage objects, where it is not possible to distribute the tie points indicated, the applied measurement technique
allows the problem of achieving low accuracy values to be eliminated due to the detection of natural points in point clouds.
The following conclusions may be drawn based on the performed experiments:
As a result of the use of orthoimages, image deformations which occur as a result of the transformation of a point cloud to a spherical image can be eliminated.
The use of orthoimages for the orientation of terrestrial
The detected points are evenly distributed across the entire area of works.
Thanks to the use of orthoimages, it is possible to increase the accuracy of orientation in selected fragments of the scan. This is important in terms of results generation, high resolution orthoimages or precise 3D modelling.
It is planned to perform successive tests on the facades of historical buildings. Conference on Computer Vision, vol. I (LNCS 3951), pp. 404-417. Automatic Registration of Terrestrial Laser Scanning Point Clouds using Panoramic Reflectance Images. Sensors, Vol. 2009 (9) , pp. 2621-2646.
Leutenegger, S., Chil, M., Siegwart, R., Y., 2011: BRISK: Binary Robust invariant scalable keypoints. Proceeding ICCV '11 Proceedings of the 2011 International Conference on Computer Vision, pp. 2548-2555.
Lindeberg, T., 2008: Scale space,. Wah, B., Encyclopedia of Computer Science and Engineering IV. John Wiley and Sons, pp. 2495–2504.
Lowe, D., G., 2004: Distinctive Image Features from Scale-Invariant Keypoints. International Journal of Computer Vision 60 (2), pp. 91–110.
Markiewicz, J., S., Kajdewicz, I., Zawieska, D., 2015: The analysis of selected orientation methods of architectural objects’ scans. Proceedings of SPIE, Vol. 9528, pp. 1-15.
Markiewicz, J., S., Zawieska, D., 2015: Quality assessment of An Automatic Procedure for Combining Digital Images and Laser Scanner, Data. Int. Arch. Photogramm. Remote Sens. Spatial Inf. Sci., Vol. 39 (B5), pp. 229–234.
Rosten, E., 2006: Machine learning for high-speed corner detection. Proceeding ECCV'06, Proceedings of the 9th European conference on Computer Vision, Vol. I, pp. 430-443.
Sequeira, V.; Ng, K.; Wolfart, E.; Goncalves, J., G., M.; Hogg, D., 1999: Automated reconstruction of 3D models from real environments. ISPRS Journal of Photogrammetry and Remote Sensing, Vol. 54(1), pp. 1–22.
Theiler, P., W., Wegner, J., D., Schindler, K., 2013: Markerless point cloud registration with keypoint-based 4-points congruent sets. ISPRS Annals of the Photogrammetry, Remote Sensing and Spatial Information Sciences, Vol. II-5/W2, pp. 283–288.
Theiler, P., W., Wegner, J., D., Schindler, K., 2014: Keypoint-based 4- points congruent sets – Automated marker-less registration of laser scans. ISPRS Journal of Photogrammetry and Remote Sensing, Vol. 96, pp. 149–163.
Tuytelaars, T., Mikolajczyk, K., 2008: Local invariant feature detectors: a survey. Foundations and Trends in Computer Graphics and Vision, Vol. 3(3), pp. 177–280.
Urban, S., Weinmann, M., 2015: Finding A Good Feature Detector-Descriptor Combination For The 2d Keypoint-Based Registration Of TLS Point Clouds. ISPRS Annals of the Photogrammetry, Remote Sensing and Spatial Information Sciences., Vol. II-3/W5, pp. 121-128.
Vosselman, G., Maas, H-G., 2011: Airborne and Terrestrial Laser Scanning. Whitles Publishing, Scotland UK, pp. 111-119.
Yu G., Yu J-M., 2011: ASIFT: An Algorithm for Fully Affine Invariant Comparison. Image Processing On Line, Vol.1, pp.11-38.