A STUDY ABOUT TERRESTRIAL LASER SCANNING FOR RECONSTRUCTION OF
PRECAST CONCRETE TO SUPPORT QLASSIC ASSESSMENT
Muhammad Afiq Aziz a, Khairulnizam M. Idris a , Zulkepli Majid a, Mohd Farid Mohd Ariff a, Ahmad Razali Yusoff a, Lau Chong Luh a, Mohd Azwan Abbas b, Albert K. Chong c
a
Geospatial Imaging & Information Research Group,Faculty Geionformation and Real Estate, Universiti Teknologi Malaysia
b
Geomatic Sciences, Faculty Of Architecture, Planning And Surveying, Universiti Teknologi Mara (Perlis)
c
Faculty of Engineering & Surveying, University of Southern Queensland, Australia
KEY WORDS: Terrestrial Laser Scanning, QLASSIC, Accuracy,3D Modelling,
ABSTRACT:
Nowadays, terrestrial laser scanning shows the potential to improve construction productivity by measuring the objects changes using real-time applications. This paper presents the process of implementation of an efficient framework for precast concrete using terrestrial laser scanning that enables contractors to acquire accurate data and support Quality Assessment System in Construction (QLASSIC). Leica Scanstation C10, black/white target, Autodesk Revit and Cyclone software were used in this study. The results were compared with the dimensional of based model precast concrete given by the company as a reference with the AutoDesk Revit model from the terrestrial laser scanning data and conventional method (measuring tape). To support QLASSIC, the tolerance dimensions of cast in-situ & precast elements is +10mm / -5mm. The results showed that the root mean square error for a Revit model is 2.972mm while using measuring tape is 13.687mm. The accuracy showed that terrestrial laser scanning has an advantage in construction jobs to support QLASSIC.
1. INTRODUCTION
Laser scanners increase the accuracy and speed of 3dimensional (3D) data acquisition of the digital as-built generation process. There is a new trend in the use of laser scanners to acquire reliable and accurate data for building information building (Bosche et al.,2015). The survey yields a digital data set, which essentially a dense “point cloud”, where each point is represented by a coordinate in 3D space. The most important advantage of the method is that a higher point density can be achieved, in order of 5 to 10 mm resolution. The scanner records thousands of points per second and each point have intelligence, or location coordinates and elevation information (Sepasgozar et al.,2014). All of these points are placed into the same local coordinate system to make up a point cloud which represents the area, building, or object being scanned in a 3D space. Most modern scanners are rated to have their best accuracy at distances out to 100-130 meters. This means that objects and areas can be scanned from a distance if the areas is inaccessible. When first introduced, the benefits of the technology were immediately apparent in the survey industry.
Users of 3D laser scanners were very impressed with the speed at which they captured information, the ability to conceptualize survey projects in 3D, its ability to scan objects and areas at a distance, and the density of its point collection (Tang et al., 2010). Conventional surveying techniques involve collecting important points and features using a total station or GPS. This can be a slow process since individual points have to be collected one at a time. 3D laser scanning has given surveyors the ability to collect information much faster, at upwards of 1,000 points per second.
According to M. K. Kim, J.W. Park, H. Sohn and C. C. Chang. (2014), the dimensional quality assessment technique is further advanced so that terrestrial laser scanning technique can also be applied to full-scale precast concrete panels with complex geometries. In addition, G. Atasoy, P. Tang and B. Akinci (2009) also used pulse based and phase shift scanner for construction quality control.The main structural elements in the building are steel beams and columns. Besides that, Kim et al., (2013) used laser scanner to scanned a measurement of length, width, squareness of precast concrete panels in a speedy manner. Sepasgozar et al., (2015) evaluated the windows width and windows length using manual measurement, leica scan station C5 and mobile lidar.
Quality Assessment System in Construction (QLASSIC) is a system or method to measure and evaluate the workmanship quality of a building construction work based on Construction Industry Standard (CIS 7:2006) in Malaysia. In Singapore, similar system is known as Construction Quality Assessment System (CONQUAS). The effective implementation of CONQUAS, Construction Industry Development Board (CIDB) Malaysia coherently establish their own CONQUAS with several adjustments made and name it QLASSIC. QLASSIC sets out the standards for various construction elements in building and other infrastructure works.
National House Buyers Association (HBA) and other relevant organizations and authorities take part in this assessment towards quality aspects.
The Technical Committee (TC) team sets up the QLASSIC to give a level of standard that can award the developers or contractors as successful parties in the construction industry. This system or method is to measure the quality of a workmanship of a construction work based on the relevant approved standard. QLASSIC set out the standard for quality of workmanship of various construction elements of building and also infrastructure works upon completion of the projects. The assessments elements include Structural Works, Architectural Works, and Mechanical and Electrical Works (M&E). QLASSIC enables the quality of workmanship in construction projects to be objectively highlighted through a scoring system. The marks are summed up to calculate the QLASSIC Score (%) for a construction project. Lastly, the QLASSIC approach is still new in the construction industry. The encouragement in application of QLASSIC for every project should be highly suggested by the CIDB Malaysia.
Therefore, this study is to develop a 3D model of precast concrete based on registered point cloud captured by terrestrial laser scanning. Furthermore, these researchers do focus much on 3D point cloud data to support QLASSIC assessment.
2. DATA ACQUISITION AND PROCESSING
2.1 Site Description
In this study, a precast concrete company was selected. It is located at Senai, Johor Bahru.This company makes a production of various dimensions of precast concrete. The measurement that was scanned is 175mm x 175mm x 6000mm and 230mm x 230mm x 6000mm because it has a lot of demand from the developer. Leica Scanstation C10 was used during the study.
2.2 Terrestrial Laser Scanner: Leica ScanStation C10
Laser scanner known as Leica ScanStation C10 was applied for precast concrete and the scanned data were managed with it associated software Leica Cyclone. ScanStation C10 is a high accuracy and medium range scanning laser scanning system. It's associated with high-resolution camera, laser-fast targeting and textured-scans.
The Leica ScanStation C10 is a medium range laser scanner type. It was designed for medium spaces applications such as building, industrial plant, civil and survey, and forensics. The technology behind this laser scanner is based on pulsed or time-of-flight measuring principle with a green laser. A spinning mirror is used to capture the range of points in a vertical slice and rotate to capture the field-of-view at a vertical range of 270° and a horizontal range of 360°. This scanner has the accuracy up to 2mm at 1 sigma (1 – 50m range). Table 1 shows the specification of Leica ScanStation C10.
Through the application of Leica Cyclone software, it allows the point cloud management, such as data registration and noise
filtering. While, utilizing the Leica ScanStation C10, this scanner able to register various scans with or without using targets, because it can be registered using natural targets, which is known as point-to-point registration. The scanner produces a series of point clouds and the point clouds can provide the basis for surface reconstruction or modelling. The point clouds also contained information such as object size, location and surface characteristics of objects in the real world. Subsequently, objects can be modelled based on the information extracted from point clouds.
Leica ScanStation C10
Range measurement Principle
Pulsed (Time-of-flight)
Scanner Control Full colour touch-screen
Range Up to 300 m (minimum range
0.1 m)
Field-of-view 360 ̊ horizontal, 270 ̊ vertical
Scan Rate Up to 50,000 measurement
points/sec
Single Image 1.8MB, 4Mpixels (1920 x 1920
pixel)
Ranging Error ±4 mm
Weight 13.0 kg
Table1. Specification Leica ScanStation C10
2.3 Data Acquisition
Data acquisition is an essential step in a study because data is one of the main components to support the whole study. In this study, TLS system was used to capture precast concrete in 3D form. Laser scanner – Leica ScanStation C10 was used in this study.
4 scan stations were used to be set up to cover the precast and several black/white target. Leica ScanStation C10 provides different scanning resolution such as low, medium and high. The selection of suitable resolution is depending on the specified distance of the object to the scanner. There were 4 scans acquired in this study, thus produced 4 sets of point clouds, one from each scan station. The point clouds data were obtained and stored in a single database. While due to the medium resolution scanning takes time in approximately 7 minutes per scan, the whole data acquisition process was completed within two hours, including the time for scanner set up for every station.
2.4 Data Processing
Software play an important role in data processing. There are many software available for viewing and processing point cloud data. In this study, Leica Cyclone 7.3 was used to process point cloud data produced by the laser scanner. The Leica Cyclone software is specifically designed for the Leica laser scanner. It helps to manage data efficiently in databases.
The immediate result produced by a laser scanner is a series of point cloud. Each point is represented by 3D coordinates (x,y,z). The data processing of point clouds is performed through several steps. The data processing is necessary to obtain accurate and correct model of the objects. The data processing steps are divided into two stages: (1) pre-processing and (2) postprocessing (modelling).
2.4.1 Data Pre- Processing
Pre-processing is also known as a preliminary treatment. In pre-processing stage, the operations were directly carried out on the point clouds. This process includes two main actions which are noise filtering and registration point. The results of these procedures was a combined point cloud from all scans (registered) and “noise-free” point cloud.
The Leica Cyclone software was used to process the point cloud data produced from the laser scanner. Each set of point cloud has its own coordinate system. In this stage, registration process was performed to align all the point clouds to one common coordinate system. This action registers and merges several scans into one complete model. The result of registration was shown in Figure 1.
Figure 1. Result of registration.
After the registration process, noise filtering should be performed to reduce the amount of points and remove any unnecessary points that out from the coverage of the precast concrete. This is because the point cloud produced from laser scanner may compose erroneous points that derived from the object surface quality and laser dispersion. Figure 2 shows the results after the noise filtering process.
Figure 2. After Filterring
The point cloud preliminary treatment was completed with the process of registration and noise filtering. Lastly, all scans were compiled into a single of large datasets of point cloud. This process enables fast-working and efficiently with the unified data format
2.4.2 Data Post-Processing (3D Modelling)
The second stage of point cloud data management is post processing which is an operation to form a surface model of objects based on point cloud. 3D modelling is a time consuming and technical process. The 3D modelling can be carried out with modelling software. In this study, modelling process was done by using AutoDesk Revit software. AutoDesk Revit was used in this study because it is an easy-to-use 3D modelling software for building structure.
Exported point cloud from Leica Cyclone 7.3 was imported in AutoDesk Revit 2015 in order to generate .RCP file format of the building model. In this case, the AutoDesk Revit starts from version 2014 and above, it will accept point cloud in .RCP file. The interested point cloud registered was imported into AutoDesk Revit. It just converts the file format from .XYZ to RCP. Next, point cloud in .RCP format attached into the AutoDesk Revit in order to generate 3D building model and generation of building information modelling. Figure 3 shows the point clouds in AutoDesk Revit software.
3. RESULTS AND DISCUSSIONS
In this study, a set of point cloud of precast concrete was collected using Leica ScanStation C10. The point cloud dataset was being processed and registered. The complete model of precast concrete was successfully constructed using AutoDesk Revit. Lastly, a comparison between point cloud data with conventional methods (measurement tape) was carried out.
3.1 3D Modelling using AutoDesk Revit and Revit families
The result of this study was 3D models constructed using AutoDesk Revit 2015 based on point cloud data. AutoDesk Revit itself able to generate a 3D surface model by using an architectural template. The point clouds that are produced from the laser scans can be recognized by REVIT applications and used as a source for modelling purposes. Currently, there is no push-button solution for creating a 3D model directly from a point cloud, so designers must manually remodel the building in Revit by fitting Revit families objects such as walls, beam and column to the points in the cloud. Using AutoDesk Revit together with Revit families add-in to AutoDesk Revit, enables accurate building models to be created directly from a point cloud without manual drawing. The result of 3D model of precast concrete generated with the help of Revit families is shown in Figure 4 for 175mm x 175mm x 6000mm and Figure 5 for 230mm x 230mm x 6000mm.
Figure 4. 3D Model Precast Concrete for 175mm x 175mm x 6000mm
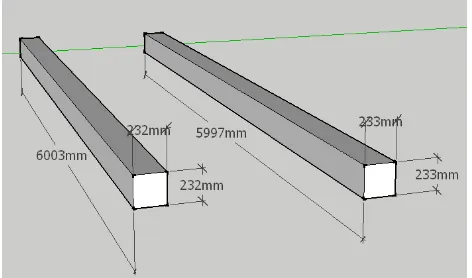
Figure 5. 3D Model Precast Concrete for 230mm x 230mm x 6000mm
3.2 QLASSIC Accuracy Assessment
QLASSIC accuracy assessment was also done in this study. The findings show that the laser scanner of Leica ScanStation C10 can provide high accuracy of building structure. In order to get a systematic accuracy assessment, the evaluation of the estimate accuracy was carried out using the equation:
where = each value in the data set
= mean of all values in the data set = number of value in the data set
The root-mean-square error (RMSE) was used to measured the differences between values predicted by a model and the values actually observed. According to Mao and Shi (2008), RMSE is commonly used in the research field to describe accuracy of features and it is acceptable to measure the error and estimate the quality of features. The lower the RMSE value, the better the accuracy.
Figure 6 shows the 3D model from the precast company for the dimension 175mmx 175mm x 6000mm and Figure 7 shows the 3D model from the precast company for the dimension 230mmx 230mm x 6000mm.
Figure 7. 3D Model for 230mm x 230 mm x 6000 mm
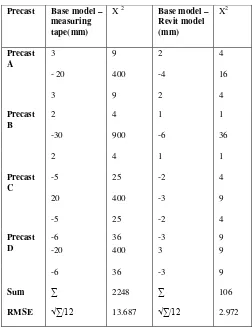
Table 2 shows the dimensional measurement difference between, measuring tape and Revit model. Meanwhile, the analysis for this study included the comparison of measurement between Revit model and conventional method (measuring tape) with the base model from the architecture. The comparison was done and recorded in Table 3. The RMSE value of the base model with point cloud data was 2.972mm while base model with conventional method was 13.687mm.
Table 2. Result of dimensional measurement
Table 3: Comparison of measurement between measuring tape and Revit model with the base model
Based on the comparison, the tolerance of Revit model is well within the illimetre level. Revit model has a lower tolerance compared to measuring tape because it automatically measured the precast concrete which was modelled using point cloud as a reference. This proved that laser scanning method was accurate and sufficient to produced reliable virtual and detailed 3D models.
4. CONCLUSION
This study concludes that the use of TLS in as-built survey is among the best method that practically used in the field. Besides that, TLS also proves that the ability to capture a lot of data within a short time and also easy to operate and setup the instrument. In addition, we can also conclude that 3D point cloud model can help to identify the defect area in a structure and help prevent from the unsatisfied QLASSIC score because it’s done only once. Although the cost of the instrument is expensive, but its function and capability able to meet the user needs.
The data present in a form of point cloud is very useful as it able to be presented in many ways. The most common product from point cloud is a 3D model. It is an advantage by having a 3D model as it improves the visualization of the final result.
Based on result and analysis, it shows that laser scanning is the best technique to produce a 3D model with small tolerance from point
Precast Dimension Base Model
clouds. Therefore, it can be concluded that TLS has a major advantage in modelling with less manpower to be used in the present and future. We also can conclude that the lower the tolerance, the higher the QLASSIC score for the building. In the mean way, we can justify that 3D point clouds can support in QLASSIC assessment.
ACKNOWLEDGEMENT
The authors acknowledge the support and contribution received from the Ministry of Higher Education (MOHE) and Faculty of Geoinformation and Real Estate, Universiti Teknologi Malaysia (UTM). The authors would also like to thank Innovative Engineering Alliance, Universiti Teknologi Malaysia, for providing the fund from vote number 4L149 to enable this study to be carried out.
REFERENCES
Bosché, F., M. Ahmed, Y. Turkan, C.T. Haas, and R. Haas, The value of integrating Scan-to-BIM and Scan-vs-BIM techniques for construction monitoring using laser scanning and BIM: The case of cylindrical MEP components. Automation in Construction, 2015. 49: pp. 201-213.
G Atasoy, P Tang, B Akinci A comparative study on the use of laser scanners for construction quality control and progress monitoring purposes - CIB W078 26th Int. Conf.—Managing IT in Construction, 2009
Kim, M., Sohn, H., and Chang, C, (2013) Active Dimensional Quality Assessment of Precast Concrete Using 3D Laser Scanning. Computing in Civil Engineering (2013): pp. 621-628
Kim, M., Park, J., Sohn, H., and Chang, C. (2014) Full-Scale Application of a Dimensional Quality Assessment Technique to Precast Concrete Panels using Terrestrial Laser Scanning. Computing in Civil and Building Engineering (2014): pp. 950-957
Mao, H., & Shi, W. (2008). New Methodology of Representing the Positionla Error of Non-Point Features in GIS. The International Archives of the Photogrammetry, Remote Sensing and Spatial Information Sciences , XXXVII, pp. 1503-1508. Beijing
Quality Assessment System For Building Construction Work (Construction Industry Standard; CIS 7: 2006) ; 7 th Floor, Grand Seasons Avenue 72, Jalan Pahang 53000 Kuala Lumpur Malaysia.
Sepasgozar, S.M.E., S. Lim, S. Shirowzhan, and Y.M. Kim, Implementation of As-Built Information Modelling Using Mobile and Terrestrial Lidar Systems, in The 31st International Symposium on Automation and Robotics in Construction and Mining (ISARC 2014). 2014, IAARC: Sydney
Sepasgozar SME; Lim S; Shirowzhan S; Kim YM; Nadoushani ZM, 2015, 'Utilisation of a new terrestrial scanner for reconstruction of as-built models: A comparative study', in 32nd International Symposium on Automation and Robotics in
Construction and Mining: Connected to the Future, Proceedings
Tang, P., D. Huber, B. Akinci, R. Lipman, and A. Lytle, Automatic reconstruction of as-built building information models from laser-scanned point clouds: A review of related techniques. Automation in Construction, 2010. 19(7): pp. 829843.