FROM UAS DATA ACQUISITION TO ACTIONABLE INFORMATION – HOW AN
END-TO-END SOLUTION HELPS OIL PALM PLANTATION OPERATORS TO PERFORM A
MORE SUSTAINABLE PLANTATION MANAGEMENT
C. Hoffmann a, C. Weise a, T. Koch a K. Pauly b, * a
Trimble Germany GmbH, Am Prime Parc 11, 65479 Raunheim, Germany - (christian_hoffmann, christian_weise, thomas_koch)@trimble.com b
Trimble Gatewing, Buchtenstraat 9/1, 9051 Gent, Belgium – [email protected]
KEY WORDS: UAS, GNSS base line processing, Oil Palm Plantations, Object-based image analysis, Sustainable forestry.
ABSTRACT:
Palm oil represents the most efficient oilseed crop in the world but the production of palm oil involves plantation operations in one of the most fragile environments - the tropical lowlands. Deforestation, the drying-out of swampy lowlands and chemical fertilizers lead to environmental problems that are putting pressure on this industry. Unmanned aircraft systems (UAS) together with latest photogrammetric processing and image analysis capabilities represent an emerging technology that was identified to be suitable to optimize oil palm plantation operations.
This paper focuses on two key elements of a UAS-based oil palm monitoring system. The first is the accuracy of the acquired data that is necessary to achieve meaningful results in later analysis steps. High performance GNSS technology was utilized to achieve those accuracies while decreasing the demand for cost-intensive GCP measurements.
The second key topic is the analysis of the resulting data in order to optimize plantation operations. By automatically extracting information on a block level as well as on a single-tree level, operators can utilize the developed application to increase their productivity.
The research results describe how operators can successfully make use of a UAS-based solution together with the developed software solution to improve their efficiency in oil palm plantation management.
* Corresponding author
1. INTRODUCTION
1.1 Oil Palm Plantations
Of the 17 major oils & fats, world consumption of palm oil in 2012 was highest with 52,1 million tonnes (Stevenson 2016) and palm oil is the most efficient oilseed crop in the world (Sime Darby 2016), producing up to ten times more oil than other leading oilseed crops. Nevertheless, production of palm oil is conducted in very fragile environments and typically involves deforestation of tropical rainforests, drying-out of swampy lowlands, application of chemical fertilizer and often leads to negative effects to the landscape like gully erosion that can rapidly transform plantations into waste land.
Despite the negative effects, there are indications that sustainable plantation management is possible which reduces or even eliminates the demand for deforestation of natural tropical rainforests (Norman 2013).
Research suggests that productivity gains by 50% of the global palm oil production could be realized without any further deforestation, using the appropriate technology to increase yields and restore waste land to production (Norman 2013, Ruysschaert 2011).
One critical component in oil palm plantation management is getting timely and accurate information about tree health, growth progress of young trees and yield prediction on a
per-tree basis as well as based on a complete block, to plan and execute for the right measures.
1.2 Emerging technologies for monitoring of oil palm trees
Unmanned aircraft systems (UAS) equipped with a proper camera and positioning technology in combination with suitable software tools allow operators to develop detailed information supporting more efficient oil palm plantation management.
Whilst technical capabilities determine the most precise potential result, the usability of a system influences the actual quality of the result. Particularly, if it is taken into account that oil palm plantations are typically located in remote regions where skilled operators might not be available and operating conditions sometimes push systems to their technical limits.
A successful deployment of an operational system therefore must not only take the overall technical possibilities into account but also focus on the onsite conditions, the ease-of-use and the appropriate knowledge transfer and training.
1.3 Scope of Work
2. METHODOLOGY AND EQUIPMENT
Through direct engagement with industry leaders in the oil palm plantation business including onsite observations, it was possible to design a complete system that is capable of providing actionable results that immediately translate into productivity gains.
In order to measure, understand and improve the complete system it was broken down into its components and a set of research activities were conducted to assure a solid, data-driven approach.
Two main areas for research were identified:
1. Utilizing high precision GNSS information for a less time consuming positioning workflow.
2. Development of a tool for efficient and automated extraction of relevant parameters that allow a more effective plantation management.
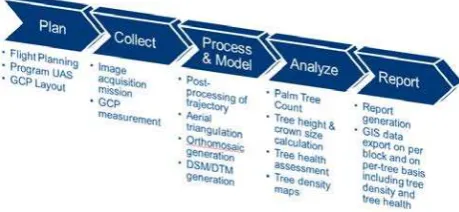
Figure 1 illustrates the overall system workflow and the split into specific work packages.
Figure 1: System-Workflow
2.1 Mission Planning
A number of flight campaigns were conducted in various regions of the world and under different operating conditions, and best practices for UAS data collection on oil palm plantations were developed. Positioning system verifications were conducted at sites in Europe and New Zealand.
In order to have enough relevant data for the development of the required analysis capabilities, image acquisition campaigns took place on oil palm plantations in the Asia-pacific region. For confidentiality reasons, no further information on the exact locations of these plantations might be disclosed.
One key element of this project was to assess the capabilities of a high precision global navigation satellite system (GNSS) receiver that allows the reduction or even elimination of Ground Control Points (GCPs). From an effort perspective, laying out and measuring the locations of GCPs is significant and requires trained personnel. Hence, a reduction in the number of measured GCPs immediately translates into cost reductions.
Several benchmarks were made using varying quantities of GCPs in order to assess the achievable accuracies, when minimal time is spent on deploying control points.
The developed workflow includes flight mission planning using Trimble Access Aerial Imaging software. This software provides advanced automation to reduce the complexity of
planning characteristics including image overlap ratios and average flying height. This ensures that an operator in a challenging, remote location gets excellent results.
Flight missions were planned with a 80% forward and lateral overlap to ensure optimal photogrammetric accuracy. Flight line orientation was perpendicular to the wind direction to ensure stable flight behaviour.
2.2 Flight Mission & Equipment
A Trimble UX5 HP UAS was used to collect imagery (Figure 2).
Figure 2: Trimble UX5 HP.
This platform is equipped with a 36 MP Sony a7R camera, a high performance multiple frequency GNSS antenna embedded in the wing and a GNSS receiver logging data at 20 Hz for post-processing of the trajectory. Camera event marks are recorded with better than millisecond-level accuracy.
In contrast to real-time kinematic (RTK) corrected systems, the UX5 HP uses post-processed kinematic (PPK) technology to correct the airframe trajectory and event marker positions.
Figure 3 illustrates the resulting Ground Sample Distance (GSD) using various lenses (15 mm, 25 mm or 35 mm) and comparing it to the 24 MP camera of a Trimble UX5.
Figure 3: GSD in relation to flying altitude and based on different lenses.
surveyed and either used as GCPs or as independent check points in case they were not used in the adjustment.
2.3 GNSS Base line Processing, Image Orientation & Bundle Block Adjustment
After data acquisition, the GNSS data from the inflight receiver and the local base station were combined to produce an accurate airframe mission trajectory. This process is called base-line processing and was performed in the Trimble Business Centre software (TBC, V. 3.61). The respective GSDs were calculated using one of the following three approaches:
1. Uncorrected trajectory with 5+ GCPs 2. Post-processed trajectory, no GCPs 3. Post-processed trajectory, one or few GCPs
2.3.1 Uncorrected with 5+ GCPs: The first approach used a GNSS trajectory that was not corrected using base station data. The complete photogrammetric processing procedure utilized a standard workflow of automatic tie point generation and matching for the relative adjustment only and at least 5 GCPs for absolute adjustment and accurate camera calibration.
2.3.2 Post-processed trajectory, no GCPs: The second approach utilized a direct georeferencing workflow without the use of GCPs. To get to the required accuracy, post-processing of the trajectory was performed. The GNSS log file from the airframe together with base station data from a local base station, or online from a nearby CORS or virtual reference station (VRS) service were processed together in the TBC software to create a corrected trajectory. The corrected airframe trajectory and corrected camera event marker positions were derived using all available satellites and GNSS frequencies. Corrected event marker position solutions were calculated (using interpolation algorithms set in the UX5 HP template available in TBC) and were used as observations for the camera calibration. Only the most accurate type of corrected positions, known as “Fixed” GNSS solutions, were used in the result calculations. Less good results, known as “float” solutions, were discarded to ensure reliability of the process.
While this approach ensures an end result characterized by a very high relative accuracy, the absolute errors can sometimes show a systematic offset (global shift) in the vertical component. This is most likely expected to be the case when working at a low flying altitude with a narrow viewing angle lens or in datasets with low overlap, resulting in a limited observability of the focal length.
The possibility of vertical shifts exists in data from all similar class UAS and although it is much less known by UAS operators inexperienced in photogrammetry, it is well documented in photogrammetric literature when performing GNSS-only based camera calibrations (for example Casella & Franzini 2005, Grenzdörffer 2009).
To increase the observability of the focal length and reduce the risk of a systematic vertical offset without the use of GCPs, the photogrammetric block can be strengthened by adding a few flight lines at a 20% higher flight level in the same flight that diagonally crosses the area of interest. Trimble Access Aerial Imaging allows for this block configuration (Pauly 2016). The two flight blocks (the main block and the additional flight lines) can be merged for the adjustment to improve calibration of the focal length. After adjustment, the additional flight lines can be
removed again to avoid artefacts in the dense point cloud extraction and the creation of orthomosaics due to differences in GSD or ambient light conditions between the two blocks.
2.3.3 Post-Processed trajectory, one or few GCPs: TBC provides the option to measure only one or few GCPs in the imagery before starting the adjustment. The available GCPs will be used in conjunction with the post-processed event marker positions for the absolute adjustment and make it possible to automatically correct for global shifts in the photogrammetric solution relative to the control point(s) on the terrain.
It is important that the GCPs are located within the flight plan boundary to ensure observability of the point in sufficient images.
When measuring the GCP(s) in the images, it is important to do so both in images that have the GCP marker in the centre as well as in images that have the GCP towards the edge or corner of an image, in order to increase the observation angles and obtain better vertical accuracy. This is understood to be best practice whenever working with GCPs or when measuring check points on adjusted images (Pauly 2016).
It is recommended to use at least one or a few ground control points to correct for potential global shifts. This procedure is understood to be more effective in terms of accuracy and economy (Pauly 2016).
2.3.4 Accuracy Benchmark: The American Society for Photogrammetry and Remote Sensing (ASPRS) published positional accuracy standards that set a transparent and independent framework for benchmarking (ASPRS 2015). The according accuracy classes which put the root-mean-square-error (RMSE) in relationship to the GSD will be taken for accuracy evaluation.
2.4 Dense Matching, Orthomosaic Generation, Quality Control
For further photogrammetric processing, the two software packages TBC Aerial Photogrammetry Module (APM) which focuses on a high level of automation and Inpho UASMaster which facilitates a complete photogrammetric workflow, were used. Both software solutions employ the Inpho technology for orientation and bundle block adjustment. Benchmarks for the spatial accuracy in this study were conducted in TBC APM.
While TBC allows the automated generation of Orthomosaics and digital surface model (DSM) information, UASMaster can additionally be utilized to apply filtering techniques to obtain bare terrain models and to deal with specific or problematic operating conditions by offering tools for further parameterization and quality checks. With the assumption that ease-of-use is a key requirement in the given oil palm plantation scenario, focus was put to the automatic processing.
2.5 Analysis workflow using object-based image analysis
By engaging with plantation managers and personnel a detailed understanding of oil palm plantation operations was gained.
1. The possibility to detect single oil palm trees. 2. The possibility to detect small oil palm trees that are in an early growth stage.
3. The possibility to derive tree density information on a per-hectare basis for an individual block and for the complete plantation.
4. The possibility to derive information about size and health of each individual tree.
5. The possibility to manually improve quality of the automatically generated result by smart and efficient tools. 6. The possibility to export analysis results into a GIS environment.
The complexity of the analysis and the requirements on usability lead to the conclusion that an object-based image analysis (OBIA) approach is suitable to meet the analysis requirements. Trimble’s eCognition software has OBIA capabilities and facilitates an environment to develop standalone applications meeting technical requirements as well as matching requirements for usability of this type of project.
3. RESULTS AND DISCUSSION
3.1 Spatial Accuracy with or without GCPs
3.1.1 Reliability analysis: A total of 25 test flights have been conducted using all lens types and a range of GSD values. Details of the test flights and a comprehensive report are described by Pauly (Pauly 2016). Results and key learnings are discussed below (s. table in Appedix).
Given optimal flight planning (80% planned overlap and flight lines perpendicular to the wind), no relation between accuracy and weather conditions was discovered. In case where manual quality assurance steps were conducted to assure absolute accuracy, the applied shift correction was in Z only and was 14.9 cm on average, with a minimum of 3.7 cm and a maximum of 51.8 cm.
Overall, an average root-mean-square error (RMSE) of 2.7 pixels horizontal and 2.4 pixels vertical was obtained.
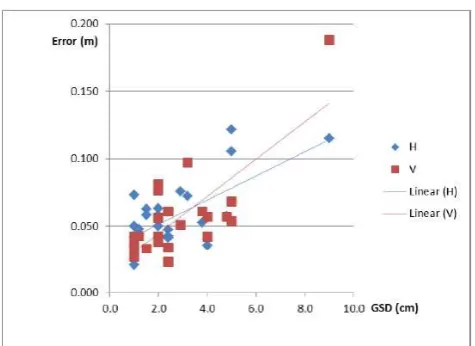
Figure 4 shows these values as a function of the GSD, expressed in meters and times the GSD, respectively. As expected, there is a strong linear relation with GSD for both horizontal and vertical accuracy when expressed in meters (figure 4).
Figure 4: Horizontal and vertical RMSE in meters (vertical axis) for different GSDs in cm (horizontal axis). H = horizontal, V =
vertical.
Ultimately, for a smaller GSD, it is the accuracy of the GNSS control and check point measurements in the field that will determine the ASPRS accuracy class of the results, because those will supersede the accuracies of the photogrammetric processing (ASPRS 2015, Whitehead & Hugenholtz 2015).
3.1.2 Accuracy relative to the number of GCPs: Two selected flights have been further analysed. GCPs have been measured by RTK using a Trimble R10 GNSS survey instrument in a VRS network resulting in an average horizontal accuracy of 1.3 cm and vertical accuracy of 1.7 cm.
Table 1 and 2 show the accuracies for the two flights:
Flight 020 With trajectory, no GCPs (18 CP)
No trajectory, 9 GCPs (9CP)
RMSEx on CP 0.033 0.026
RMSEy on CP 0.025 0.013
RMSEz on CP 0.034 0.058
Table 1: RMSEs (in m) for flight 020, 2.4 cm GSD.
Flight 015 No GCPs (17 CP), 3 additional lines
No GCPs (17 CP), main block
1 GCP (16 CP), main block
9 GCPs (6 CP), main block
RMSEx on CP 0.025 0.052 0.055 0.062
RMSEy on CP 0.034 0.063 0.047 0.024
RMSEz on CP 0.032 0.075 0.026 0.064
The horizontal RMSE of the adjustment of flight 020 would meet the accuracy requirements for the 5 cm RMSE class defined by ASPRS (2015). This means that for the final map product, the expected horizontal accuracy class would be 10 cm according to ASPRS. However, it was discovered that the horizontal RMSE on final map products reflects the results from the adjustment much more closely than the stipulated factor 2, since horizontal noise in the production of true orthomosaics is much less of an issue than vertical noise in the DSM.
While the processing strategy without trajectory, but with nine GCPs (equivalent to processing UX5 data) resulted in a better horizontal accuracy, the strategy without GCPs using a post-processed trajectory outperformed the conventional result for absolute vertical accuracy. Regardless, the RMSE values resulting from both strategies would place the outcomes in the same ASPRS accuracy class both horizontally and vertically, meaning in practice that the results from both strategies are equally accurate. This shows the validity of surveying oil palm plantations with a minimal use of ground control points using the Trimble UX5 HP; an advantage considering that good GCP surveys are often difficult or impossible inside large and mature oil palm plantations.
Figure 5 illustrates the increase in detail that can be seen in 1 cm GSD deliverables as compared to 2.4 cm GSD deliverables. Due to the smaller features visible in the 1 cm imagery, points can be measured more precisely and accurately compared to the 2.4 cm imagery.
Figure 5: Demonstration of different GSDs (top: 2.4 cm, bottom: 1 cm).
Even though the vertical accuracy of Flight015 relative to its GSD (2.6 pixels in the best strategy) is worse than that of Flight020 (1.4 pixels), induced by the lower base:height-ratio and the less oblique viewing angles in Flight015, the absolute accuracy is still slightly better for Flight015 owing to the small GSD, especially in the strategies where steps were taken to eliminate any global shifts.
The horizontal accuracies achieved from processing flights 020 and 015 without any ground control points are very comparable and fall under the same ASPRS accuracy class, and are likely determined more by the on-board GNSS accuracy than the GSD. This shows that repeated UAS surveys can be done without GCPs while still ensuring that deliverables align over time with a 1-2 pixel level accuracy, which is very important for multitemporal analyses.
3.2 Automated software-based Oil Palm Monitoring
Whilst the described hardware and processing software has proven to generate results that are accurate enough for a detailed analysis, the efforts to develop an automated analysis application were focused on two main components:
1. Stable, meaningful & transferable analysis capabilities.
2. User Interface design to reflect requirements for usability in the given environment.
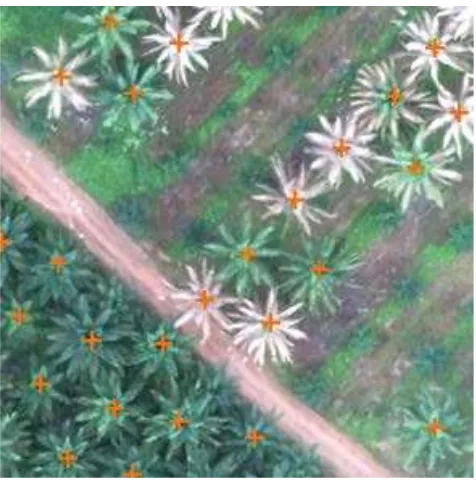
3.2.1 Oil palm tree detection using template matching: The template matching capabilities inside the Trimble eCognition software suite were taken and a library of oil palm tree templates was generated making use of the characteristic leaf structure. This allows detecting oil palm trees in any given block (determined by either a GIS layer or through on-screen digitization inside the described tool). Figure 6 illustrates the detection of individual trees where each detected tree is automatically marked with an orange cross.
Figure 6: Results of tree detection (orange crosses) using a template matching algorithm that was populated with templates
3.2.2 Tree crown delineation and health analysis: In addition to the identification of individual trees, each tree crown is automatically categorized into one out of three possible crown size classes (large, medium, small) which provide an indicator, together with the derived tree height, about the health of the tree. Furthermore, spectral properties for each tree crown (either in red, green, blue or in near-infrared, red, green spectral bands) is evaluated for spectral anomalies (Figure 7). The combination of spectral and growth irregularities provides plantation managers the information they need to conduct a series of appropriate countermeasurements like applying fertilizers, checking for diseases or cutting trees.
Figure 7: Tree health analysis (unhealthy trees in yellow). Tree crown delineation represented by green circles.
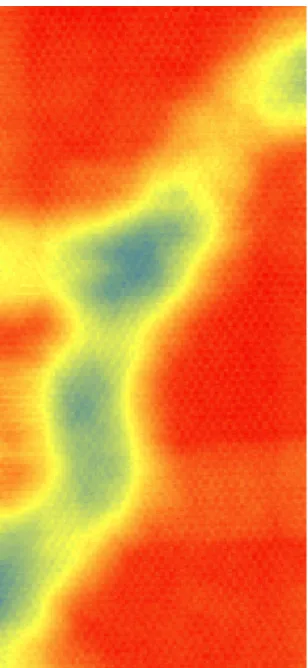
3.2.3 Mapping capabilities: In addition to the described per-tree analysis, it is possible to visualize the tree densities over regions of interest, so that operators can identify areas potentially suitable for new trees or detect areas where a block has to be thinned out (Figure 8). Having a complete understanding of location, size and health-status of trees lets plantation managers estimate yields and derive actions to increase production for a given plantation size. It further identifies areas for future tree planting activities that drive a sustainable plantation operation without the need to extend the plantation into adjacent undisturbed forests.
Figure 8: Tree density in trees/hectare (red: higher density, green: lower density)
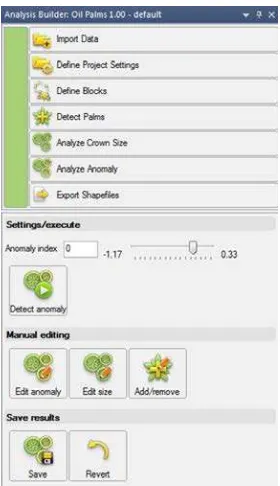
3.2.4 Guided Workflow and ease-of-use: With the formulated requirement to have a tool that is designed for end users without sufficient photogrammetric or remote sensing expertise, user interface design and usability becomes a critical component.
A set of interactive tools complement the solution to allow a user correcting misdetected or misclassified oil palm trees by adding, removing, or reclassifying (crown diameter and/or health status) individual palm trees.
Figure 9: Guided workflow concept of the application.
3.2.5 Export: The derived data consists of 1.) the region of interest (ROI) statistics (including number of palm trees per block (defined by block identification number = block-ID), area, statistical summary of individual tree attributes per block), 2.) Tree positions (including palm tree size, height, crown diameter, anomaly status, block-ID), 3.) Tree crowns (including palm tree size, height, crown diameter, anomaly status, block-ID).
The information can be exported to a Geographical Information System (GIS) for further utilization by generating printed or digital maps that can be used by the people in the field to efficiently execute the identified activities. Additionally, the corresponding GIS-Layer might be uploaded to a mobile device for in-field inspections of individual trees.
3.2.6 Automated Analysis Results: First results have been visually checked and were rated very positively. Although a full accuracy assessment has yet to be performed, first results indicate a detection rate of approximately 97% of individual trees. Further quantitative analysis has to be conducted to pressure test the performance.
A full analysis in one of the oil palm plantations, where data was acquired, the actual tree density was recognized to be lower than estimated by 6.8% resulting in the same percentage of fertilizer needs. Considering costs in the range of more than 10 Million USD for ammonium nitrate fertilizer, this would result in a cost saving of approximately $700,000 US at an 80,000 ha plantation.
4. CONCLUSION
4.1 High Performance GNSS and 36 MP camera
The combination of a high performance GNSS system and a 36 MP RGB camera allows the generation of results that are accurate enough to be suitable for oil palm monitoring even if the availability of GCPs is limited or not possible at all.
4.2 Oil Pam Monitoring Application
Using object-based image analysis in an easy-to-use solution allows users without detailed remote sensing or photogrammetry knowledge to efficiently generate meaningful results that provide better in-situ information and allow plantation managers to set appropriate tasks for their staff to gain productivity for instance by reducing fertilizer cost.
Beginning diseases can be recognized at an early stage and appropriate counter measurements can be executed before such a disease can spread across a larger area.
4.3 Field-Tests
Further field-tests will be conducted and feedback from end users will be requested and assessed in order to continuously improve the system as a whole as well as the individual components. Long-term productivity gains will also be monitored and reported.
REFERENCES
ASPRS, 2015. ASPRS positional accuracy standards for digital geospatial data. Photogrammetric Engineering & Remote Sensing 81(3), 26pp. American Society for Photogrammetry and Remote Sensing. www.asprs.org/standards-activities.html (08. Apr 2016).
Casella V. & Franzini M., 2005. Experiences in GPS/IMU calibration. Rigorous and independent cross-validation of results. Proceedings of the ISPRS Hannover Workshop 2005, High Resolution Earth Imaging for Geospatial Information, 6pp. Available online at www.isprs.org/proceedings (05. Apr 2016).
Grenzdörffer, G., 2009. Some thoughts for the geometric design of calibration fields. Presentation at the EuroDAC² Meeting, Barcelona, 12pp.
Lowe, D.G., 1999. Object recognition from local scale-invariant features. Proceedings of the International Conference on Computer Vision. pp. 1150–1157.
Lowe, D. G., 2004. Distinctive Image Features from Scale-Invariant Keypoints. International Journal of Computer Vision 60 (2): 91–110.
Norman, B., 2013. Principles and Criteria for the Production of Sustainable Palm Oil,
http://greenpalm.org/content/1072/Live/download/RSPO_Princi ples_Criteria_for_the_Production_of_Sustainable_Palm_Oil_2 013.pdf (13. Apr. 2016).
Pauly, K., 2016. Trimble UX5 HP – Increasing Your Productivity. White Paper. http://uas.trimble.com. (13. Apr 2016).
Ruysschaert, D. et al., 2011. Developing palm-oil production on degraded land.
Sime Darby, 2016. Palm Oil Facts & Figures, http://www.simedarby.com/upload/Palm_Oil_Facts_and_Figure s.pdf (13. Apr. 2016).
Stevenson, M., 2016. Palm Oil Research - Untangling the Great Palm Oil Debate, Kuala Lumpur, Malaysia, http://www.palmoilresearch.org/statistics.html (13.Apr. 2016).
Whitehead K. & Hugenholtz C.H. 2015. Applying ASPRS accuracy standards to surveys from small unmanned aircraft systems (UAS). Photogrammetric Engineering & Remote Sensing 81(10), 787-79.
5. APPENDIX
Flight ID Images Lens f (mm) GSD ( H error (m) V error (m) H error (px) V error (px) QA Nr of CP Meteo Wind (Bft) Country
Flight002 486 35 1.0 0.035 0.027 3.5 2.7 0 20 Overcast 1 BE
Flight009 114 35 1.0 0.021 0.037 2.1 3.7 1 6 Broken 2 BE
Flight014 557 35 1.0 0.05 0.042 5 4.2 0 16 Broken 3 BE
Flight015 620 35 1.0 0.042 0.032 4.2 3.2 2 17 Sun 1 BE
Flight022 621 35 1.0 0.073 0.032 7.3 3.2 0 18 Overcast 4 BE
Flight013 550 35 1.2 0.048 0.043 4.8 4.3 0 5 Overcast 0 NZ
Flight016 517 25 1.5 0.063 0.033 4.2 2.2 1 17 Overcast 3 BE
Flight021 699 25 1.5 0.059 0.033 3.9 2.2 1 16 Sun 5 BE
Flight003 300 35 2.0 0.05 0.042 2.5 2.1 0 16 Overcast 4 BE
Flight004 303 25 2.0 0.042 0.056 2.1 2.8 0 17 Overcast 4 BE
Flight005 300 25 2.0 0.041 0.038 2.1 1.9 0 17 Broken 1 BE
Flight006 295 35 2.0 0.063 0.081 3.2 4.1 1 16 Broken 1 BE
Flight024 291 35 2.0 0.058 0.076 2.9 3.8 1 17 Sun 5 BE
Flight001 399 15 2.4 0.047 0.023 2 1 0 20 Overcast 1 BE
Flight017 330 15 2.4 0.042 0.061 1.8 2.5 0 18 Sun 3 BE
Flight020 388 15 2.4 0.041 0.034 1.7 1.4 0 18 Sun 5 BE
Flight019 1324 15 2.9 0.076 0.051 2.6 1.7 1 8 Sun 3 AUS
Flight018 691 15 3.2 0.072 0.097 2.3 3 0 6 Sun 0 AUS
Flight007 195 15 3.8 0.052 0.061 1.4 1.6 0 21 Broken 2 BE
Flight023 117 15 4.0 0.035 0.057 0.9 1.4 2 11 Sun 5 BE
Flight025 52 15 4.0 0.04 0.042 1 1.1 2 8 Overcast 2 BE
Flight008 140 15 4.8 0.057 0.057 1.2 1.2 1 17 Broken 2 BE
Flight010 179 15 5.0 0.122 0.068 2.4 1.4 0 12 Sun 1 NZ
Flight011 56 15 5.0 0.105 0.053 2.1 1.1 0 12 Sun 0 NZ
Flight012 108 15 9.0 0.115 0.188 1.3 2.1 0 12 Broken 0 NZ
Min 0.9 1.0
Max 7.3 4.3
Average 2.7 2.4
Median 2.3 2.2
St Dev 1.5 1.1