STRUCTURE FROM MOTION SYSTEMS FOR ARCHITECTURAL HERITAGE. A
SURVEY OF THE INTERNAL LOGGIA COURTYARD OF PALAZZO DEI CAPITANI,
ASCOLI PICENO, ITALY
E. Ippoliti a, A. Meschini b, F. Sicuranza b
a
Dept. of Architectural History, Representation and Conservation (DiSDRA), Sapienza University, Piazza Fontanella Borghese, Roma, Italy – [email protected]
b
School of Architecture and Design (SAD), University of Camerino, Viale della Rimembranza, Ascoli Piceno, Italy – (alessandra.meschini, filippo.sicuranza)@unicam.it
Commission V, WG V/4
KEY WORDS: Structure From Motion, Image-Based Survey, 3d Data Processing, Architectural Survey, Architectural Heritage Representation, Architectural 3d Modeling
ABSTRACT:
We present the results of a point-cloud-based survey deriving from the use of image-based techniques, in particular with multi-image monoscopic digital photogrammetry systems and software, the so-called “structure-from-motion” technique.
The aim is to evaluate the advantages and limitations of such procedures in architectural surveying, particularly in conditions that are “at the limit”. A particular case study was chosen: the courtyard of Palazzo dei Capitani del Popolo in Ascoli Piceno, Italy, which can be considered the ideal example due to its notable vertical, rather than horizontal, layout.
In this context, by comparing and evaluating the different results, we present experimentation regarding this single case study with the aim of identifying the best workflow to realise a complex, articulated set of representations—using 3D modelling and 2D processing—necessary to correctly document the particular characteristics of such an architectural object.
1. INTRODUCTION
Continual technological and computational advancements made in a particularly short period of time, estimated at no longer than five years, have oriented the development of multi-image monoscopic digital photogrammetry systems and software towards automatising the process. This is the main motivation for the present paper, which, through a particular structure-from-motion experiment, reflects on the role of the operator/surveyor, a role that would seem marginal today in a field where scientific and technological progress have rendered the procedures ever more automatised. In contrast to this, one of the objectives of the present paper is to underline how, especially in these cases, the role of the operator is still central. The operator is required to have not only a deep understanding of the tools and systems used, but also adequate preparation, which allows for procedures to be directed according to the goals of the survey and therefore to interpret and evaluate the results obtained. For example, even reflecting just on the question of the metric/geometrical and chromatic accuracy of the restitution, one can understand the reasons why the operator is so important.
With regard to the accuracy, the literature regarding structure-from-motion procedures highlights some particular factors, such as the characteristics of the photographic equipment, which greatly influence the quality of the orientation and the subsequent restitution. Using amateur cameras, these can be controlled only by knowing how to evaluate the calibration measures of the camera or the results of the self-calibration (Brown, 1971; Fraser, 1997; Grün & Beyer, 2001). Other factors depend on the correct design and execution of the photograph with respect to the number and position of individual snapshots and the arrangement of the optical axes.
With a small number of photos or a photography scheme that does not consider the computational procedures used by the restitution system, the data will not be very reliable. Upon closer inspection, these are factors that essentially depend on the operator, who is certainly required to have the necessary technical abilities to control and correctly manage the procedures. These are skills that allow the operator to exercise control and verify the quality of the results, which is even more necessary the more automatic the processes become.
2. CASE STUDY. THE COURTYARD OF THE
PALAZZO DEI CAPITANI IN PIAZZA DEL POPOLO IN ASCOLI PICENO
In order to investigate the use of structure-from-motion systems and place particular attention on the role of the operator, an experiment was conducted on a single case study chosen for its particular characteristics: the Courtyard of the Palazzo dei Capitani in Piazza del Popolo in Ascoli Piceno (Figure 1). Piazza del Popolo, the “squarein the form of a palazzo” (Troli, 1984), or the square which gives the impression of being a hall because it is surrounded by porticoes (Piovene, 1956) assumed its current configuration after many changes and renovations beginning in the second half of the thirteenth century. In the thirteenth century the buildings facing the square were all very different; most of them were humble workshops or shops used by craftsmen or merchants. At the time, the square – more square and smaller than it is today - functioned as the venue for the famous Herb Market. During the second half of the thirteenth century, the first nucleus of the Palazzo dei Capitani del Popolo was built in the middle of the long west side. It was only in the fourteenth century that the Palace was enlarged by incorporating some of the nearby buildings; around this time The International Archives of the Photogrammetry, Remote Sensing and Spatial Information Sciences, Volume XL-5/W4, 2015
these buildings were formally united towards the square by creating a new, unitary façade. Further renovation of the Palazzo dei Capitani del Popolo took place in the first half of the sixteenth century. This included the very unique façade along Via del Trivio by Cola dell’Amatrice, redesigning the main façade with the insertion of the triumphal central door and the monument to Paul III (all between 1519 and 1520), and changes to the interior, with the realisation of the current courtyard.
The formal layout of the courtyard dates from 1549, when the architect Camillo Merli introduced into the already small rectangular space a system of porticos and loggias distributed differently on the different levels. The arrangement of these connective elements was aimed especially at resolving the problem of distribution, which is why the solution identified is not the same on every level. In fact, the porticos on the first two levels, with their overhanging loggias, are present only on two of the four sides. Together with the presence of a deep smaller side of length 5.2 m and a longer side of length 7.8 m. The fourth and last level, with the same dimensions as the third, is instead equipped with a simple gallery. This is, therefore, an enclosed space whose above-mentioned peculiarities present a particular proportion between footprint and height, with a volume that is relatively tall with respect to the reduced horizontal dimension. In fact, comparing the height with the shorter sides of the portico and loggias on the different floors, the first two levels give a ratio of about 2 to 1, while on the third and fourth levels the ratio is even closer to 3 to 1.
Figure 1. The courtyard of Palazzo dei Capitani del Popolo
3. DATA ACQUISITION AND DATA PROCESS
3.1 The workflow
The combination of these size and morphological characteristics, which render the different phases of the survey more complex, make the case study the perfect example of one of the established objectives, i.e., testing and verifying the possibility of using structure-from-motion systems even in limiting conditions.
With such an intent, the article therefore pays particular attention to the different phases and main issues that qualify the use of such technologies, illustrating how the complexity of the particular operating conditions (or the characteristics of the survey object) guide the entire process, directing all the steps in the different phases of the procedure, such as: the choice of optics, the photography strategies, quality control of the auto-calibration, the accuracy of the point cloud, the means of dealing with the digital models, etc. With the scope of expanding upon the different steps through theoretical/experimental considerations, we illustrate the choices that guided the experimentation, that is, the workflow adopted. Starting from a comparative analysis of the different point clouds, the workflow is aimed at appropriately describing the unique characteristics of this architectural object and documenting the process in detail.
The workflow adopted in the experimentation can be summarised concisely in the three “usual” main steps. The steps are: operation planning, starting from prior knowledge of the survey object within the framework of the survey goals; data acquisition via photography; and the use of the photos, that is, processing the representations. We mention again the importance of correctly designing the survey, which always requires prior knowledge, critiques, and awareness of the object to be surveyed, as well as a clear definition of the objectives. This preliminary but deep approach to the theme is fundamental for the subsequent evolution of the survey since it allows the operations to be carefully planned not only as a function of the survey goals but also as a function of the characteristics of the building and state of the places in which the survey is made. The final phase of the photography project should first guarantee the total photographic coverage of the subject with an adequate superposition between consecutive photos, but also the best photographic quality possible so the photos can be used correctly and profitably.
In using the structure-from-motion systems, it is evident how the accuracy of the rendering is particularly dependent on the characteristics of the photographs. Different elements should be considered, such as the distribution of the snapshots and their orientation, the average object distance, the characteristics and quality of the optics, and especially the camera sensor. The latter in particular contribute to the resolution of the rendering. At this point it is useful to recall that in traditional photogrammetry, control of the restitution scale was derived from the scale of the photo. In turn, this was a function of the the concept of nominal scale was introduced. This derives from the pixel, the smallest indivisible unit, or elementary component, of a digital image.
The minimum value that can be represented (whatever the scale of representation) is conventionally fixed at 0.3 mm. If the dimension of the object represented in a pixel of a photographic image (mr) is known, it is then possible to obtain the nominal scale of a photo, which is equal to mr/0.3 mm. For example, if the size of the object represented in a pixel is 15 mm, the nominal scale of the photo is equal to 15 mm/0.3 mm, or 1:50. This means that at the nominal scale of 1:50, the pixel represents a segment of 1.5 cm (0.3 mm x 50). With the physical dimension of a sensor pixel (p), the focal length (f), and the object distance (d), it is possible to determine the size of the object represented in one pixel of a photographic image, which is called the “image resolution” (mr), expressed with the relationship mr = p * d / f .
For the photography projects adopted for the tests, the horizontal and vertical superposition between consecutive shots was normally 80% but at any rate never less than 60%. The panorama and convergent-axis schemes were favoured because they guarantee better results in the orientation procedures, but the parallel-axis scheme was also tested. The distance between camera and object was assessed from time to time for the different cases in relation to the characteristics of the object, the survey goals, the operating conditions, and the photographic equipment available, with respect to the camera body and the optics. Different photography campaigns were made based on what was established for the photography projects Prior to image processing, the quality of the images was verified and, if necessary, they were either discarded or adjusted to improve the exposure, brightness, chromatism, etc.
The photo-acquisition phase was followed by the utilisation phase. In the first step related to image processing, which can properly be defined as “structure from motion”, the goal is to orient the system by determining the camera parameters and parameters to correct distortions. This step ends with the creation of a low-density point cloud.
Once the orientation is resolved, the second step extracts a denser point cloud according to different accuracy criteria. The computational procedure used is called “dense matching” and consists in analysing the details of the photographic images, which have already been oriented, in order to identify the homologous points from which the points in the three coordinates can be derived.
In the first two steps to process the snapshots, the proprietary software Agisoft Photoscan was used (Fassi, Fregonese, Ackermann, De Troia, 2013; Remondino, Spera, Nocerino, Menna, Nex, 2014). In addition, tests were made at the end of the first step in order to verify the results generated by the automatic orientation procedures, i.e., self-calibration. For small groups of snapshots chosen as samples, the success of automatic corrections was compared to those made using software specifically dedicated to calibrating photographic equipment. In particolar, the images corrected with Photoscan were compared to those corrected with PhotoModeler.
The third step in the image-processing phase is aimed at transforming the dense cloud into a polygonal model. In this step, particular attention was placed on the effects of tessellation in dealing with zones characterised by gaps or a low point density. In fact, in these cases, the polygons were created by interpolating the data available in the immediate surrounding area, and it was therefore necessary to be very familiar with the algorithms used by the software, or at least the corresponding
effects, and to favour those systems that include options to adjust the degree of interpolation.
Different methods were adopted during the experimentation to transform the dense cloud into a polygonal model. Photoscan continued to be used for clouds deriving from it, making use of the different interpolation options. In particular, in dealing with gaps, the “Enabled” option was always used because it reduces the metrical and geometric disturbance, but intervenes automatically only when reconstructing small gaps.
The fourth and last step in processing the images was aimed at reconstructing the visual appearance, i.e., the material and chromatic appearance, of the surveyed object, resolved by dealing with the surfaces of the model. In all tests, a procedure appropriately developed in 3DS Max Autodesk was used with scripts to automatise the principal steps: importing the oriented snapshots, generating materials to reproject the photos on the polygonal model, and processing high-resolution renderings (Sicuranza, 2013). The decision to use this method arises from the possibility of controlling the different steps and its appropriateness for realising high-resolution geometric and chromatic renderings from which orthographic and elaborate two-dimensional features can be derived.
Following this procedure, the first script, which correctly orients the snapshots, was run in 3DS Max Autodesk. The script also generates fictitious geometries associated with each photo, called “dummies”, which cannot be rendered but which are then used to memorise the material connected to the snapshot.
Once the snapshots have been oriented, the polygonal model is imported and the second script is run. For each snapshot, the script processes a material that projects the photo on the geometry, using the direction of the snapshot as the projection direction and the associated photo as the image. The material used is composed of an auto-illuminating shader whose shading is given by an “ambient occlusion” map to which the photo to be projected is added as texture. It is thus possible to render the model without using any light since it is already simulated by the ambient occlusion map together with the chromatic and light information used in the photo providing the texture.
At this point it is possible to impose a view, which is orthographic in our case, and generate as many renderings as there are snapshots, considering that each rendering will present the geometry mapped with a single snapshot. The third script realises the renderings in sequence: the material of the individual snapshot is automatically assigned and the calculation for all the snapshots specified in the script is made automatically.
3.2 Data Acquisition
The particular characteristics of the courtyard, especially the dimensional characteristics, therefore made all the different survey phases exceedingly complex, starting with the photo-acquisition campaign. In establishing the plan of photography, highly recommended optics, i.e., the Nikon Nikkor 15 mm f/3.5 Ai-S, were chosen and mounted on the Nikon D700 equipped with a full-frame DSLR sensor (36 x 23.9 mm) with a maximum resolution of 4256 x 2832 pixels (12.1 million effective pixels) and a physical pixel size of 0.0084 mm (p = 23.9 mm/2832). The panorama scheme was then chosen, due to both the emptiness of the courtyard overall and the internal spaces of the loggias (Figure 2).
Figure 2. Diagrams of photography campaign in the courtyard
Such a photography strategy consists in taking a series of snapshots for each station in different directions, keeping the camera horizontal (landscape mode). In this way, the groups of images acquired are considerable portions of spherical images, and the horizontal and vertical superposition between the individual snapshots give rise to a virtual extension of the field of view.
The different snapshots were designed to provide ample overlaying areas between successive snapshots, both in the horizontal and in the vertical directions. The overlapping areas were around 80% where possible, but never less than 60%. Specifically, since the panorama scheme was chosen, the means by which the snapshots were taken was different for the different levels due to the different operating conditions. Two series of snapshots were made for the first level. One was made from the greatest possible distance (under the porticos and in the entryway) and the second was made from the centre of the open space (close to the projections from the colonnade) in order to have photographic coverage without shaded areas. Obviously on the upper levels it was possible only to realise the large-distance series of snapshots, with stations in the galleries under the loggias (Figure 3).
Figure 3. Screenshots of the snapshots on the ground floor (top) and on the first floor (bottom)
The particular volumetric configuration of the courtyard, which gives rise to very different lighting conditions, was also considered during the photography campaign. The main source of light is natural light entering the open space from above. This obviously creates very different exposure conditions between the higher and lower zones, as well as between the façades directly facing the central space and those hidden beneath the porticos and loggias.
The necessity of taking snapshots with very different exposures was already considered when planning the campaign. For this reason, the images were saved in both JPG format and RAW format, which allows eventual exposure defects to be compensated for by taking advantage of its greater colour depth (12 bit) with respect to the JPG format (8 bit). Snapshots were taken contextually, with the correct exposure for the well-lit parts, underexposing those in the shadow. The latter were then corrected by brightening only the areas in shadow, without overexposing the light area, which also avoided the burned effect (Figure 4).
Figure 4. Comparison of the exposures of the snapshots in the courtyard. JPG format (left) and RAW processing (right)
Once the photography project was established, 152 snapshots were made, distributed thus:
- 26 related to the deep entryway, positioned at a height slightly lower than the courtyard and connected to it by a wide stairway, with 18 horizontal snapshots for the faces and 8 for the cross vault of the intrados;
- 84 related to the central space of the courtyard, with 38 horizontal snapshots, 35 looking up, and 11 looking down; - 42 related to the vaulted spaces of the porticos and loggias, with 22 horizontal snapshots and 20 to capture the cross vaults of the intrados.
For the panorama scheme, 4–6 snapshots were made from each station as follows:
- at least three snapshots with nearly horizontal optical axes, one of which was as perpendicular as possible to the average plane of reference, which passes through the face of the subject of the photo;
- 1 or 2 snapshots with the optical axis pointing upwards or downwards.
In particular, the snapshots where the optical axis was horizontal but oblique with respect to the average plane of reference were made to obtain a better result in the orientation phase since the spatial reconstruction is made by identifying homologous points distributed evenly throughout space, that is, on many planes at different depths. In contrast, the snapshots where the optical axis was horizontal but perpendicular to the average plane of reference were made in order to extract a better chromatic structure due to the better orientation.
Thirteen photos were discarded on the basis of a qualitative analysis because they presented small movements. Through a test made on a small group of photos chosen as a sample, the results of the photos corrected with PhotoModeler were compared to those automatically corrected with Photoscan, the structure-from-motion system chosen for this experimentation. Once a positive result was verified, the phase aimed at processing the restitutions began (Figure 5).
Figure 5. Upper left: An original photographic image from the campaign. Upper right: Photo corrected by Photomodeler. Lower left: Photo corrected by Photoscan. Lower right: The photo corrected with Photoscan was scaled and aligned with the
PhotoModeler correction and superimposed with 50% opacity.
3.3 Data processing
In the first step, which oriented the photos, the 139 snapshots were processed simultaneously in order to obtain a more accurate result, even though this lead to a greater processing time. Once the orientation was made, analysis of the sparse cloud showed that six snapshots had orientation errors that were deemed to be too large. These snapshots were removed and the orientation quality was again verified. Processing then moved on to the next step, which extracted the dense cloud using the high quality setting (equal to ¼ of the area, i.e., of the resolution).
The dense cloud was then recleaned, that is, the points with a position different from what was expected were eliminated. The operation was carried out automatically using the option to filter out anomalous points (outliers), which were selected according to statistical analysis.
Among the three filtering options provided by the program, we chose the one that achieved a more consistent selection because it produced a cloud characterised by greater dimensional accuracy, even if it was less dense. The point cloud produced at the end of the process was therefore composed of more than 30 million points: 30,778,595 to be exact (Figure 6 and Table 1).
Figure 6. The dense point cloud after dense matching. Views
Photo group processed
Total snapshots
Snapshots used
Features extracted (sparse cloud)
Average alignment error (pixels)
Number of
points in the dense cloud
All 152 133 508011 0,52 30.778.595
Table 1. Characteristics of the point cloud
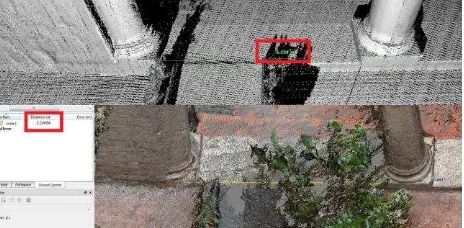
In the third step, the problem of the scale of the dense cloud was resolved in an operation called “scaling”, for which it is necessary to have reference measurements for the object photographed. This phase was accomplished by selecting three non-aligned points that were also easily recognisable on the cloud extracted by Photoscan. The points were selected from a laser scan made previously for another research project. To carry out the scaling procedure for the cloud in Photoscan, the three points were first identified, highlighted with markers, and assigned with the three-dimensional coordinates obtained from the laser scanner (Figure 7). Based on the coordinates assigned to the markers, the software scaled and oriented the cloud, calculating an average uncertainty of 34 mm, a variance also measured from samples on both clouds (the one from the scanner and the one from structure-from-motion(Figure 8).
Figure 7. The point cloud scaling procedure in Photoscan
Figure 8. Sample measurements to check the scaling and orientation of the point cloud in Photoscan The International Archives of the Photogrammetry, Remote Sensing and Spatial Information Sciences, Volume XL-5/W4, 2015
Referring to the details in the section “The workflow”, the resolution for images in the tests on the courtyard was 4.2 mm. The physical size of a pixel was about 0.0084 mm, the average object distance was 7.5 m, and the focal length was 15 mm (0.0084*7500/15). In other words, each pixel at the centre of the original photo represents a 4.2-mm portion of the subject.
Recalling that the dense cloud was extracted with high quality, given the quantity of photos to process simultaneously, the software therefore worked with images at a quarter of the original resolution, where the pixels at the centre of the photo each represent a portion of the subject of about 4.2 mm * 4, i.e., 16.8 mm. The resolution of the representation expected is therefore 16.8 mm, which is coherent with the visual analysis. Therefore, details are only recognisable if they are about 2 cm or larger. Summarising, the overall uncertainty of the courtyard area is estimated to be around 34 mm, while the dimensional resolution of the restitution is about 16.8 mm.
We then recall that the admissible tolerance, i.e., the uncertainty, in measurements and survey drawings is fixed as the product of the so-called graphing error (+ 0.3 mm) and the denominator of the representation scale adopted. This is, for example, equal to 3 cm for 1:100-scale drawings and 1.5 cm for 1:50-scale graphics. Therefore, in the tests, graphical drawings (3D models and 2D restitutions) can be derived with a scale of detail of 1:50, while the reliability of general measurements will agree with the reliability of a survey at a scale of 1:100.
Figure 9. Snapshots of the capital from different distances and with different focal lengths
Figure 10. The difference in density between the capital represented by the entire courtyard point cloud (69,000 points) using 15-mm optics and the capital extracted with detail photos
(4,156,625) taken with 70-mm optics
It can be assumed that with greater computational power to process photographic images with better resolution, and with high-quality cameras and optics, even more accurate metrical and geometric information could be derived. Figures 9 and 10 show the result in the relief of some details with shooting close-ups.
The next phase was aimed at transforming the point cloud into a polygonal model. The steps are characterised above all by the effects of tessellation and treatment of the gaps. Therefore, the cloud was examined to identify areas with evident “shortages” of the restitution, searching contextually to identify the principal reasons why. Shortages due to excessively reflective surfaces were found in an internal part of the portico on the first floor where there was a glass door, in a recently shined portion of the flooring on the ground floor, and where glass was installed to view the archaeological ruins discovered under the palace. Other missing points or sparse points characterised by low accuracy were found in different areas on the second floor. In these cases, the defects and gaps were most likely due to the particular characteristics of the courtyard area, the lighting, and the tall, narrow spatial proportions, which made the photography conditions difficult, yielding inadequate images.
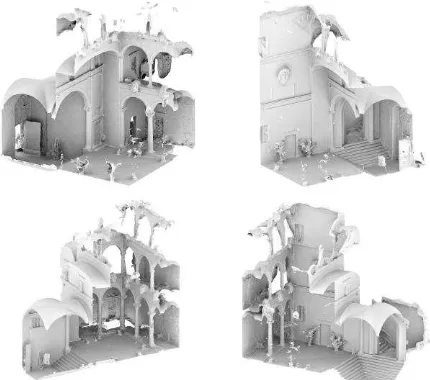
During the tessellation procedure in Photoscan, treatment of the gaps was done with the “Interpolation” command with three different options: leaving the gaps unaltered (“Disabled”), intervening only on the smallest gaps (“Enabled”), or acting indiscriminately on all the gaps (“Extrapolated”). The “Enabled” option was chosen for this experimentation. It allowed the metrical/geometric noise with the three-dimensional reconstruction to be reduced, even in zones with small gaps. Although it still lacked surface treatments, the polygonal model obtained at the end of this phase already permitted an in-depth understanding of the layout and arrangement of the courtyard space (Figure 11).
Figure 11. Initial processing of the polygonal model for the courtyard. Views
The last step was dedicated to visualising the appearance, i.e., the materials and colours, which was done by treating the surfaces of the model (texture mapping). This deals with projecting the images made during the photo-acquisition campaign onto the numerical surfaces of the non-decimated model in order to create a high-resolution geometric and The International Archives of the Photogrammetry, Remote Sensing and Spatial Information Sciences, Volume XL-5/W4, 2015
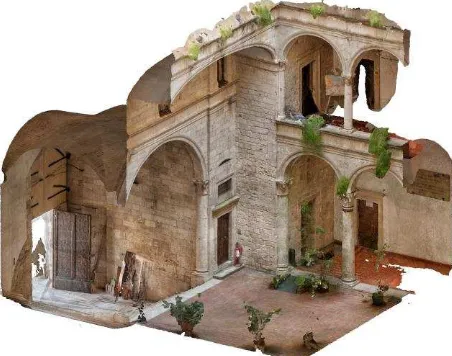
chromatic static rendering. This was used to create orthographical images and then two-dimensional drawings (Figures 12 and 13). Autodesk 3DS Max was used to reproject the photo according to the procedure illustrated in the section “The workflow”. To texturise the complete model for use in visualising combination views (PDF 3D, online 3D player), a mesh with a low number of polygons was used, projected with the photos that were then blended (Figures 14 and 15).
Figure 12. Rendering in orthographic projection of the four faces of the courtyard processed from the textured model
Figure 13. Example of two-dimensional images of the floors and perspective sections obtained
Figure 14. Initial results obtained from texture-mapping
Figure 15. Initial results obtained from texture-mapping
4. CONCLUSION AND FUTURE WORK
In conclusion, the present article demonstrates how the role of the operator is still central in the entire surveying process, even when particularly automatised procedures such as the structure-from-motion technique are adopted. In fact, it is always the operator who is asked to rigorously check the input (photographic campaign, snapshot quality, auto-calibration control) and output (accuracy and density of the point cloud, the presence of gaps and their treatment in converting to a polygonal model, etc.).
But above all, the operator/surveyor is required not only to have extensive knowledge of the instruments and systems used, but also adequate preparation, which will allow him or her to guide the procedures according to the aims of the surveying process and therefore interpret and assess the results obtained.
Developments regarding in the specific tests presented here have been made recently. A second survey campaign was conducted eight months later with new snapshots chosen after assessing the data presented in this essay. In general, the aim was for greater survey coverage, both integrating it with parts of the courtyard that had not been covered (additional data for the second level) and improving the quality of the survey by compensating for areas in the point cloud that showed major gaps in the first campaign.
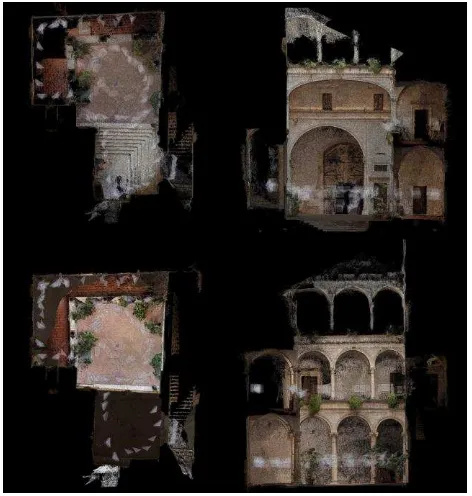
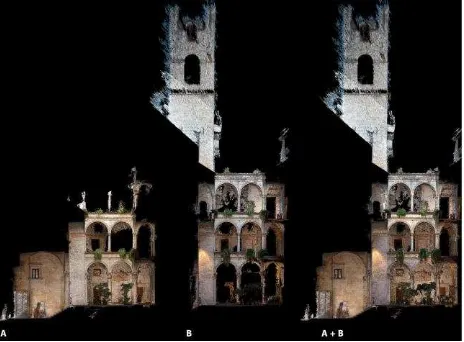
Data processing is currently moving in two directions. The first deals with aligning the two clouds obtained from two successive surveys (Figures 16 and 17) and the second relates to processing both campaigns together in order to verify the possibility of processing two sets of data with different lighting conditions. Comparing the two procedures will illustrate the possibility of refining the whole body of data not only in terms of greater final point-cloud density, but also in terms of obtaining more accurate results to create the single texturised polygonal model.
Figure 16. Sections of the point cloud in orthographic projection obtained from the two photography campaigns. A: first campaign, B: second campaign, A+B: overlay of the two campaigns
REFERENCES
Brown, D., 1971. Close-range camera calibration. Photogrammetric Engineering, 37(8), pp. 855-866.
Fassi, F., Fregonese, L., Ackermann, S., De Troia, V., 2013. Comparison between laser scanning and automated 3D modelling techniques to reconstruct complex and extensive Cultural Heritage Areas. In: The International Archives of the Photogrammetry, Remote Sensing and Spatial Information Sciences, Trento, Italy, XL(5/W1), pp. 73-80.
Fraser, C. S., 1997. Digital self-calibration. In: ISPRS Journal of Photogrammetry & Remote Sensing, 52(4), pp. 149-159.
Grün, A., Beyer, H., 2001. System calibration through self-calibration. In: A. Grün, & T. S. Huang (Eds.), Calibration and orientation of cameras in computer vision,. Berlin, Germany: Springer, pp. 163-193.
Ippoliti, E. (Ed.), 2013. Valorizzare il patrimonio culturale: esperienze per Ascoli Piceno - Shedding light on the Cultural Heritage: the Ascoli Piceno experience. Roma: Aracne.
Meschini, A., Petrucci, E., Rossi, D., Sicuranza, F., 2014. Point cloud-based survey for cultural heritage – An experience of integrated use of range-based and image-based technology for the San Francesco convent in Monterubbiano. In: The International Archives of the Photogrammetry, Remote Sensing and Spatial Information Sciences, XL(5), pp. 413-420.
Piovene, G., 1957. Viaggio in Italia. Milano: Mondadori.
Remondino, F., Spera, M.G., Nocerino, E., Menna, F., Nex, F., 2014. State of the art in high density image matching. In: The Photogrammetric Record, 29(146), pp. 144-166.
Rozzi, R., Sori, E., 1984. Ascoli e il suo territorio: struttura urbana e insediamenti dalle origini ad oggi. Cinisello Balsamo (Italy): Silvana editoriale.
Sicuranza, F., 2013. Sperimentazione di sistemi di structure from motion per la restituzione di apparati decorativi (Doctoral dissertation). La Sapienza Università di Roma, Dipartimento di Storia, Disegno e Restauro dell’Architettura. Dottorato di Ricerca in Scienze della Rappresentazione e del Rilievo, Scuola Nazionale di Dottorato, http://hdl.handle.net/10805/2116.
Figure 17. Sections of the point cloud in orthographic projection obtained from the two photography campaigns. A: first campaign, B: second campaign, A+B: overlay of the two
campaigns