Extraction of Peak Feature Based on Synthetic Sinc Model in SAR images
Y.Y. Konga,b, Henry Leungb(IEEE Fellow),Yan Sib,Xin Shiyuba Nanjing University of Aeronautics and Astronautics, College of information science and technology, 29 YuDao street, Nanjing, JiangSu, China,210016,[email protected]
b University of Calgary, Department of Electrical and Computer Engineering,2500 university Drive.N.W.,Calgary,Alberta,Canada,T2N 1N4, [email protected]
KEY WORDS: SAR Image, Peak Feature, Point Scatters, Gaussian Mask, Synthetic Sinc Model, Fluctuations Analyze.
ABSTRACT:
Peak is an important feature in Synthetic Aperture Radar(SAR), which represents essence of scattering centre. There are two general approaches in the literature to extract peak. One way is to extract peak after speckle suppression filtering. Using this method, the extracted feature is in accurate, and the algorithm is more complicated. Another is that detecting the amplitude of the peak directly. In order to have a fast and accurate peak extraction, we proposed using the Sinc peak model algorithm in this paper. It directly extracts peak features from the original SAR image without any noise suppression filtering, which is instead of Gauss mask function. The estimation parameters of peaks use QE theorists. Finally, we can get accuracy three parameters to describe peak features. Analytic fluctuation of parameters is compared with Gauss model peaks using truth SAR images. Experimental demonstrate that the new algorithm is more effective than others for extracting peak features in SAR images.
1. INSTRUCTION
SYNTHETIC aperture radar (SAR) images contain bright spots representing locations where strong back-scatters are present in the scene. These bright spots are pixels having localized peak intensities, called image peaks. Peaks are important features in SAR. They are denoted as local maxima in images, which represent scattering centres. Their relative positions and amplitudes can be shown as the geometric form and the surface structure of the targets. Information obtained about the peaks can be applied to: improve peak matching in the automatic target recognition (ATR) problem; false-alarm rate detection; and identification of imaging artifacts, such as the sidelobes of bright peaks.
There are two areas involving peak extraction: electromagnetic field and imagery field. Various numerical methods for calculating electromagnetic field distributions such as the method of moments (MoM), finite-difference-time-domain (FDTD) method and the finite element method (FEM) are considered in the literature. They usually require an accurate discretization of the structure relative to wavelength. At high frequencies, this leads to an immense computational effort for a large structure. Therefore, these methods are usually applied to problems of a smaller scale[1]. Hybrid[2] or asymptotic methods based on geometrical optics (GO) or physical optics (PO) are found more approximate for problem of a large scale. Physical optics may also be extended by physical theory of diffraction (PTD)[1], the method of equivalent currents (MEC)[3] and impedance boundary condition (IBC) techniques[4]. Canonical point scatters, such as a trihedral, are characterized by the fact that their peak intensities are located at a single location in the image[5]. Peak models have also been developed to predict the intensity of peaks due to canonical point scatters[6]. However, in imagery field, there are few papers about peak extraction, and most papers attributed feature extraction of scattering centers like as [7,8]. In the literature, peaks are usually extracted after speckle suppression filtering in order to prevent its influence on the peak in SAR image. There is also a peak extraction method based on the constant false alarm probability (CFAR) principle [9]. However, peaks extracted after speckle suppression filtering are not precise enough and the algorithms are computationally
complex. They cannot satisfy the target requirement for target recognition with large samples. Amplitude of peak is instead all of peak features is then proposed to address there issues for target recognition[10]. However, ignores the width of peak feature, and causes an incomplete extraction of peak feature. In addition, its recognition rate is low. In this paper, we propose a physical peak model to have a more complete peaks description instead of width, amplitude, and fluctuation. We then adopt a statistical estimation fluctuation function that provides estimates of feature uncertainty.
The remainder of the paper is organized as follows. Section II describes the proposed Synthetic Sinc Model and its comparison with Gauss model. In Section III, two estimation methods are used to determine the parameters of peak feature, and fluctuation algorithm based on the Synthetic Sinc Model is presented. Section IV presents a simple peak parameter estimation and fluctuation algorithm based on Synthetic Sinc Model. Experimental results are obtained from simulated data using isolated point scatter with 10db multiply noises. Comparison with Gauss peak model is also presented. Using the real target chips of SAR image do the experimental results further confirm the benefits of the proposed approach. Section V provides the conclusions.
2. PEAK MODEL DEVELOPMENT
According to radar imaging theory, an echo can be represented using the distance and direction coordinates. That is,
0 0
2
, 2 , exp 4 ,
exp 2 ,
r a c
r
s x r A r R x r x x j f R x r c
j K r R x r
(1) whereA is a complex constant given by,
exp
A j
A . (2)
And A is the modulus value of A. The window function ωa at
the azimuth direction is the Sinc function. The window function
ωr at the range direction is the rectangle function. r and x are the
s0(x, r) is obtained when the ground backscattering coefficient g0(x, r) goes through a 2D linear system h(x, r). The system impulse response h(x, r) can be divided into the convolution of the impulse response in azimuth direction ha and in range
direction hr are given as follows:
Our goal is to obtain an exact value of A. We make convolution between hs(x, r) andh(x, r) to get:
, s
,
,h x r h x r x r . (7)
The filter that satisfies (7) above can have good performance on solving the convolution. In fact, it can be proved that h(x,
r)hs(x, r) in both azimuth and range directions are Sinc function instead of unit impulse response δ(x, r). For Sinc function, there are peak sidelobes, which degrade the quality of imaging. We can make a single point echo. When the point echo is a circle area function Somb, (x0, y0) is the center of coordinate
The simplified circle area function Somb is approximated by:
2 1
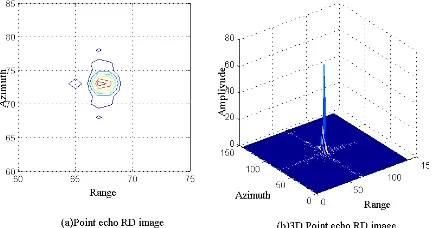
Range-Doppler(RD) imaging processing, we obtain the image in Fig. 1.Figure 1.Point echo RD image
In Figure 1, the point target after imaging isn’t a circle area function Somb while it is a 2D Sinc function which is shown below:
, sin
0
x
sin
0
y
I x y H c xx c yy . (10)
2.1 Parameter Estimation based on QE peak
Sinc function with Gaussian mask is equal to the Fourier transform of Gaussian function multiplying rectangular window in frequency domain. Here, we transfer the result to frequency domain for solving the problem of parameter estimation. Assume sinc(πx)sinc(πy) is unit 2D Synthetic Sinc Model. The width of Sinc function in time domain is τx, τy. The width of
time domain respectively; τu’,τv’ represents radius of rectangle
bottom at x axis and y axis in frequency domain respectively. The Fourier Transform of Gaussian Function and Sinc function can be expressed as:
Adopting the form of (13), (14). A simple form of IFT can then be obtained as IFT is given as,
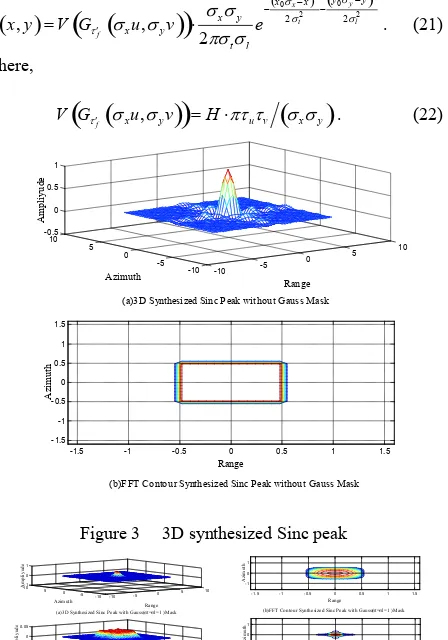
Therefore the 2D convolution of f(x, y) can be approximated as the multiple of volume V(Gτf’(σxu, σyv)) and Gaussian function, as be described in Fig.3 and Fig.4.
(a)3D Synthesized Sinc Peak without Gauss Mask Azimuth(b)FFT Contour Synthesized Sinc Peak without Gauss Mask Range
Figure 3 3D synthesized Sinc peak
-10 -5 0 5 10 (a)3D Synthesized Sinc Peak with Gauss(t=l=1 )Mask Azimuth (c)3D Synthesized Sinc Peak with Gauss(t=l=4 )Mask Azimuth (e)3D Synthesized Sinc Peak with Gauss(t=l=13 )Mask Azimuth
(b)FFT Contour Synthesized Sinc Peak with Gauss(t=l=1 )Mask Range
(d)FFT Contour Synthesized Sinc Peak with Gauss(t=l=4 )Mask Range
(f)FFT Contour Synthesized Sinc Peak with Gauss(t=l=13 )Mask Range
Figure 4 Compare Sinc Mask effect by different σ Guass function correct because the simulation results are close to the Gaussian Function with window. But when σt,σl are over large, the
peak will be disappeared.
For extracting peak parameters, we should make sure the position (x, y).The first derivative of a local maximum curve is zero. The peak position can be defined as the point which is both of first derivative zero-crossing points transverse and longitudinal directions. Finding the interested point of two zero-gradient level line in x and y directions. So, fx, fy mean first-pixel, the estimation effect is better than other mask widths with 10dB noise. So we should choose the fit mask width for
(a)Estimation Peak Position for Centered(x=0.6 y=0.1)SSP By QE
Width of SSP with addnoise and multiplnoise
E
(b)std. of Estimation Peak Position for Centered(x=0.6 y=0.1)SSP By QE
Width of SSP with addnoise and multiplnoise
st
(a) Estimation Peak W idth for Centered(x=0.6,y=0.1)SSP By QE Width of SSP with addnoise and multiplnoise
E
(b)std. of Estimation Peak Width for Centered(x=0.6,y=0.1)SSP By QE Width of SSP with addnoise and multiplnoise
st
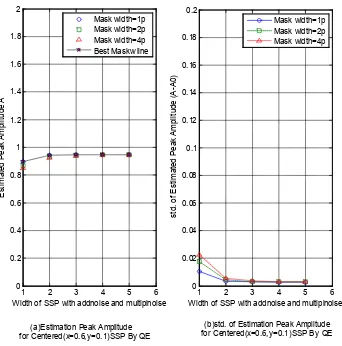
1 2 3 4 5 6 for Centered(x=0.6,y=0.1)SSP By QE Width of SSP with addnoise and multiplnoise
E
(b)std. of Estimation Peak Amplitude for Centered(x=0.6,y=0.1)SSP By QE Width of SSP with addnoise and multiplnoise
st
Figure 7. QE estimation of amplitude when Sinc peak is at
x=0.6, y=0.1 with 10dB noise
In SSP proposed, its size of sample is 41 41 .Assure A=1, width changes from 1 to 5 pixel. We start QE estimation of width and amplitude of peak in Fig. 6 and Fig. 7. The error of width estimation is 10-2. The error of amplitude estimation is 10 -2.This method is more effective than SGP[11].
3. SYNTHETIC SINC MODEL FLUCTUATION ANALYSIS
3.1 Position Fluctuation Analysis
Because noise causes the fluctuation of the estimation of peak and width estimates, we can use the variance of fluctuation to evaluate different estimation algorithm.
, ,h x y I x y I (26)
δ is the fluctuation of peak.
, ,
,
,In the same way, we can obtain the equation below:
, ,
, distribution where 21
N n
. The first order and second order variance can be calculated as
1 2Figure 8 Peak position f Fluctuation
When x1 and x2 is very close, fx1﹣fx2 is an approximate of the
second order derivative of f. In the Sinc peak, we can obtain the fluctuation of peak is
6 2 23.2 Fluctuation Analysis of width and amplitude
Using to the same principle, we can obtain the equation below:
are same as results of GAUSS model[11]. Thus, we have
width and amplitude.
3.3 Distribute of fluctuation experiment and result analyze
The peak simulation results based on fluctuation analysis are shown in Table 1. The simulation is under Gamma noise with SNR equal to 10dB.
Algorithms Var(δx) Var(δσ) Var(δH) Ave GAUSS by QE 0.0407 0.0062 0.0184 0.0218 GAUSS by WLS 0.0407 0.0046 0.0230 0.0228 SINC by QE 0.0028 0.0017 0.0051 0.0032
Table 1. Fluctuation analysis of three algorithms
In Table 1, we can conclude that Synthetic Sinc Model is more stable and exact. The fluctuation of noise has little influence on Synthetic Sinc Model. The mean of Var(δx), Var(δσ), Var(δH) by Synthetic Sinc Model is 0.0032 which is smaller than that by Gauss Model. It implies that Synthetic Sinc Model can improve the accuracy of reconstructing.
4. EXPERIMENT AND RESULT ANALYZE OF SAR IMAGE PEAK EXTRACT
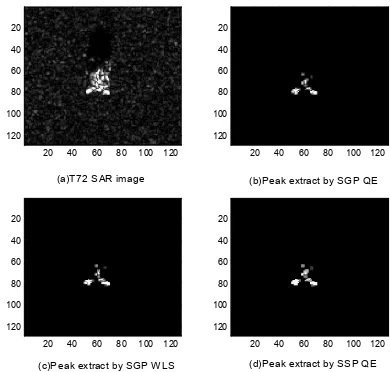
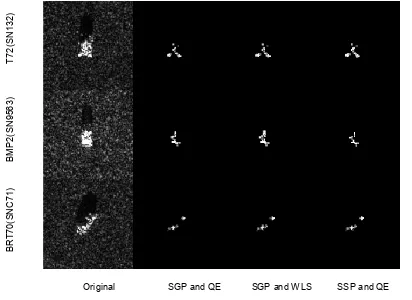
In SAR image, there are additive noises as well as multiplicative noise. If we extract peak from SAR directly, it will improve the extraction rate of SAR image. For MSTAR target image, SNR is usually larger than 10dB. The peak extraction results by Gauss Model based on QE algorithm, WLS algorithm and Synthetic Sinc Model based on QE algorithm are compared with the T72 original SAR image in Figure 9.
Figure 9 Recover Peak of 3D T72 by 3 Algorithms
(a)T72 SAR image
(b)Peak extract by SGP QE 20 40 60 80 100 120
(c)Peak extract by SGP W LS 20 40 60 80 100 120
(d)Peak extract by SSP QE 20 40 60 80 100 120
Figure 10 Recover Peak of 2D T72 by 3 Algorithms
In Figure 9, the peak which is extracted based on these three algorithms is close to the peak in the original SAR image. The peak width which is extracted by WLS algorithm by Gauss Model and QE algorithm by Synthetic Sinc Model is more close to the peak width in original SAR image. The extraction results of T72 based on three algorithms are shown in Figure 10. We observe that the extracted strong point based on Synthetic Sinc Model is the clearest in which the position is close to the position of strong point in original image. The speckle noise follows Gamma Distribution. Thus, we can obtain σn2=1/n. n is
Algorithms Var(δx) Var(δσ) Var(δH) Ave GAUSS by QE 1.0117 0.4217 0.0890 0.5075 GAUSS by WLS 1.0117 0.2146 0.1313 0.4525 SINC by QE 0.0771 0.0810 0.0302 0.0628
Table 2. Fluctuation analysis of three algorithms in SAR image peak
Original SGP and QE SGP and W LS SSP and QE
B
R
T
7
0
(S
N
C
7
1
)
B
M
P
2
(S
N
9
5
6
3
)
T
7
2
(S
N
1
3
2
)
Figure 11 Peak extract of three kinds targets in SAR image
5. CONCLUSION
In order to extract peak feature in SAR image accurately and quickly, this paper proposes to extract peak feature in SAR image based on Synthetic Sinc Model. This extraction method keeps the original peak feature and provides reliable feature vectors because the SAR image is required to have suppression flitting in this case. It is shown to can improve the speed of extraction and realize feature recognition. Further research on point echo imaging shows that Synthetic Sinc Model is suitable for SAR echo imaging because Gauss Model cannot reflect real speckle process. With Gaussian mask, we can perform the fluctuation analysis using derivative equations and least square method to conclude that Synthetic Sinc Model has the best performance on recovering peak in images with the least fluctuation variance.
ACKNOWLEDGEMENTS
Respectively, this paper is supported by by Natural Science Foundation of JiangSu Province, China(SBK2014043002).
REFERENCES
F. Weinmann, Ray tracing with PO/PTD for RCS modeling of large complex objects. IEEE Trans. Geosci. Remote Sensing, vol. 54, pp. 1797-1806, Jun. 2006.
A. Tzoulis and T. F. Eibert, A hybrid FEBI-MLFMM-UTD method for numerical solutions of electromagnetic problems including arbitrarily shaped and electrically large objects. IEEE
Trans. Antennas Propag., vol. 53, no. 10, pp. 3358-3366, Oct.
2005.
M. Domingo, F. Rivas, J. Pérez, R. P. Torres, and M. F. Cátedra, Computation of the RCS of complex bodies modeled using NURBS surfaces. IEEE Antennas Propag. Mag., vol. 37, no. 6, pp. 36-47, Dec. 1995.
J. M. Rius, M. Ferrando, and L. Jofre, GRECO: Graphical Electromagnetic Computing for RCS prediction in real time.
IEEE Antennas Propag. Mag., vol. 35, no. 2, pp. 7-17, Apr.
1993.
L. Potter, E. Ertin, J. Parker, and M. Çetin, Sparsity and compressed sensing in radar imaging. Proc. IEEE, vol. 98, no. 6, pp. 1006-1020, Jun. 2010.
D.F. Fuller and M.A. Saville,A High-Frequency Multipeak Model for Wide-Angle SAR Imagery. IEEE Trans. Geosci.
Remote Sens., vol. 51, no. 7, pp.4279-4291, July 2013.
17M.A. Koets, R.L.Moses, Feature extraction using attributed scattering center models on SAR imagery. AeroSense'99.
International Society for Optics and Photonics, 1999: 104-115.
J.Yang, D.Yan, C.Wang, et al. Feature extraction of attributed scattering centers on high resolution SAR imagery. Second International Conference on Spatial Information Technology.
International Society for Optics and Photonics, 2007:
67951R-67951R-5.
K.F.Ji, et al. Research on the Extracting Method of the Scattering Center Feature from SAR Imagery. Journal of
National University of Defense Technology
,vol.25.no.1,pp.45-50,Jan.2003.
C,Zhang,and L.S.Dan,An Automatic Target Recognition Method in SAR Imagery Using Peak Feature Matching. Journal
of image and graphics,vol7,no 7,pp.729-734,2007.
B. Wang, O. B. Thomas . Generic, model-based estimation and detection of peaks in image surfaces. Proceedings, Image