82 J. Math. Fund. Sci. Vol. 48, No. 1, 2016, 82-93
Received August 4th, 2015, 1stRevision December 5th, 2015, 2ndRevision March 4th, 2016, 3rdRevision March
13th, 2016, Accepted for publication March 14th, 2016.
Copyright © 2016 Published by ITB Journal Publisher, ISSN: 2337-5760, DOI: 10.5614/j.math.fund.sci.2016.48.1.8
Effect of V Dopant on Physicochemical Properties of
Vanadium-Doped Anatase Synthesized via Simple Reflux
Technique
Hari Sutrisno1, Ariswan2& Dyah Purwaningsih1
1Department of Chemistry Education, Faculty of Mathematics and Natural Sciences,
Yogyakarta State University, Kampus Karangmalang, Jl. Colombo 1, Yogyakarta, 55281, Indonesia
2Department of Physics Education, Faculty of Mathematics and Natural Sciences,
Yogyakarta State University, Kampus Karangmalang, Jl. Colombo 1, Yogyakarta, 55281, Indonesia
Email: [email protected]
Abstract. Mesoporous pure TiO2(M-TiO2) and mesoporous-vanadium-doped TiO2
(M-V-doped TiO2) were successfully synthesized via a facile and simple reflux
technique. The purpose of this research was to study the effect of vanadium dopant on the physicochemical properties of all materials obtained. Characterization of the prepared materials was carried out using X-ray diffraction (XRD), scanning electron microscopy-energy dispersive X-ray spectroscopy (SEM-EDS) and N2
-adsorption-desorption analysis. The presence of Ti and O elements in M-TiO2and of Ti, V and
O elements in M-V doped TiO2could be detected by SEM-EDS, while the patterns
of X-ray diffraction of all the prepared samples had a well-crystalline surface of anatase type. All mesoporous vanadium-doped TiO2 (M-V-doped TiO2) materials
performed in a highly transparent mode in the visible region at 554 nm (Eg= 2.24
eV) and 588 nm (Eg= 2.12 eV) for 3.3 and 4.9 wt% V doped TiO2, respectively. The
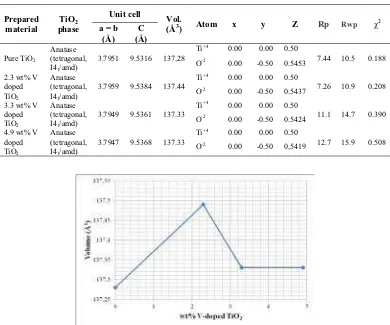
Rietveld refinement method was applied to extract the structural parameters of the M-TiO2and M-V-doped TiO2using the Fullprof program in the WinPlotr package.
The prepared materials were refined in the crystal system and space group of anatase (tetragonal, I41/amd (141)). The vanadium ion was successfully doped into TiO2. The isotherm type of M-TiO2and 2.3 wt% V doped TiO2were of type IV, with a
profile of type H2 hysteresis loops, while the 3.3 and 4.9 wt% vanadium-doped TiO2
reflected isotherm type III. The Brunauer-Emmett-Teller (BET) results showed a significant reduction in surface area due to increased concentrations of vanadium. The highest values of BET-specific surface area, pore volume and average pore size of M-TiO2were 46 m2/g, 18.45 nm and 0.2572 cm3/g respectively.
Keywords:anatase; hysteresis; mesoporous materials; reflux technique; Rietveld analysis.
1 0BIntroduction
Effect of V Dopant on Physicochemical Properties 83
number of potential applications of TiO2in both fundamental research and practical development work, have been developed, including in photocatalysis [1,2], photovoltaic cells [3,4], photoinduced super-hydrophilicity [5,6] and anti-bacterial applications [7,8].
The properties of TiO2 depend on the phase, surface area, dopant, degree of crystallization, particle size, pore size and morphology. For TiO2 photocatalysis and photoinduced super-hydrophilicity, efforts have been made in two aspects: the first is to narrow the wide band gap semiconductor of TiO2to extend the spectral response to the visible region or ultra violet radiation, among others by doping with nonmetallic dopants such as N [9], C [10] and S [11]. The other is to minimize the recombination rate of the photogenerated electron-hole pairs by doping with transition metals such as Ag [12,13], V [14] and Cr [15] into TiO2 to develop visible-photocatalysts. Among transition metal ions, vanadium ion is attractive as dopant because it will generate an intermediate band so that absorption will happen in the visible region. Various methods have been selected to prepare V doped doped TiO2 photocatalysts, such as a hydrothermal method [16], electro spinning technique [17], wet chemical method [14,18], sol-gel method [19,20], flame spray pyrolysis technique [21], and anodic oxidation [22].
In this study, pure and 2.3, 3.3, 4.9 wt% V doped mesoporous-TiO2were prepared by reflux technique at 150 °C for 6 hours. Mesoporous material can be synthesized by using templates, for example surfactant, lipid, polymer etc. and free-templates. This research synthesized pure and V-doped TiO2 mesoporous materials without using a template. In previous studies, mesoporous materials were produced with free templates at low temperatures, for example by hydrothermal and solvothermal methods 23,24!. At low temperatures, the polycondensation process takes place very slowly, especially propagation, which consists of olation and oxolation that allow to control the formation of pores, the crystal structure and morphology 25!. The morphology and the influence of V doped-TiO2 were investigated using scanning electron microscopy (SEM) and energy dispersive X-ray spectroscopy (EDS), respectively. The purpose of the research was to observe the role of the V dopants with respect to their physicochemical properties.
2 Experiment
2.1 Materials
84 Hari Sutrisno, et al.
TiCl4was added into a 500 ml glass flask loaded in an ice water bath and then 25 ml of H2O2was added slowly into the reaction vessel under magnetic stirring.
2.2 Preparation of M-TiO2and M-V doped TiO2
A series of vanadium doped TiO2at various weight percentages of V doped TiO2 was prepared by reflux technique. Mesoporous-TiO2(M-TiO2) and mesoporous-vanadium-doped TiO2 (M-V doped TiO2) were prepared. In a typical synthesis, 10 g Ti(O2)O.2H2O was dissolved in 50 ml of distilled water under vigorous stirring. The solution was stirred for 4 hours to obtain a colloidal A. To determine the effect of the NH4VO3 concentration, 0, 3, 6 and 9 wt% V doped TiO2 respectively were adopted in a separated beaker. The samples were thoroughly dissolved in 20 mL of distilled water under vigorous stirring to obtain solution B1, B2, B3, and B4 respectively. Each B1, B2, B3 and B4 colloid was then slowly added to each colloid A. The four types of final solution mixtures were sealed and further stirred for 2 h, after which NH4OH was added dropwise until the pH value reached about 8-10. Finally, the solution mixtures were heated with a magnetic stirrer in reflux equipment at 150°C for 6 hours. The obtained precipitate was filtered, washed with distilled water and dried at 70°C for 3 hours. Finally, the precipitate materials were calcined at 600°C for 2 hours.
2.3 Characterization
The morphologies were characterized using a Phenom ProX Desktop scanning electron microscope (SEM). The influence of the vanadium load on the structural characteristics of the vanadium-doped TiO2 and the presence of Ti, V and O elements in the prepared materials were analyzed using energy dispersive X-ray spectroscopy (EDS).
All samples were suspensed in ethanol solution. The colloidal samples were evaluated using a Shimadzu 2450 UV-vis diode array spectrophotometer.
The prepared materials were examined using powder X-ray diffraction (XRD). The XRD patterns were obtained on a Rigaku Miniflex 600-Benchtop XRD instrument, !"#$%"&' ()' %*"' +#$,,' - ).(,/#$%( )' /0(),' 1/' 23' #$&($%( )' 4 != 1.5406 Å). The
XRD instrument was run at 40 kV and 15 mA. The XRD data were collected in steps of 0.02"with a count time of 15 s/step. The intensities were determined in the 56' ()%"#7$8' #$),(),' .# 9' 5:° to 90°. To refine the crystal structures from the powder diffraction data, the Rietveld analysis was carried out using the Fullprof program by Roisnel and Rodriguez Carbajal in the WinPlotr package [27]. The following parameters were refined: unit cell, scale factor, and full width at half-maximum (FWHM).
Effect of V Dopant on Physicochemical Properties 85
data (55 points). The samples were degassed at 150 °C under vacuum for 4 h prior to analysis with a vacuum set point of 10 #mHg. The Brunauer-Emmett-Teller (BET) specific surface area (SBET) data were collected based on adsorption data (10 point) in the multi-point BET measurement from (P/P0) of ~ 0.06 to ~ 0.30 [28]. The pore volume and average pore size were evaluated from the adsorption-desorption isotherms by the procedure developed by Barrett, Joyner and Halenda (BJH) [29]. The BET and BJH calculations were done with the ASAP 2020 V4.01 software from Micromeritics.
3 Results and Discussions
3.1 SEM images and EDS analysis
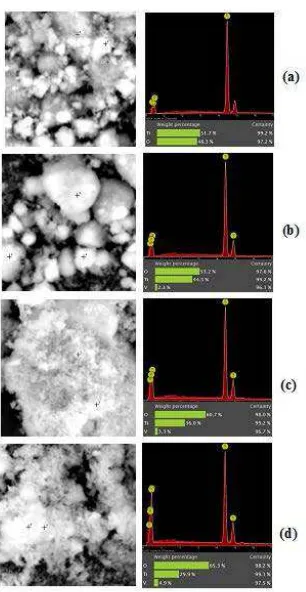
Typical SEM images and EDS analysis of M-TiO2 and M-V doped doped TiO2 nanocrystalline are shown in Figure 1. Figures 1(a)-1(d) show that the particles were highly agglomerated.
Figure 1 SEM images, EDS analysis and weight percentage (%) of Ti, O and V in M-TiO2(a), 2.3 wt% V doped TiO2(b), 3.3 wt% V doped TiO2(c), and 4.9 wt% V
86 Hari Sutrisno, et al.
The EDS analysis identified the presence of Ti and O elements in the M-TiO2and the presence of Ti, V and O elements in the M-V doped TiO2. As shown in Figure 1, the increasing concentration of NH4VO3also increased the quantity of V in the M-V doped TiO2. The crystal of V2O5 was found in the 4.9 wt% V doped TiO2, which was confirmed by the XRD pattern (Figure 2(d)). Table 1 shows that the addition of 3, 6 and 9 wt% V doped TiO2produced only 2.3, 3.3 and 4.9 wt% V doped TiO2respectively.
Table 1 Weight Percentage of Ti, O and V of M-TiO2and M-V Doped TiO2.
Samples Weight Percentage (wt%) Mole ratio = Ti:V
Ti V O
Pure TiO2 51.7 0 48.3 1.079 : 0.000
2.3 wt% V doped TiO2 44.5 2.3 53.2 0.958 : 0.040
3.3 wt% V doped TiO2 36.0 3.3 60.7 0.922 : 0.074
4.9 wt% V doped TiO2 29.9 4.9 65.3 0.868 : 0.126
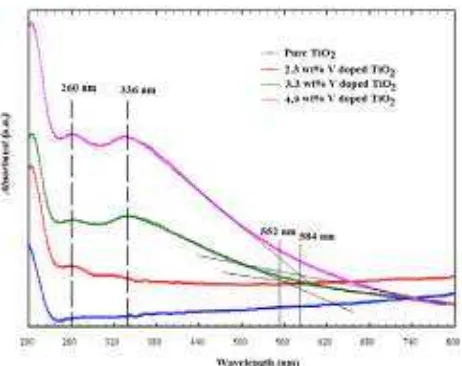
3.2 Optical Properties
In order to investigate the optical properties of the M-TiO2 and M-V doped TiO2 samples at 2.3, 3.3 and 4.9 wt% V doped TiO2, the absorbance was measured as a function of wavelength in the range of 200-800 nm. The UV-visible spectra for the M-V doped TiO2 samples at 2.3, 3.3 and 4.9 wt% V doped TiO2 are shown in Figure 2. For comparison purposes, the spectrum of undoped TiO2(M-TiO2) is also displayed. All mesoporous V-doped TiO2(M-V doped TiO2) powders performed in a highly transparent mode in the visible region at 554 nm (Eg = 2.24 eV) and 588 nm (Eg= 2.12 eV) for the 3.3 and 4.9 wt% V doped TiO2, respectively.
Figure 2 UV-Vis spectra of undoped TiO2and M-V doped TiO2at 2.3, 3.3 and 4.9
Effect of V Dopant on Physicochemical Properties 87
3.3 XRD Analysis
The wide-angle XRD patterns of the M-TiO2 and the M-V doped TiO2 are presented in Figure 3. The peak positions at 2$: 25.36, 37.04, 37.88, 38.61, 48.11, 53.96, 55.10, 62.11, 62.69, 68.75, 70.26, 75.01, 75.96, and 82.65° are in accordance with the TiO2 anatase phase. The main diffraction peaks can be indexed as the (101), (103), (004), (112), (200), (105), (211), (213), (204), (116), (220), (215), (301), and (224) reflections of anatase crystalline phase matching as shown in JCPDS card No. 21-1272. The reflections of TiO2(B) phase can be observed in the prepared M-TiO2. The presence of TiO2(B) phase is characterized by the presence of diffraction peaks at 2$= 30.7° [30].
Figure 3 Rietveld refinement patterns of M-TiO2(a), 2.3 wt% V doped TiO2(b),
3.3 wt% V doped TiO2(c), and 4.9 wt% V doped TiO2(d).
88 Hari Sutrisno, et al.
Effect of V Dopant on Physicochemical Properties 89
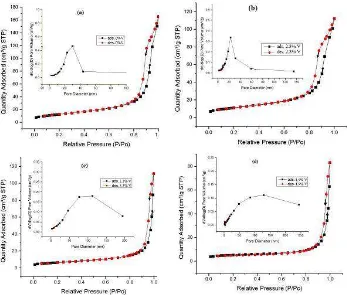
3.4 N2Adsorption/Desorption Measurement
The N2 adsorption-desorption isotherms of representative prepared samples are displayed in Figure 5. According to the IUPAC classification, for pure TiO2 (M-TiO2) and 2.3 wt% vanadium-doped TiO2 (Fig. 5a and 5b), the isotherms are of type IV, with a profile of type H2 hysteresis loops, while the 3.3 and 4.9 wt% vanadium doped TiO2 both reflect isotherm type III. The isotherm type IV represents a capillary condensation phenomenon. The isotherm type is characteristic of a material that contains mesoporosity and high energy adsorption. Based on the type H2 hysteresis loop profile, the prepared materials have pores with narrow, wide sections and possible interconnecting channels. The isotherm type III explains the multilayer formation. This is characteristic of a material, that is not porous, or possibly macroporous, and has low energy adsorption[32,33].
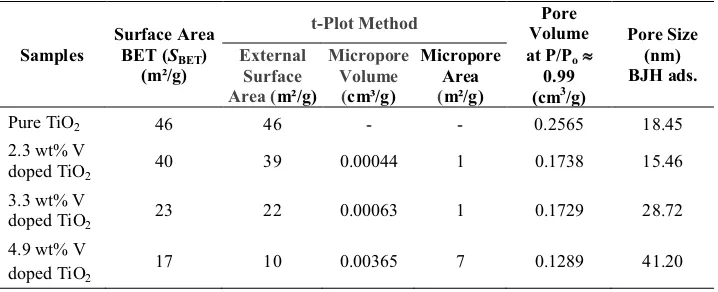
Table 3 Surface Area, Volume and Pore Size Distribution of M-TiO2 and M-V
Doped TiO2from Nitrogen Adsorption-desorption Isotherm Measurements
Samples
doped TiO2 40 39 0.00044 1 0.1738 15.46
3.3 wt% V
doped TiO2 23 22 0.00063 1 0.1729 28.72
4.9 wt% V doped TiO2
17 10 0.00365 7 0.1289 41.20
The surface area, volume and pore size distribution of the prepared samples are summarized in Table 3. From the table, it can be seen that the concentration of V in the M-V doped TiO2 increased while the BET surface area and mean pore size decreased with smallest surface area 17 m2/g, which corresponds to a mean porous size of 41.20 nm in the 4.9 wt% V doped TiO2. The BET surface area of the M-TiO2 exhibited a maximum surface area of 46 m2/g, corresponding to a mean porous size of 18.45 nm calculated by the BJHads.method.
90 Hari Sutrisno, et al.
41.20 nm, respectively. The pore sizes of the M-TiO2and the M-V doped TiO2are presented in Table 3.
Figure 5 Nitrogen adsorption-desorption isotherms of M-TiO2 (a), 2.3 wt% V
doped TiO2(b), 3.3 wt% V doped TiO2(c), and 4.9 wt% V doped TiO2(d) (Inset:
pore size distribution of the prepared samples from the adsorption isotherm measurements).
4 Conclusions
Effect of V Dopant on Physicochemical Properties 91
The smallest pore size of 18.45 nm was obtained for pure TiO2(M-TiO2), while the largest pore size of 41.20 nm was obtained for 4.9 wt% vanadium-doped TiO2 (M-V doped TiO2).
Acknowledgements
The research was funded by the Directorate General of Higher Education, Ministry of Education and Culture, Republic of Indonesia based on PUPT 2014 Grant, No. 230/UPT-BOPTN/UN34.21/2014
References
[1] Dai, Q., Zhang, Z., He, N., Li, P. & Yuan, C., Preparation and Characterization of Mesostructured Titanium Dioxide and Its Application as a Photocatalyst for the Wastewater Treatment, Materials Science and Engineering,C8-9, pp. 417-423, 1999.
[2] Awati, P.S., Awate, S.V., Shah, P.P. & Ramaswamy, V., Photocatalytic Decomposition of Methylene Blue Using Nanocrystalline Anatase Titania Prepared by Ultrasonic Technique, Catalysis Communications, 4(8), pp. 393-400, 2003.
[3] Dwivedi, C., Dutta, V., Chandiran, A.K., Nazeeruddin, M.K. & Grätzel, M., Anatase TiO2 Hollow Microspheres Fabricated by Continuous Spray
Pyrolysis as a Scattering Layer in Dye-Sensitised Solar Cells, Energy Procedia,33, pp. 223-227, 2013.
[4] Grätzel, M. Solar Energy Conversion by Dye-Sensitized Photovoltaic Cells. Inorganic Chemistry,44, pp. 6841-6851, 2005.
[5] Ashkarran, A.A. & Mohammadizadeh, M.R. Superhydrophilicity of TiO2
Thin Films Using TiCl4as a Precursor, Materials Research Bulletin, 43, pp. 522-530, 2008.
[6] Masuda, Y. & Kato, K., Liquid-Phase Patterning and Microstructure of Anatase TiO2 Films on SnO2:F Substrates Using Superhydrophilic Surface, Chemistry of Material,20, pp. 1057-1063, 2008.
[7] Maness, P.C., Smolinski, S., Blake, D.M., Huang, Z., Wolfrum, E.J. & Jacoby, W.A., Bactericidal Activity of Photocatalytic TiO2Reaction: Toward
and Understanding of Its Killing Mechanism, Applied and Environmental, Microbiology, 65(9), pp. 4094-4098, 1999.
[8] Huang, Z., Maness, P.C., Blake, D.M., Wolfrum, E.J., Smolinski, S. & Jacoby, W.A., Bactericidal Mode of Titanium Dioxide Photocatalysis, Journal of Photochemistry and Photobiology A: Chemistry, 130, pp. 163-170, 2000.
92 Hari Sutrisno, et al.
[10] Yang, J., Bai, H., Jiang, Q. & Lian, J., Visible-Light Photocatalysis in Nitrogen–Carbon-Doped TiO2Films Obtained by Heating TiO2Gel–Film in
an Ionized N2Gas, Thin Solid Films,516(8), pp. 1736-1742, 2008.
[11] Nishikiori, H., Hayashibe, M. & Fujii, T., Visible Light-Photocatalytic Activity of Sulfate-"#$%&! '()*+(,-! "(#.(&%! /0%$*0%&! 12! )3%! 4#567%5!
Method, Catalysts, 3, pp. 363-377, 2013.
[12] Wang, H., Niu, J., Long, X. & He, Y., Sonophotocatalitic Degradation of Methyl Orange by Nanosized Ag/TiO2 Particles in Aqueous Solutions, Ultrasonic Sonochemistry, 15, pp. 386-392, 2008.
[13] Al-Hartomy, O.A., Synthesis, Characterization, Photocatalytic and Photovoltaic Performance of Ag-Doped TiO2 Loaded on The Pt–Carbon
Spheres, Materials Science in Semiconductor Processing, 27, pp. 71-78, 2014.
[14] Liu, B., Wang, X., Cai, G., Wen, L., Song, Y. & Zhao, X., Low Temperature Fabrication of V-Doped TiO2 Nanoparticles, Structure and Photocatalytic
Studies, Journal of Hazardous Materials,169(1-3), pp.1112-1118, 2009. [15] Tian, B., Li, C. & Zhang, J., One-Step Preparation, Characterization and
Visible-Light Photocatalytic Activity of Cr-doped TiO2 with Anatase and
Rutile Bicrystalline Phases, Chemical Engineering Journal, 191, pp. 402-409, 2012.
[16] Thuy, N.M., Van, D.Q. & Hai, L.T.H., The Visible Light Activity of the TiO2
and TiO2:V4+ Photocatalyst, Nanomaterials and Nanotechnology, 2(14), pp. 1-8, 2012.
[17] Zhang, Z., Shao, C., Zhang, L., Li, X. & Liu, Y.,Electrospun Nanofibers of V-Doped TiO2with High Photocatalytic Activity, Journal of Colloid Interface Science,351, pp. 57-52, 2010.
[18] Songara, S., Patra, M.K., Manoth, M., Saini, L., Gupta, V., Gowd, G.S., Vadera, S.R. & Kumar, N., Synthesis and Studies on Photochromic Properties of Vanadium Doped TiO2 Nanoparticles, Journal of Photochemistry and Photobiology A: Chemistry,209(1), pp. 68-73, 2010. [19] Yang, X., Cao, C., Hohn, K., Erickson, L., Maghirang, R., Hamal, D. &
Klabunde, K. Highly Visible-Light Active C- and V-Doped TiO2 for
Degradation of Acetaldehyde, Journal of Catalysis, 252(2), pp. 296-302, 2007.
[20] Bettinelli, M., Dallacasa, V., Falcomer, D., Fornasiero, P., Gombac, V., Montini, T., Roman, L., & Speghini, A. Photocatalytic Activity of TiO2Doped with Boron and Vanadium, Journal of Hazardous Materials,
146, pp. 529-534, 2007.
[21] Tian, B., Li, C., Gu, F., Jiang, H., Hu, Y. & Zhang, J., Flame Sprayed V-doped TiO2 Nanoparticles with Enhanced Photocatalytic Activity under
Visible Light Irradiation, Chemical Engineering Journal, 151(1-3), pp. 220-227, 2009.
Effect of V Dopant on Physicochemical Properties 93
[23] Li, L., Chen, S., Xu, L., Bai, Y., Nie, Z., Liu, H. & Qi, L., 2014. Template-Free Synthesis of Uniform Mesoporous SnO2 Nanospheres for Efficient
Phosphopeptide Enrichment, Journal of Materials Chemistry B,2, pp. 1121-1124, 2014.
[24] Lu, B., Li, Z. & Kawamoto, K., Synthesis of Mesoporous Ceria without Template. Materials Research Bulletin,48(7), pp. 2504-2510, 2013.
[25] Jolivet, J.P., Henry, M. & Livage, J., De la Solution a L'oxyde: Condensation des Cations en Solution Aqueuse, Chimie de Surface des Oxydes. Inter édition et CNRS édition, 1994.
[26] Rich, R.L., Inorganic Reactions in Water, Springer, 2006.
[27] Roisnel, T. & Ridriguez-Carvajal, J., WinPLOTR a Graphic Tool for Powder Diffraction, CNRS-Lab. de Chimie du Solide et Inorganique Moléculaire Université de Rennes, 2001.
[28] Brunauer, S., Emmett, P.H. & Teller, E., Adsorption of Gases in Multimolecular Layers, Journal of the American Chemical Society, 60(2), pp. 309-319, 1938.
[29] Barrett, E.P., Joyner, L.G. & Halenda, P.P., The Determination of Pore Volume and Area Distributions in Porous Substances. I. Computations from Nitrogen Isotherms, Journal of the American Chemical Society, 3(1), pp. 373-380, 1951.
[30] Feist, T. P. & Davies, P.K. The Soft Chemical Synthesis of TiO2(B) from
Layered Titanates, Journal of Solid State Chemistry,101, pp. 275-295, 1992. [31] Fu, C., Huang, Z., Li, J. & Guo, D., Microstructure and Ferroelectric
Properties of (Bi0.9Ho0.1)3.999Ti2.997V0.003O12 Thin Films Prepared by Sol-gel
Method for Nonvolatile Memory, Journal Material Science Technology,
26(8), pp. 679-681, 2010.
[32] Lowell, S., Shields, J.E., Thomas, M.A. & Thommes, M., Characterization of Porous Solids and Powders: Surface Area. Pore Size and Density, Springer, 2006.