Quality Ranking of E-Government Websites
–
PROMETHEE II Approach
Handaru Jati
Electronics Engineering Education Department
Yogyakarta State University, Karangmalang, Yogyakarta, Indonesia, 55281 [email protected]
Abstract—This study conducts test to measure the quality of e-government website of five Asian countries via web diagnostic tools online. We propose a methodology for determining and evaluating the best e-government website based on many criteria of website quality. This model has been implemented by using combination of PROMETHEE II and Analytical Hierarchy Process (AHP) to generate the weights for the criteria which are better and more fairly preference. The result of this study confirmed that by applying combination of PROMETHEE II and AHP model approach has resulted in significant acceleration of implementation, raised the overall effectiveness and enabled more efficient procedure.
Keywords: Performance, e-government, quality, web diagnostic, PROMETHEE II and AHP model
I. INTRODUCTION
Website quality is a new topic in the software quality. Web based application can be used and reached more users than non web based application. The importance of website creates a demand from the users for the quality and fast delivery, unfortunately the complexities of the websites and technology which support this application make testing and quality control more difficult to handle. Automation of the testing for website quality is a new chance and a new method. Each definition of quality leads to lists of criteria about what constitutes a quality site. All of these criteria from multiple studies on Web quality to form a comprehensive tool for evaluating the quality of a Website that would serve to assess its trustworthiness explained in one research [1]. The principle was that 'if information can pass a test of quality, it is most likely to prove trustworthy' and because of this belief, should have higher credibility. The Website Quality Evaluation Tool (WQET) is an interdisciplinary assessment instrument and this is an important instrument that produced from the analysis and synthesis of multiple Web quality studies. The tool needs a lot of time and cautious consideration. It takes more than one hour to examine a Website thoroughly and apply criteria of the quality. This time dedication may be available to information professionals, but for the public user may not be willing to spend the same amount of time. Thus, the challenge is to create
a method that will guide the Internet user to the same finding as the WQET without needed a lot of time.
There are many scope of quality, and each measure will pertain to a particular website in varying degrees. Here are some of them: first factor is time, a credible site should be updated frequently. The information about latest update also should be included on the homepage. However, if the information has not been updated currently, the visitor could easily know that perhaps the site manager does really bother to update the site. Second factor is structural, all of the parts of the website hold together and all links inside and outside the website should work well. Broken links on the webpage also are another factor that always downgrades the quality of website. Each page usually has references or links or connections to other pages. These may be internal or external web site. Users expect each link to be valid, meaning that it leads successfully to the intended page or other resource. In the year of 2003, discovered that about one link out of every 200 disappeared each week from the Internet [2].
dominates the latency of most web pages [6]. Following the recommendation of the HTTP 1.1 specification, browsers typically default to two simultaneous threads per hostname. As the number of HTTP requests required by a web page increase from 3 to 23, the actual download time of objects as a percentage of total page download time drops from 50% to only 14%.
The last criterion is performance. Technology continues to make a important impact in service industries and fundamentally shapes how services are delivered [7]. One of the research finding mention that website which has slow download time less attractive compare than website with faster download time [8]. In the recent time the average time of the connection speed is 5Kbps (kilobytes per second). This facts give an implication that one web page with 40Kb page size will be downloaded during 8 seconds. This matter in accordance with the 'eight second rule', this 8 second is a normal time for loading webpage and will not be tolerable from the user. This result are supported by many research result mentioned that mean of tolerable download time in the user side is 8.57 with standard deviation 5.9 seconds [9]. Providing information related with waiting time is very important for user. For the long download time, it is better to provide information about how many percentage of the webpage already downloaded and how many hours needed to complete this task. Another important aspect is information fit-to-task, information presented on a website is accurate and appropriate for the task at hand [10]
Website page optimization continues to provide significant improvements for performance and can have a large impact on its quality. Despite the increasing broadband adoption, slow downloads continue to be a cause of slow web browsing which can be one of the most frustrating experiences. The optimizations are organized into three basic categories including image, website design, and HTML code optimization. This optimization can be improved by improving the quality of your website’s images, reducing the complexity of the HTML coding, and increasing the overall usability. As the web continues to mature as a competitive tool for business applications, there is a growing need to understand the relationship between web usability and business performance. Much of the prior research has viewed the website development from a set of usability factors [11, 12].
II. LITERATURE REVIEW
The web site evaluation can be approached from users, web site designer/administrator or both together [13]. Web-site Quality Evaluation Method (QEM) for six university Web-sites from different countries tested using this factor [14]. Web site architecture is classified into content and design [15], and each category is specified into evaluation criteria according to the characteristics and perception of a web site. Web site evaluation framework is developed to test 30 major airlines website all around the world [16]. This new framework called Airline Site Evaluation Framework (ASEF) consists of five
categories: Finding, Interface, Navigation, Content, Reliability, and Technical aspects. Web site usability, design, and performance is developed using metrics and conducted a user test with them [16]. A quantitative inspector-based methodology for Web site evaluation, with a hierarchical structure called EQT4Web and the assessment method is general-purpose is developed for cultural sites [17]. This new approach, hased on fuzzy operators, permits a sophisticated aggregation of measured atomic quality values, using linguistic criteria to express human experts' evaluations. Every webpage design has their own characteristics and this characteristic has drawbacks and benefits. There is a mechanism for measuring the effects of the webpage component toward the performance and quality of website. This mechanism will measure size, component, and time needed by the client for downloading a website. The main factor that will influences this download time are page size (bytes), number and types of component, number of server from the accessed web. Table 1 displayed a research conducted by IBM that can be used as a standard for performance measurement of quality [18].
TABLE 1. STANDARD OF THE WEBSITE PERFORMANCE [18]
Tested Factor Quality Standard
Average server response time < 0.5 second Number of component per page < 20 objects Webpage loading time < 30 second
Webpage size in byte < 64 Kbytes
III. METHODOLOGY
Basically our research purpose have twofold aim: 1) to propose the new methodology for evaluating the quality of website and 2) to determine the best website based on the criteria proposed in the new methodology. This research examined the websites of a selected number of countries in Asia: Singapore, Korea, Japan, Hongkong, and Malaysia and covered e-government for those countries. This data of quality website will be taken more than 30 trails on various occasions on the different period of time. Using website diagnostic tools and proposed method (Analytical Hierarchy Process and PROMETHEE Model the aim of this research will be explored. All of the data for this research was taken using PC with specification: Processor Pentium Mobile 740, using Local Area Network internet connection with average bandwidth 60 kbps.
A. Sample Data
B. PROMETHEE II
In this paper, the PROMETHEE II method is employed to obtain the full ranking of the alternative e-government websites. The procedural steps as involved in PROMETHEE II method are enlisted as below [19]:
Step 1: Normalize the decision matrix using the following calculation of differences in criteria values between different alternatives pair-wise.
Step 3: Calculate the preference function, Pj(i,ii).
There are mainly six types of generalized preference functions as proposed by Brans [20], but these preference functions require the definition of some preferential parameters, such as the preference and indifference thresholds. However, in real time applications, it may be difficult for the decision maker to specify which specific form of preference function is suitable for each criterion and also to determine the parameters involved. To avoid this problem, the following simplified preference function is adopted here:
(3)
Step 4: Calculate the aggregated preference function taking into account the criteria weights
Aggregated preference function
where wj is the relative importance (weight) of jth criterion. Step 5: Determine the leaving and entering outranking flows
Entering (or negative) flow for ith alternative
(7)
where n is the number of alternatives.
Here, each alternative faces (n – 1) number of other alternatives. The leaving flow expresses how much an
alternative dominates the other alternatives, while the entering flow denotes how much an alternative is dominated by the other alternatives. Based on these outranking flows, the PROMETHEE I method can provide a partial preorder of the alternatives, whereas, the PROMETHEE II method can give the complete preorder by using a net flow, though it loses much information of preference relations.
Step 6: Calculate the net outranking flow for each alternative.
(8) alternatives depending on the values of
(i).The higher valueof
(i), the better is the alternative. Thus, the best alternative is the one having the highest
(i) value. The PROMETHEE method is an interactive multi-criteria decision-making approach designed to handle quantitative as well as qualitative criteria with discrete alternatives. All qualitative criteria are expressed subjectively in linguistic terms. In this method, pair-wise comparison of the alternatives is performed to compute a preference function for each criterion. Based on this preference function, a preference index for alternative i over'
i
is determined. This preference index is the measure to support the hypothesis that alternative i is preferred toi
'. The PROMETHEE method has significant advantages over the other MCDM approaches, e.g. multi-attribute utility theory (MAUT) and AHP. The PROMETHEE method can classify the alternatives which are difficult to be compared because of a trade-off relation of evaluation standards as non-comparable alternatives. It is quite different from AHP in that there is no need to perform a pair-wise comparison again when comparative alternatives are added or deleted.C. Analytical Hierarchy Process
Analytic Hierarchy Process (AHP) was originally designed by Saaty [21] to solve complicated multi-criteria decision problem, beside that AHP is appropriate whenever a target is obviously declared and a set of relevant criteria and alternatives are offered [22]. AHP has been proposed for determining the best website to support researcher through the decision making activity, which aims to determine the best website among pool of e-government website. AHP is a popular model to aggregate multiple criteria for decision making [23]. In AHP the problems are usually presented in a hierarchical structure and the decision maker is guided throughout a subsequent series of pairwise comparisons to express the relative strength of the elements in the hierarchy. In general the hierarchy structure encompasses of three levels, where the top level represents the goal, and the lowest level has the website under consideration. The intermediate level contains the criteria under which each website is evaluated. The final score obtain for each website across each criterion is calculated by multiplying the weight of each criterion with the weight of each website. Website which has got the highest score is suggested as the best website and decision maker may consider that one as the best decision choice.
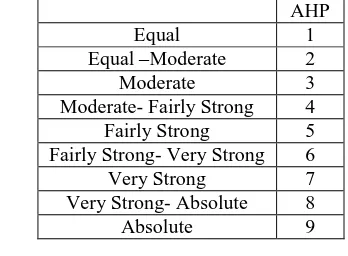
1. Employ a pair-wise comparison approach. Fundamental scale for pair-wise comparisons developed to solve this problem [21]. The pair-wise comparison matrix A, in which the element
a
ij of the matrix is the relativeimportance of the
i
th factor with respect to thej
thfactor, could be calculated
as
1 a
/ 1 a / 1
a 1
a / 1
a a
1
] a [ A
n 2 n 1
n 2 12
n 1 12
ij
(7)
2. There are n(n1)/judgments required for developing the set of matrices in step 1. Reciprocals are automatically assigned to each pair-wise comparison, where n is the matrix size.
TABLE 2. EACH OF MEMBERSHIP FUNCTIONS’ PARAMETER AHP
Equal 1
Equal –Moderate 2
Moderate 3
Moderate- Fairly Strong 4
Fairly Strong 5
Fairly Strong- Very Strong 6
Very Strong 7
Very Strong- Absolute 8
Absolute 9
IV. RESULT AND DISCUSSION
In order to provide format consistency, the following guidelines are to be followed. Results of the e-goverment websites test based on load time (A), response time (B), page rank (C), frequency of update (D), traffic (E), design optimization (F), size (G), number of items (H), accessibility error (I), markup validation (J), and broken link (K) are showed in table 3.
TABLE 3. TESTING RESULT FOR WEBSITES PERFORMANCE BASED ON CRITERIA
quality
Criteria .sg .kor .jp .hk .my
A 30.77 0.30 68.93 41.94 77.51
B 1.94 1.17 1.73 1.03 4.84
C 2870.00 430.00 2020.00 9690.00 2470.00
D 60.00 60.00 60.00 1.00 60.00
E 62000.00 39800.00 223200.00 499600.00 228200.00
F 37.50 57.00 36.50 33.00 22.00
G 128305.00 511.00 285645.00 195384.00 366825.00
H 26.00 1.00 60.00 15.00 22.00
I 37.00 0.00 2.00 0.00 15.00
J 79.00 5.00 21.00 3.00 80.00
K 4.00 0.00 1.00 1.00 9.00
Figure 1. AHP Model of Website Quality
The transformed objective data, as given in Table 3, are then normalized using Eqn. (1) or (2) and are given in Table 4. Determined the criteria weights for the considered criteria. In Formula (5), w(k) to every indictor and to every quality assurance may be
different. According to the AHP judgment, we can suppose: w(A)=0.270, w(B)=0.197, w(C)=0.148, (D)=0.107, w(E)=0.076, w(6)=0.052, w(7)=0.042, w(8)=0.042, w(9)=0.030, w(10)=0.021, and w(11)= 0.016.
A
Korea Japan Hongkong Malaysia Singapore
Selecting Best E-Government Website
TABLE 4. NORMALIZED DECISION MATRIX
A B C D E F G H I J K
X1(.sg) 0.61 0.76 0.26 1.00 0.05 0.44 0.65 0.58 0.00 0.01 0.56 X2(.kor) 1.00 0.96 0.00 1.00 0.00 1.00 1.00 1.00 1.00 0.97 1.00 X3(.jp) 0.11 0.81 0.17 1.00 0.40 0.41 0.22 0.00 0.95 0.77 0.89 X4(.hk) 0.46 1.00 1.00 0.00 1.00 0.31 0.47 0.76 1.00 1.00 0.89 X5(.my 0.00 0.00 0.22 1.00 0.41 0.00 0.00 0.64 0.59 0.00 0.00
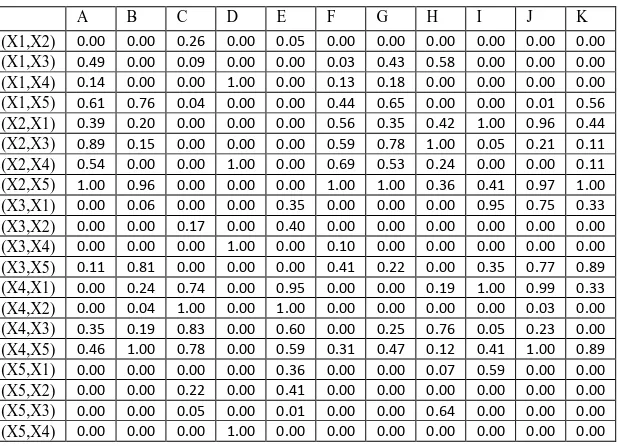
Now, the preference functions are calculated for all the pairs of alternatives, using Eqns. (3) and (4), and are given in Table 5.
TABLE 5. PREFERENCE FUNCTIONS FOR ALL THE PAAIRS OF ALTERNATIVES
A B C D E F G H I J K
(X1,X2) 0.00 0.00 0.26 0.00 0.05 0.00 0.00 0.00 0.00 0.00 0.00
(X1,X3) 0.49 0.00 0.09 0.00 0.00 0.03 0.43 0.58 0.00 0.00 0.00
(X1,X4) 0.14 0.00 0.00 1.00 0.00 0.13 0.18 0.00 0.00 0.00 0.00
(X1,X5) 0.61 0.76 0.04 0.00 0.00 0.44 0.65 0.00 0.00 0.01 0.56
(X2,X1) 0.39 0.20 0.00 0.00 0.00 0.56 0.35 0.42 1.00 0.96 0.44
(X2,X3) 0.89 0.15 0.00 0.00 0.00 0.59 0.78 1.00 0.05 0.21 0.11
(X2,X4) 0.54 0.00 0.00 1.00 0.00 0.69 0.53 0.24 0.00 0.00 0.11
(X2,X5) 1.00 0.96 0.00 0.00 0.00 1.00 1.00 0.36 0.41 0.97 1.00
(X3,X1) 0.00 0.06 0.00 0.00 0.35 0.00 0.00 0.00 0.95 0.75 0.33
(X3,X2) 0.00 0.00 0.17 0.00 0.40 0.00 0.00 0.00 0.00 0.00 0.00
(X3,X4) 0.00 0.00 0.00 1.00 0.00 0.10 0.00 0.00 0.00 0.00 0.00
(X3,X5) 0.11 0.81 0.00 0.00 0.00 0.41 0.22 0.00 0.35 0.77 0.89
(X4,X1) 0.00 0.24 0.74 0.00 0.95 0.00 0.00 0.19 1.00 0.99 0.33
(X4,X2) 0.00 0.04 1.00 0.00 1.00 0.00 0.00 0.00 0.00 0.03 0.00
(X4,X3) 0.35 0.19 0.83 0.00 0.60 0.00 0.25 0.76 0.05 0.23 0.00
(X4,X5) 0.46 1.00 0.78 0.00 0.59 0.31 0.47 0.12 0.41 1.00 0.89
(X5,X1) 0.00 0.00 0.00 0.00 0.36 0.00 0.00 0.07 0.59 0.00 0.00
(X5,X2) 0.00 0.00 0.22 0.00 0.41 0.00 0.00 0.00 0.00 0.00 0.00
(X5,X3) 0.00 0.00 0.05 0.00 0.01 0.00 0.00 0.64 0.00 0.00 0.00
(X5,X4) 0.00 0.00 0.00 1.00 0.00 0.00 0.00 0.00 0.00 0.00 0.00
Table 6 exhibits the aggregated preference function values for all the paired alternatives, as calculated using Eqns. (5).
TABLE 6. AGGREGATED PREFERENCE FUNCTION
X1 X2 X3 X4 X5
X1 0.042667 0.190758 0.160438 0.378925
X2 0.265172 0.381856 0.322358 0.617019
X3 0.087133 0.055727 0.1122 0.262213
X4 0.292678 0.232093 0.348065 0.570008
X5 0.048156 0.063745 0.03507 0.107
The leaving and the entering flows for different websites alternatives are now computed using Eqns. (6) and (7) respectively, and are shown in Table 7.
TABLE 7. LEAVING AND ENTERING FLOWS FOR DIFFERENT E-GOVERNMENT WEBSITES
e-government websites
Leaving flow Entering flow
X1 (Singapore) 0.193197 0.173285
X2 (Korea) 0.396601 0.098558
X3 (Japan) 0.129318 0.238937
X4 (Hongkong) 0.360711 0.175499
X5 (Malaysia) 0.063493 0.457041
TABLE 8. NET OUTRANKING FLOW VALUES FOR DIFFERENT E-GOVERNMENT WEBSITES (ALTERNATIVES)
e-government websites Net outranking flow Rank
Singapore 0.019912 3
Korea 0.298043 1
Japan -0.10962 4
Hongkong 0.185212 2
Malaysia -0.39355 5
The most important thing is regarding the final results, the website which has the highest score is suggested as the best website for the proposed PROMETHEE II and AHP model. In accordance with the results generated by the proposed model, Korea e-government website has the highest net outranking flow of 0.019912 in comparison with the rest of e-government websites. As a result, the proposed PROMETHEE II and AHP model rank for e-government website is: Korea (score: 0.298043), Hongkong (score: 0.185212), Singapore (score: 0.019912), Japan (score: -0.10962), and the last rank are Malaysia (score: -0.39355). This proves the applicability and potentiality of the PROMETHEE II method for solving complex decision-making problems in the webometric domain.
V. CONCLUSION
In this paper we evaluate the quality of Asian e-government websites. Using a series of online diagnostic tools, we examined many dimensions of quality, and each dimension was measured by a specific test online. The result of this study confirmed that the website presence of Asian e-government website is neglecting performance and quality criteria. It is clear in our research that more effort is required to meet these criteria in the context of website design. This suggests that web developers responsible for e-government website should follow and encourage the use of recognised guidelines when designing website. To get results on the quality of a website, we measured sample data from e-government website in 5 Asian countries and calculate load time, response time, page rank, frequency of update, traffic, design optimization, page size, number of item, accessibility error, markup validation, and broken link. We proposed methodology for determining and evaluating the best e-government sites based on many criteria of website quality based on PROMETHEE II and Analytical Hierarchy Process. This new combination model has been implemented to generate the weights for the criteria which are much better and guaranteed more fairly preference of criteria. Applying combination model between PROMETHEE II and AHP approach for website evaluation has resulted in significant acceleration of implementation, raised the overall effectiveness with respect to the underlying methodology and ultimately enabled more efficient and significant. Korea website has the highest in comparison with the rest of e-government websites. As a result, in overall ranking for the proposed model rank for e-government website is: Korea, Hongkong, Singapore, Japan, and Malaysia. Limitation of this research occurred in the number of sample size and time factor. This research used limited sample size of 30 data and taken during a short period of observation time. Future directions for this research are added criteria for evaluating websites quality, such as availability and security aspect, also from the cultural perspective, since culture has an impact upon a website. Another approach also can be conducted for other service sectors such as e-business and academic website. Moreover because the ultimate determinant
of quality website is the users, future directions for this research also involve the objective and subjective views of the e-government website from user’s perspective.
REFERENCES
[1] McInerney, C.: ‘Establishing and maintaining trust in online systems’, in
Editor (Ed.)^(Eds.): ‘Book Establishing and maintaining trust in online systems’ (2000, edn.), pp. 257-270
[2] McCowen, F., Michael, N., and Bollen, J.: ‘The Availability and Persistence of Web References in D-Lib Magazine’. Proc. the 5th International Web Archiving Workshop and Digital Preservation (IWAW'05), Viena 2005 pp. Pages
[3] Page, L., Motwani, R., Brin, S., and Winograd, T.: ‘The Anatomy of a Large-Scale Hypertextual Web Search Engine.’ 1998, 30, (1-7), pp. 107 - 117 [4] Josep, D., Ana, P., Julio, S., and Jose, G.: ‘A user-focused evaluation of
web prefetching algorithms’, Computer Communications, 2007, 30, (10), pp. 2213-2224
[5] Krishnamurthy, B., and Wills, C.: ‘Cat and Mouse: Content Delivery
Tradeoffs in Web Access’, in Editor (Ed.)^(Eds.): ‘Book Cat and Mouse: Content Delivery Tradeoffs in Web Access’ (2006, edn.), pp. 337 - 346 [6] Yuan, J., Chi, C., and Sun, Q.: ‘A More Precise Model for Web
Retrieval’, in Editor (Ed.)^(Eds.): ‘Book A More Precise Model for Web Retrieval’ (ACM, 2005, edn.), pp. 926 - 927
[7] Durkin, M.: ‘In search of the Internet-banking customer: exploring the
use of decision styles’, International Journal of Bank Marketing, 2007, 22, (7),
pp. 484-503
[8] Ramsay, J., Barbesi, A., and Preece, J.: ‘Psychological investigation of
long retrieval times on the World Wide Web’, Interacting with Computers, 1998, 10, (1), pp. 77-86
[9] Bouch, A., Kuchnisky, A., and Bhatti, N.: ‘Quality is in the eye of the
beholder: Meeting users' requirements for Internet quality of service’, in Editor (Ed.)^(Eds.): ‘Book Quality is in the eye of the beholder: Meeting
users' requirements for Internet quality of service’ (2000, edn.), pp. 297 - 304 [10] Loiacono, E.T., Watson, R.T., and Goodhue, D.L.: ‘WebQual: An
Instrument for Consumer Evaluation of Web Sites’, International Journal of Electronic Commerce, 2007, 11, (3), pp. 51-87
[11] Green, D., and Pearson, J.M.: ‘Development of a Web Site Usability Instrument Based on ISO-9241-11’, The Journal of Computer Information Systems, 2006, 47, (1), pp. 66-72
[12] Seffah, A., Donyaee, M., Kline, R., and Padda, H.: ‘Usability
Measurement and Metrics: A Consolidated Model,’ Software Quality Journal,
2006, 14, (2), pp. 159-178
[13] Olsina, L., Lafuente, G., and Rossi, G.: ‘Specifying quality characteristics and attributes for websites’, Web Engineering, 2001, pp. 266 -278
[14] Huizingh, E.: ‘The Content and Design of Web Sites: An Empirical
Study’, Information & Management, 2000, 37, (3 ), pp. 123 - 134
[15] Apostolou, G., and Economides, A.A.: ‘Airlines websites evaluation
around the world’, The Open Knowlege Society. A Computer Science and
Information Systems Manifesto, 2008, pp. 611-617
[16] Palmer, J.W.: ‘Web site usability, design, and performance metrics’, Information systems research, 2003, 13, (2), pp. 151-167
[17] Islam, R., Ahmed, M., and Alias, M.H.: ‘Application of Quality
Function Deployment in redesigning website: a case study on TV3’,
International Journal of Business Information Systems, 2007, 2, (2), pp. 195-216
[18] Amerson, M., Fisher, G., Hsiung, L., Krueger, L., and Mills, N.: ‘Design for Performance: Analysis of Download Times for Page Elements Suggests
Ways to Optimize’,
http://www.ibm.com/developerworks/websphere/library/techarticles/hipods/pe rform.html#main, 2001, 2008, (9/11/2008)
[19] Brans, J.P., Vincke, P., and Mareschal, B.: ‘How to select and how to
rank projects: The PROMETHEE method’, European Journal of Operational
Research, 1986, 24, (2), pp. 228-238
[20] Brans, J.P., Mareschal, B., and Vincke, P.: ‘ PROMETHEE: A new
family of outranking methods in multicriteria analysis’, Operational Research,
[21] Saaty, T.: ‘The analytic hierarchy process: planning, priority setting,
resources allocation’ (McGraw-Hill, 1980. 1980)
[22] Ozden, B., and Karpak, B.: ‘An AHP application in vendor selection’, in
Editor (Ed.)^(Eds.): ‘Book An AHP application in vendor selection’ (ISAHP,
2005, edn.), pp.
[23] Yuen, K., and Lau, H.: ‘Software vendor selection using fuzzy analytic
hierarchy process with ISO/IEC9126’, IAENG International journal of
![TABLE 1. STANDARD OF THE WEBSITE PERFORMANCE [18] Tested Factor Quality Standard](https://thumb-ap.123doks.com/thumbv2/123dok/1229665.689063/2.595.317.549.299.408/table-standard-website-performance-tested-factor-quality-standard.webp)