REPUBLIC OF INDONESIA
Recent Economic Developments
Published by Investors Relations Unit –Republic of Indonesia
Address Bank Indonesia
International Directorate Investor Relations Unit
Sjafruddin Prawiranegara Building, 5thfloor Jalan M.H. Thamrin 2
Jakarta, 10110 Indonesia
Tel +6221 381 8316
+6221 381 8319 +6221 381 8298 Facsimile +6221 350 1950
E-mail Elsya Chani: [email protected]
Firman Darwis: [email protected]
Dyah Miranti Wulandari: [email protected]
Table of Contents
I. Executive Summary
II. Indonesia Story: as Acknowledged by Rating Agencies
Executive Summary
The economy grew
by 6.2% in Q2-2010. The whole year it forecasted to grow within the range of 5.5%-6.0% by the end of 2010, and estimated to reach the upper limit projection, bolstered by Indonesia's external sector performance, investment, and consumer spending. The latest macro economic indicators supported us to believe that the economy, in line with the development in the global economy, is steadily moving on an upward trend accompanied by financial system stability. It bolstered Indonesia's external sector performance and investment, with domestic recovery gaining strength as the economy is no longer reliant solely on consumption. The optimism also supported by latest development in the
perception
indicators such as an upgrade to investment grade, yield spread, CDS, CRC-OECD, etc. An assessment of economic developments during July 2010 points to improvement in the domestic economy amid persistent risks of global uncertainties. On July 13th2010, Japan Credit Rating Agency (JCR) upgraded Indonesia's
sovereign rating
to Investment Grade, from BB+ to BBB-. This upgrade was the first investment grade for Indonesia in 13 years. Currently, the Republic of Indonesia’s sovereignrating BB+ /Stable from Fitch, BB+/Stable from R&I, BB/Positive from S&P, and Ba2/positive from Moody’s.
The latest Board Meeting convened in August 2010 resolved to hold the
BI Rate
at 6.5%. For the time being, the current rate considers adequate to safeguard future inflation expectations. However, BI is taking careful note of the recent onset of higher inflationary pressure and will pursue the necessary monetary and banking policy actions to ensure that future inflation remains on track with the established target at 5%+1% for 2010 and 2011. BI will soon respond with measures to tighten liquidity management without disruption to the bank intermediation function, implemented through changes in the statutory reserve requirement. Regarding prices, the Board of Governors is closely monitoring the onset of
rising inflationary pressure
.July 2010 recorded fairly brisk CPI inflation at 1.57% (mtm) or 6.22% (yoy). Inflationary pressure was driven mainly by higher inflation in the foodstuffs category and particularly rice, due to seasonal uncertainties. In contrast, pressure from core inflation has been kept at modest levels as a result of adequate supply-side response to increases in demand and the appreciating trend in the exchange rate.Executive Summary
Overall, banking industry remains in a stable condition and convinced to be run prudently, which is reflected in the well-maintained Capital Adequacy Ratio of 17.4%, and safe level of Non-Performing Loans at 3.0%, as of end of June 2010. By end of 2010, lending growth is projected to reach 22%-24%. Up to July 2010, banking industry has reached the remarkable lending growth at 19.6%. Improved market confidence also bring more optimism to further
banking intermediation function.
Going forward, BI will keep a close watch on bank lending growth to keep it within the range envisaged in the Bank Business Plans. Special efforts will be devoted to increase credit for productive purposes. The purpose of these measures is to ensure that demand-side increase will be adequately offset on the supply-side and thus not generate excessive inflationary pressure.
Balance of payments
charted another surplus at a robust US$6.6 billion in Q1-2010, marking significant improvement over the Q4-2009 surplus (US$4.0 billion). Going forward in Q2/2010, improvement in the global economy bolstered Indonesia's external sector performance and investment which reflected on the current account surplus, estimated at USD1.75 billion in Q2/2010 or ahead of the originally forecasted USD1.23 billion. Similarly, the capital and financial account is estimated to post a higher surplus at USD3.09 billion as compared to the earlier USD1.16 billion forecast. The robust current account surplus and capital and financial account surplus are consistent with the improvement in the global economy along with rising commodity prices and renewed growth in capital inflows in response to the upward revision of the credit rating outlook and more upbeat international perceptions.
International reserves
position at 30 July 2010 reached USD78.8 billion, equivalent to 6.03 months of imports and servicing of official external debt. This helped the rupiah to maintain stable movement throughout July 2010 with an appreciating trend.Indonesia Story: as Acknowledged by Rating Agencies
Impressively navigates through the global crisis and as growing confidence in economic outlook, the Republic continued to receive good reviews, especially from Rating agencies
Japan Credit Rating Agency, Ltd (July 13, 2010): upgraded Indonesia's sovereign rating to Investment Grade from BB+ to BBB- with stable outlook.The first upgrade to reach investment grade in the last 13 years reflects enhanced political and social stability, sustainable economic growth , alleviated public debt burden as a result of prudent fiscal management, reinforced resilience to external shocks stemming from the foreign reserves accumulation and an improved capacity for external debt management and efforts made by the current administration to outline the framework to deal with structural issues such as infrastructure development.
Moody’s Investors Service (June 21, 2010): revised the outlook of Indonesia’s foreign and local-currency Ba2 sovereign debt ratings to positive from stable. The positive outlook broadly reflects the country's capacity for sustained strong growth, the overall stability and effectiveness of its fiscal and monetary policies, and expectations of further improvements in the government's financial and debt position.
OECD (April 2, 2010): upgraded Indonesia’s Credit Risk Classification (CRC) from category 5 to 4. This upgrade was a timely acknowledgement by the developed economies of the consistent economic improvement. This upgrade would significantly improveIndonesia’scredit standing in front of the creditor countries especially the credit exports creditor countries which eventually would decrease the debt burden.
S & P (March 12, 2010): upgraded Indonesia’slong-term foreign currency rating to BB from BB- with positive outlook
which indicates that Indonesia has big possibility to be upgraded within a year, even maybe faster. The main factor supporting this decision is steadily improving debt metrics and growing foreign currency reserves which reduced vulnerability to shock with continued cautious fiscal management.
Fitch Ratings (January 25, 2010): upgraded the Republic of Indonesia’s sovereign rating to ‘BB+’ from ‘BB’ with stable outlook The rating action reflects Indonesia’srelative resilience to the severe global financial stress test of 2008-2009 which has been underpinned by continued improvements in thecountry’s public finances.
Indonesia Development Policy is based on a
‘Triple
Track
Strategy’
1st
Pro-Growth:
Increase Growth by prioritizing export and investment
2nd
Pro-Job :
Boost up the real sector in order to create jobs
3rd
Pro-Poor:
Revitalize agriculture, forestry, maritime, and rural economy
to reduce poverty
Real Sector: Indonesia Development Policy
Source: Coordinating Ministry for Economic Affairs
Economic Growth Sustained
(*): Preliminary
Source: Ministry of Finance, BPS.
Economic data up to end of Q1-2010 supported us to believe that the economy, in line with the development in the global economy, is moving toward better development than we previously expected on the beginning of this year. The optimism also supported by latest development in the perception indicators such as yield spread, sovereign rating, CDS, CRC-OECD, etc. On the backdrops, in the end of Q1-10, BI revised economic growth outlook for 2010 and 2011 to be consecutively within the range of 5.5-6.0% and 6.0-6.5%.
In the 2nd quarter of 2010, the Indonesian economy grew 6.2% (yoy), higher than forecasted at 6.0% and higher than previous quarter (5.7%). The growth driven mainly from investment and consumer spending. The economy is projected to grow within the range of 5.5-6.0% for 2010, and is forecasted to reach the upper limit projection, bolstered by Indonesia's rising export performance, investment, and continued strength of consumption.
Indonesia’s economic growth is steadily moving on an upward trend.
9 Source: Bank Indonesia.
Sustainable Economic Growth
0.0 1.0 2.0 3.0 4.0 5.0 6.0 7.0
2006 2007 2008 2009 Q1-2010 Q2-2010
5.5
6.3 6.0
4.5
5.7
Stable rupiah is expected to damp pressure from higher commodity prices and pave the way for better inflation expectation. From domestic side, in addition to administered price, subtle inflationary pressure would also be the result from higher demand along with higher economic growth as production capacity remain adequate to respond to higher demand. Those conditions is projected to be reflected in inflation rate at 5+1% in 2010.
BI is closely monitoring the onset ofrising inflationary pressure.July 2010 recorded fairly brisk CPI inflation at 1.57% (mtm) or 6.22% (yoy). Inflationary pressure was driven mainly by higher inflation in the foodstuffs category and particularly rice, due to seasonal uncertainties. In contrast, pressure from core inflation has been kept at modest levels as a result of adequate supply-side response to increases in demand and the appreciating trend in the exchange rate. Accordingly, the most important factors in mounting inflation are seasonal, requiring action to safeguard against increased expectations of future inflation.
Future inflationary pressure until end of 2010 is predicted mainly from higher electricity tariff, upcoming Ramadhan festivities and higher food prices associated with seasonal uncertainties.
Going forward in 2011, inflationary pressures could be spurred by an increasingly limited supply-side response to the expected sustained growth in demand. BI will keep a close watch on the rising inflationary pressure and make the necessary adjustments to monetary policy responses to ensure that inflation remains on track with the established targeting range at 5%+1% in 2010 and 2011.
Inflation
10 Source: Bank Indonesia
Inflation Inflation Expectation –Consensus Forecast
1.57 5.27 6.71 9.17 6.22 -5 0 5 10 15 20 Ja n F e b M a r A p r M a y Ju n Ju l A u g S e p O ct N o v D e c Ja n F e b M a r A p r M a y Ju n Ju l A u g S e p O ct N o v D e c Ja n F e b M a r A p r M a y Ju n Ju l A u g S e p O ct N o v D e c Ja n F e b M a r A p r M a y Ju n e Ju ly A u g S e p O kt N o v D e s Ja n F e b M a r A p r M a y Ju n Ju l
2006 2007 2008 2009 2010
Monthly (m-t-m)
Monetary Policy Stance
BI Rate
11
Since December 2008, BI has slashed BI Rate by 300 bps. The monetary relaxation has offered ample support for the economic recovery process and bank intermediation.
In the latest Board Meeting convened in August 2010, BI Rate is kept at 6.50%. For the time being, BI considers the 6.5% BI
Rate adequate to safeguard future inflation expectations while closely monitoring the recent rise in inflation. However, we are taking careful note of the recent onset of higher inflationary pressure and will pursue the necessary monetary and banking policy actions to ensure that future inflation remains on track with the established target at 5%+1% for 2010 and 2011.
Source: Bank Indonesia.
6.5
9.90
6.27 8.25
4 5 6 7 8 9 10 11
Jan-08 Mar-08 May-08 Jul-08 Sep-08 Nov-08 Jan-09 Mar-09 May-09 Jul-09 Sep-09 Nov-09 Jan-10 Mar-10 May-10 Jul-10
Balance of Payments: Preliminary Estimates for Q2-2010
Balance of Payments
Improvement in external sector performance is reflected on the current account surplus, estimated at USD1.74 billion in Q2/2010 or ahead of the originally forecasted USD1.23 billion. Similarly, the capital and financial account posted a higher estimated surplus at USD3.09 billion compared to the earlier USD1.16 billion forecast. The surplus are consistent with the improvement in the global economy along with rising world commodity prices and renewed growth in capital inflows in response to the upward revision of the credit rating outlook and more upbeat international perceptions of Indonesia. With positive prospects on those two accounts, overall balance of
paymentsin Q2-2010 is estimated to post a surplus of around US$4.3 billion.
Accordingly, international reserves at end-June 2010 mounted to US$78.8 billion, equivalent to 6.03 months of imports and official external debt service payments.
Official BOP statistics for Q2-2010 will be released in mid-August 2010.
Sound Banking Sector
Protected by prudential guidelines and conservative practices, the Banking Sector has weathered the global financial turmoil and posted good performance : strong solvency, contained risk exposure and profitability
financial system stability up to July 2010 is well maintained, confirmed by Financial Stability Index (FSI) which was recorded at 1.84 (slightly lower than June 2010 at 1.87). The decrease indicates lower pressure to the financial system which mainly came from lower credit risk and lower volatility in the financial market.
Banking industry remains in a stable condition and convinced to be run prudently, which is reflected in the well-maintained Capital Adequacy Ratio (17.4%, as of end of June 2010) and safe level of Non-Performing Loans at 3.0%, as of end of June 2010.
Intermediary function is steadily improving reflected from 19.6% (yoy) lending growth recorded in end of June 2010.Sufficient CAR (%) Sound level of NPLs (%)
13 Source: Bank Indonesia.
20.5
19.3
16.2
17.4
19.3 19.1 19.2
17.8 17.4
-5.0 10.0 15.0 20.0 25.0
Dec-06 Dec-07 Dec-08 Dec-09 Feb-10 Mar-10 Apr-10 May-10 Jun-10
4.6 4.6
3.8 3.8 4.0 3.8
3.5 3.6
3.3 3.6
1.9
1.5
0.9 1.0 1 0.9 1 0.8
-0.5 1.0 1.5 2.0 2.5 3.0 3.5 4.0 4.5 5.0
Dec-06 Dec-07 Dec-08 Dec-09 Feb-10 Mar-10 Apr-10 May-10 Jun-10 gross NPL
14
In 2010, the Indonesian economy is positioned to grow higher
GDP Growth
is forecasted to be at the upper limit of
5.5%-6.0% projection
With more upbeat confidence to the economy, exports and investment are expected to keep climbing, providing additional boost to mounting consumption in support of higher levels of economic growth.
2010 Forecast Main Factors Behind The Forecast
14 Source: Bank Indonesia.
Inflation
is estimated to be on target at range of
5.0% 1%
Signs of future inflationary pressures until end of 2010 are noted, which mainly predicted from administered prices and volatile food seasonal uncertainties. However, BI is positive to contain the inflation level within the target range, and will keep a close watch on the rising inflationary pressure and make the necessary adjustments to monetary policy responses to ensure that inflation remains on track with the established targeting range at 5% 1% in 2010 and 2011.
Export
is expected to chart higher growth
Global economic recovery will produce renewed acceleration in exports. The global economy is predicted to enter an expansionary phase in 2010. Renewed momentum is predicted in the economies of Indonesia’s major trading partners, such as China. This strengthened performance will position exports as one of the main engines of economic growth in 2010.
Indonesian exports characteristics which is based on primary commodities has also supported export growth acceleration.
Private
Consumption
will remain strong
Household consumption is forecasted to remain strong. The strengthening global economic outlook for 2010 will given added momentum to Indonesia’s exports, which in turn will produce an overall increase in private incomes.
Banking system stability held firm amid the onset of renewed credit expansion (data as of May 2010)
Main Banking Indicators
15 Source: Bank Indonesia
Overview of Fiscal Policy for 2009 and 2010
Continue an effective fiscal stimulus 2009 (1.4% GDP), 2010 (1.6% GDP)
Reduce debt to GDP ratio: 2009 (28%), 2010 (27%).
Actual fiscal deficit 1.6% of GDP, lower than 2.4% of GDP target deficit projected in 2009 Revised Budget
Target fiscal deficit 1.6% of GDP in 2010 Budget (budget adjustments is in ongoing discussion with the parliament) .Fiscal Stimulus Policies
Tax and
Administrative Reforms
New Feature of Fiscal Policy
Maintain
Social Welfare
Continue welfare programs (PNPM, BOS, Jamkesmas, Raskin) and provide budget for educationsector
Continue tax policy and administration reform, reduce rate for companies, certainty of tax policy for oil companies
Implement the 1st batch of Performance Based Budget (PBB), Civil Service Reform and Remuneration (11 ministries) and multi-years projects
Provide fiscal space for the new government to implement additional priority programs (0.4% of GDP or equal to USD 2.5 billion)
Sufficient fiscal risk for oil and commodity prices, El-Nino, provide guarantee on land acquisition for infrastructure projects, secure financing for power (PLN) and restructuring water services (PDAM), domestic oil price adjustment if necessary
Export promotion (additional capital for Indonesian Exim Bank) and incentives for real sector, climate change projects (geothermal, bio-premium, green funds)Fiscal Policy to Promote Economic Recovery
Provide incentive for geothermal energy through income tax and VAT
Provide tax incentive on imports (both income tax and VAT on imports) for the oil and gas exploration sector
Provide incentive for green energy through for VAT and subsidyEnergy Incentives
Provide custom incentives for select industries
Provide custom incentives for imported capital goods and capexIncentives for Industry
Reduce income tax rate for corporations from 28% to 25%
Reduce income tax rate by 5% for listed companies with 40% public ownership
Provide income tax facilities for businesses in specific industries or areas
Free VAT for primary agriculture products
Eliminate many luxury tax items
Provide tax and custom Incentive for special areas in accordance with law on tax and custom
Eliminate non tax revenue for export and import documentationIncentives on General
Taxation
The fiscal policy aims to promote economic recovery by providing tax incentives to various sectors and businesses which further promotes private consumption and investment spending
Fiscal Policy to Enhance Competitiveness
Guarantee for 10,000 MW electricity program and IPP
Additional funds for land clearing for toll road building
Guarantee obligation for State Water Company and subsidy on interest for clean water, and interest credit for State Water Company, business in Aceh / Nias, and KKPE
Subsidy and VAT for people’s housing (low income housing)
The Indonesian government continues to support the development of infrastructure and enhance the social welfare through the effective fiscal policy and incentives for specific sectors
Infrastructure Development and Social Welfare
Assistance to Support
Specific Sectors
Credit for green fuel development
Credit for farming and cow growers
Subsidy for fertilizers, seeds and inventory
Direct assistance for seeds at competitive pricing in order to revitalize plantation, cocoa and sugar industry
Additional capital for LPEI (Indonesian Exim Bank) to finance export related activities, including for SMEs
Provide incentives for high performance regions (e.g. performance on financial, economics and social welfare)
Resolution for troubled asset at SOEs and SMEs loan
Financing Trend 2005-2010
19 Source: Ministry of Finance
20
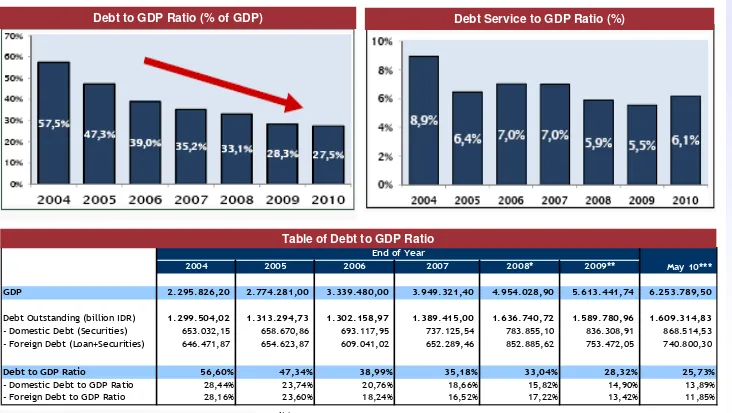
Debt to GDP Ratio (% of GDP) Debt Service to GDP Ratio (%)
Debt Ratio
Source: Ministry of Finance
2004 2005 2006 2007 2008* 2009** May 10***
GDP 2.295.826,20 2.774.281,00 3.339.480,00 3.949.321,40 4.954.028,90 5.613.441,74 6.253.789,50
Debt Outstanding (billion IDR) 1.299.504,02 1.313.294,73 1.302.158,97 1.389.415,00 1.636.740,72 1.589.780,96 1.609.314,83 - Domestic Debt (Securities) 653.032,15 658.670,86 693.117,95 737.125,54 783.855,10 836.308,91 868.514,53 - Foreign Debt (Loan+Securities) 646.471,87 654.623,87 609.041,02 652.289,46 852.885,62 753.472,05 740.800,30
Debt to GDP Ratio 56,60% 47,34% 38,99% 35,18% 33,04% 28,32% 25,73%
- Domestic Debt to GDP Ratio 28,44% 23,74% 20,76% 18,66% 15,82% 14,90% 13,89% - Foreign Debt to GDP Ratio 28,16% 23,60% 18,24% 16,52% 17,22% 13,42% 11,85%
End of Year
Notes: * = Preliminary ** = Very Preliminary
*** = Very Very Preliminary, GDP number based on Budget 2010 Assumption [Outstanding as of May, 2010]