THESIS
BIOGAS PRODUCTION
USING ANAEROBIC BIODIGESTER
FROM CASSAVA STARCH EFFLUENT
WITH RUMINANT BACTERIA AS BIOCATALYST
Presented to Fulfill One of the Requirements for Final Assignment to Obtain the Bachelor of Engineering
by:
Audra Ayu O. L2C006023
Vincensia Dyan Aryati L2C006106
CHEMICAL ENGINEERING DEPARTMENT
TECHNICAL FACULTY DIPONEGORO UNIVERSITY
PAGE OF APPROVAL
THESIS
Name/NIM : Audra Ayu O./L2C006023
Name/NIM : Vincensia Dyan Aryati/L2C006106
Tittle of Research : Biogas Production using Anaerobic Biodigester from Cassava Starch Effluent with Ruminant Bacteria as Biocatalyst.
Advisor : Dr. nat.techn. Siswo Sumardiono, ST, MT
Semarang, January 19th 2010 Has approved,
Advisor,
Dr. nat.techn. Siswo Sumardiono, ST, MT
SUMMARY
IKMs’ factory activity in Margoyoso produces liquid and solid wastes. The possible alternative wa s to use the liquid effluent as biogas ra w material. This study focuses on the used of urea, ruminant, yeast, microalgae, the treatment of gelled and ungelled feed for biogas production, pH control during biogas production using buffer Na2CO3, and feeding management in the semi-continuous
process of biogas production that perform at ambient temperature for 30 days. Ruminant bacteria, yeast, urea, and microalga e wa s added 10 % (v/v), 0.08% (w/v), 0.04 % (w/v), 50 % (v/v) of mixing solution volume, respectively. The pH of slurry was adjusted with range 6.8-7.2 and was measured daily and corrected when necessary with Na2CO3. The total biogas production wa s measured daily by
the water displacement technique.
Biogas production from the ungelling and gelling mixture of cassava starch effluent, yeast, ruminant bacteria, and urea were 22,701 ml and 6,198 ml. Biogas production from ungelling mixture without yeast was 1,830 ml. Biogas production from ungelling mixture added by microalgae without yeast was 1,835 ml and that with yeast was 5,904 ml. Biogas production from ungelling mixture of cassava starch effluent, yeast, ruminant bacteria, and urea in semi-continuous process wa s 18,161 ml. Adding of microalgae as nitrogen source did not give significant effect to biogas production. Adding of yeast wa s very helpful to accelerate biogas production. The biogas production increased after adding of cassava sta rch effluent and yeast. Requirement of Na2CO3 to increase alkalinity of
fermenting slurry depends on pH-value.
ACKNOWLEDGEMENT
First and foremost, we wish to express our high gratitude to God for the blessing and inspirations leading to the completion our thesis entitle Biogas Production using Anaerobic
Biodigester from Cassava Starch Effluent with Ruminant Bacteria as Biocatalyst.
We would like furthermore, to express our sincere thanks to:
1. Ir. Didi Dwi Anggoro, M.Eng., Ph.D., as thesis coordinator, who gave permission to conduct this study.
2. Dr. nat.techn. Siswo Sumardiono, S.T., M.T., our adviser for his smart advices that finally put us to end for this thesis.
3. Dirjen Dikti Republik Indonesia for financial support via PKM
4. Ir. Agus Hadiyarto, M.T., our lecturer who is in charge of Waste Treatment Laboratory, for his permission to use Waste Water Laboratory.
5. Ir. Budiyono, M.Si, our lecturer for his help and discussions during conduct this study. 6. Mr. Untung, our Laborant of Waste Treatment Laboratory, for his help during use Waste
Treatment Laboratory.
7. Our parent, who always support us.
Finally, we do realize that due to our limited ability this thesis must have shortcoming. For this, we welcome any suggestion and criticisms.
CONTENTS
Page
PAGE OF TITLE ...i
PAGE OF APPROVAL ... ii
SUMMARY ... iii
ACKNOWLEDGEMENT... iv
CONTENTS ... v
THE LIST OF TABLES ...vii
THE LIST OF FIGURES ... viii
CHAPTER I INTRODUCTION ... 1
1.1 Background of Study ... 1
1.2 Statement of the Problem ... 2
1.3 The Objectives of the Study ... 3
CHAPTER II THEORITICAL REVIEW ... 4
2.1 Tapioca and Effluent... 4
2.2 Biogas ... 5
2.3 Biogas Production Process ... 5
2.4 Factors Affecting Biogas Production... 7
2.5 Previous Experiment ... 8
CHAPTER III RESEARCH METHODOLOGY ... 9
3.1 Research Roadmap ... 9
3.2 Research Activities ... 10
CHAPTER IV RESULT AND DISCUSSION ... 12
4.1Physical and Chemical Compositions of Tapioca Effluent ... 12
4.2Biogas Production from Cassava Starch Effluent using Anaerobic Biodigester of 5 L Digestion Volume ... 12
4.3Study of Parameters Adjustment for Producing Optimum Biogas ... 13
4.4Determination of Characteristics of Biogas Production ... 14
CHAPTER V CONCLUSIONS AND RECOMMENDATIONS ... 28
5.1 Conclusions... 28
REFERENCES APPENDICES
APPENDIX A REAGENTS PREPARATION
THE LIST OF TABLES
THE LIST OF FIGURES
Page
Figure 2.1 Flow Diagram Tapioca Production Process ... 4
Figure 3.1 Research Roadmap and Inter-relation All Research Aspect ... 9
Figure 3.2 Water Displacement Technique ... 11
Figure 4.1 The Characteristics of The Experiment Result of Tank 1 ... 15
Figure 4.2 The Characteristics of The Experiment Result of Tank 2 ... 16
Figure 4.3 The Characteristics of The Experiment Result of Tank 3 ... 16
Figure 4.4 The Characteristics of The Experiment Result of Tank 4 ... 17
Figure 4.5 The Characteristics of The Experiment Result of Tank 5 ... 18
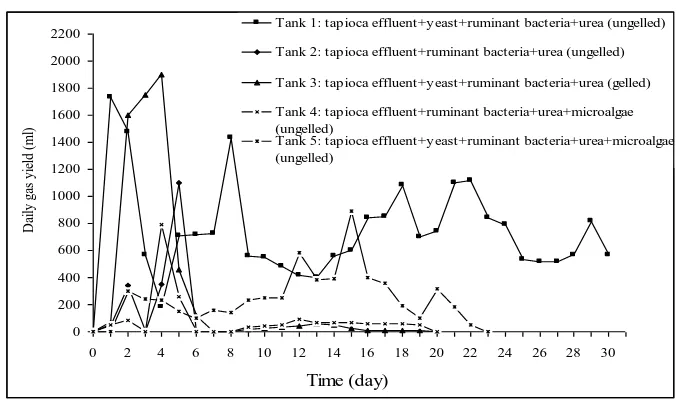
Figure 4.6 Daily Biogas Production (ml) from Various Feed Compositions Performed in Single State Biodigester of 5 L Digestion Volume ... 19
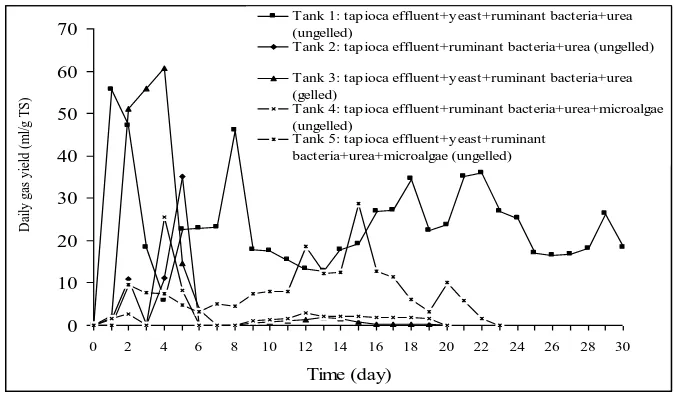
Figure 4.7 Daily Biogas Production per Gram Total Solid (ml/g TS) from Various Feed Compositions Performed in Single State Biodigester of 5 L Digestion Volume... 19
Figure 4.8 Accumulation Biogas Production (ml) from Various Feed Compositions Performed in Single State Biodigester of 5 L Digestion Volume ... 20
Figure 4.9 Total Gas Yield per Gram Total Solid (ml/g TS) from Various Feed Compositions Performed in Single State Biodigester of 5 L Digestion Volume ... 21
Figure 4.10 pH from Various Feed Composition Performed in Single State Biodigester of 5 L Digestion Volume ... 22
Figure 4.11 Buffer Na2CO3 Required for Rising Alkalinity Performed in Single State Biodigester of 5 L Digestion Volume ... 23
Figure 4.12 Temperature from Various Feed Composition Performed in Single State Biodigester of 5 L Digestion Volume ... 24
Figure 4.13 Daily and Accumulation Biogas Production from Tapioca Effluent Using Yeast, Ruminant Bacteria and Urea in Single State Biodigester of 5 L Digestion Volume... 25
CHAPTER I
INTRODUCTION
1.1 BACKGROUND OF STUDY
Indonesia is the third country of cassava producer after Brazil and Thailand, and has 1,205,440 hectares planted area and 21,990,381 tons cassava production/year (BPS, 2009). Mostly, cassava root is produced for tapioca starch. One of the tapioca starch central producer is in Margoyoso, Pati, Central Java, Indonesia. There are 399 small-medium scale industries (IKMs) which have average production capacity 10 tons cassava/IKM-day. In Margoyoso, demand of cassava root is aproximately 3,990 tons/day with total water consumption 15,960 m3/day. Consequently, the IKMs’ factory activities produce liquid and solid wastes. Concerning liquid waste, there are the washed cassava water and extracted water from the roots by squeezing (Cereda, 1994).
Water consumption of each IKM’s factory is 40 m3
/day. The problem is that the effluent from tapioca starch factories is released directly into the river before properly treatment. It has been a source of pollution and has caused environmental problems to the nearby rural population. Therefore, the effluent is the most important to be treated before discharging to the river. To treat the effluent, we can conduct coagulation and floculation process (Malhotra, et.al., 1994). But the recovery result of the product can not be used for food product because of chemical residue. The possible alternative is to use the effluent as raw material of biogas.
Biogas originates from bacteria in the process of bio-degradation of organic material under anaerobic (without oxygen) conditions. Biogas is a mixture of gases that is composed chiefly of methane (CH4): 55-70 vol. %, carbon dioxide (CO2): 30-45 vol. %,
other gases: 1-5 vol. % (Deublein et al., 2008).
Biogas technology of cassava wastewater was used anaerobic biodigester (Barana, 2000). Biogas production technology development nowadays is dominated by how can increase the consentration and the retention time of microbe in biodigester to increase biogas production rate. Biogas production with biodigester using cassava effluent with ruminant bacteria as biocatalyst is a new breakthrough in this project.
steps, such as Hydrolisis, Acidogenesis, Acetogenesis and Methanogenesis (Speece, 1996). One of the four bacteria, methano bacteria (the main component of biogas) has slowlest growth rate. So, this bacteria is the most considerable factor that control the overall rate of biogas production. Biogas conversion from the effluent then not only results in a production of a useful form of energy but also deals with the problem of environmental pollution caused by the tapioca starch processing plants.
1.2 STATEMENT OF THE PROBLEM
As one of the tapioca starch producer, IKMs’ factory activities in Margoyoso produces liquid, solid, and gas wastes. The problem is that the effluent from tapioca starch factories is released directly into the river before proper treatment. It has been a source of pollution and has caused environmental problems to the nearby rural population. Therefore, the effluent is the most important to be treated before discharging to the river. To treat the effluent, we can conduct coagulation and floculation process (Malhotra, et.al., 1994). But the recovery result of the product can not be used for food product. The possible alternative is to use the cassava effluent as raw material of biogas.
1.3 THE OBJECTIVES OF THE STUDY
Generally, the aim of this study is developing the experimental method of biogas production from cassava effluent in biodigester. The result of the study can give contribution to motivate small and middle industries to convert cassava effluent to biogas.
The specific objectives of this study can be defined as follows:
a. Study of biogas production from cassava starch effluent by adding microalgae as nitrogen source and yeast as substrate activator.
b. Study of biogas production from cassava starch effluent with the treatment of gelled and ungelled feed.
c. Study of pH control during biogas production using buffer Na2CO3.
CHAPTER II
THEORITICAL REVIEW
2.1 TAPIOCA AND EFFLUENT
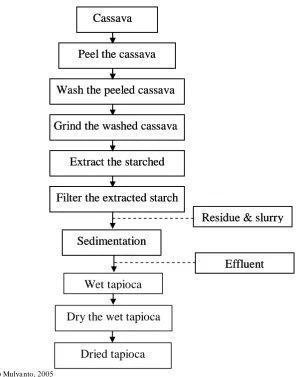
Indonesia has 1,205,440 hectares planted area and 21,990,381 tons cassava production/year (BPS, 2009). Tapioca is one of product made from cassava. The flow diagram process of tapioca production process can be seen in the figure 2.1.
*) Mulya nto, 2005
Figure 2.1 Flow Diagram Tapioca Production Process
From this process it can be identified that there is liquid and solid tapioca waste in the level of extraction. The tapioca effluent is potential raw material to convert to biogas (Anunputtikul, et al, 2004).
Cassava
Peel the cassava
Wash the peeled cassava
Grind the washed cassava
Extract the starched
Filter the extracted starch
Sedimentation
Residue & slurry
Effluent
Dry the wet tapioca Wet tapioca
Dried tapioca Cassava
Peel the cassava
Wash the peeled cassava
Grind the washed cassava
Extract the starched
Filter the extracted starch
Sedimentation
Residue & slurry
2.2 BIOGAS
Biogas originates from bacteria in the process of bio-degradation of organic material under anaerobic (without O2) conditions. The natural generation of biogas is an
important part of the biogeochemical carbon cycle. Methanogens (methane producing bacteria) are the last link in a chain of micro-organisms which degrade organic material and return the decomposition products to the environment. In this process biogas is generated, a source of renewable energy (Werner Kossmann, et al, 2008).
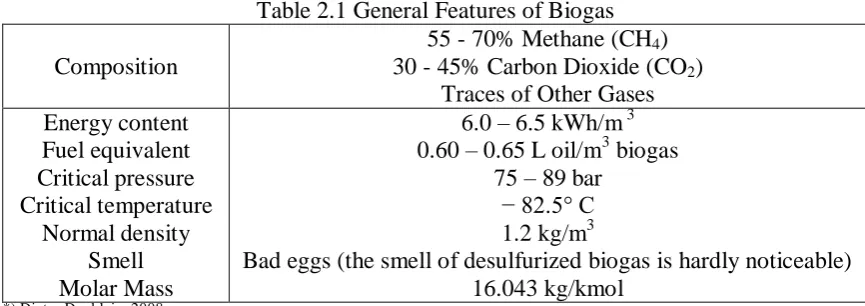
Biogas consists mainly of methane and carbon dioxide, but also contains several impurities. It has specific properties which are listed in Table 2.1. Biogas with methane content higher than 45% is flammable (Dieter Deublein, 2008).
Table 2.1 General Features of Biogas Composition
Bad eggs (the smell of desulfurized biogas is hardly noticeable) 16.043 kg/kmol
*) Dieter Deublein, 2008
2.3 BIOGAS PRODUCTION PROCESS
Bacteria decompose the organic matter in anaerobic environment. Biogas is an intermediate product of their metabolism. The decomposition process can be divided into 4 steps. Each of those are accompanied by different bacteria groups:
2.3.1 Hydrolysis
In the first stage aerobic bacteria reconstructs high - molecular substances (protein, carbohydrates, fats, cellulose) by means of enzymes to low-molecular compounds like monosaccharide, amino acids, fatty acids and water. Enzymes assigned by hydrolysis bacteria decompose substrate components to small water-soluble molecules. Polymers turn into monomers (separate molecules). This process called hydrolysis.
2.3.2 Acidogenesis
is partially accompanied by anaerobic bacteria that consume rest of oxygen hence providing suitable anaerobic environment for methane bacteria. The step is called acidogenesis.
C6H12O6 + 2 H2O → 2 CH3COOH + 2 CO2 + 4 H2
(acetic acid)
C6H12O6→ CH3CH2CH2COOH + 2 CO2 + 2 H2
(butiric acid)
C6H12O6 + 2H2→ 2 CH3CH2COOH + 2 H2O
(propionic acid)
2.3.3 Acetogenesis
Afterwards acid-forming bacteria forms initial products for methane formation: acetic acid, carbon dioxide and hydrogen. These products are formed from organic acids. For vital functions of these bacteria that consume hydrogen, stable temperature mode is very important.
CH3CH2COOH → CH3COOH + CO2 + 3H2
(acetic acid)
CH3CH2CH2COOH → 2 CH3COOH + 2H2
(acetic acid)
2.3.4 Methanogenesis
The last step is methane, carbon dioxide and water formation. Methane producing microorganisms occurs to the extent that anaerobic conditions are provided. 90% of methane yield takes place at this stage, 70% from acetic acid. Thus acetic acid formation (3rd step) is the factor that defines the speed of methane formations.
CH3COOH → CH4 + CO2
(methane)
2 H2 + CO2→ CH4 + 2 H2O
2.4 FACTORS AFFECTING BIOGAS PRODUCTION
2.4.1 Nutrients
Organic matters, which are broken down by microorganisms without oxygen, will produce some quantities of methane. All biological process requires sufficient supply of nutrients particularly carbon and nitrogen as well as other elements are also required in trace quantities. The lack of specific elements required for microorganism growth will limit the production of biogas. Nutrients are assigned by the ratio of carbon and nitrogen (approximate 20-30:1) (Anunputtikul, 2004). 2.4.2 pH
Hydrocarbons are easier to acidify, and no pH-buffering ions are released as with the degradation of proteins. Therefore the pH-value decreases more easily. With the degradation of carbohydrates, the partial pressure of hydrogen increases more easily, as with other substances. This happens in combination with the formation of reduced acidic intermediate products. The pH optimum of the methane-forming microorganism is at pH = 6.8-7.2. Therefore, it is important to adjust the pH-value. Only Methanosarcina is able to withstand lower pH values (pH = 6.5 and below). With the other bacteria, the metabolism is considerably suppressed at pH <6.7 (Dieter Deublein, 2008).
2.4.3 Temperature
2.5 PREVIOUS EXPERIMENT
Biogas can be made from substrates that contain carbon elements. So far, studies on biogas productions used raw materials from tapioca, tapioca effluent, cassava roots, tomatoes wastes, cow dung, chicken manure, etc. Several experiments have been conducted to get optimum yield of biogas, either by using different C/N ratio, different biodigester, existing bacteria, or nutrient addition. The results of previous study are as follow:
Table 2.2 Previous Experiments
No. Researcher Substrate Method Result
CHAPTER III
RESEARCH METHOD
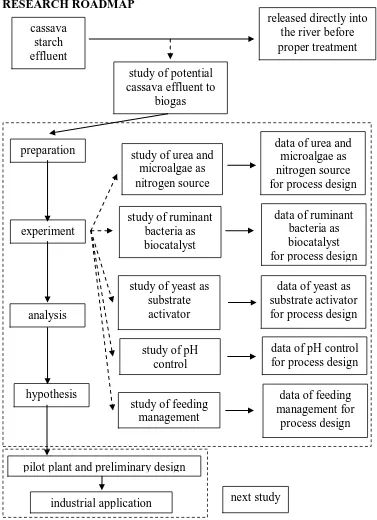
3.1 RESEARCH ROADMAP
3.2 RESEARCH ACTIVITIES
The research was focused on study of urea and microalgae as nitrogen source, ruminant bacteria as biocatalyst, yeast as substrate activator, pH control, and feeding management. In the end of research part, the application of the potential of effluent from tapioca starch factories convert to biogas was used as new alternative energy and environmental safety. The composition of biogas produced should be tested. Furthermore, the pilot plant test, preliminary design and economic evaluation on industrial scale will be investigated as further study of this research as industrial application.
3.2.1 Location
The research experiment was conducted in the Waste Treatment Laboratory, Chemical Engineering Department, Diponegoro University.
3.2.2 Material Preparation
Cassava starch effluent was made syntheticly with total solid 1% (w/v). 25 gr of cassava starch was dissolved in 2500 ml of mixing solution. Prepare urea as much as 0.04% (w/v) of mixing solution volume, ruminant bacteria as much as 10% (v/v) of mixing solution volume, yeast as much as 0.08 % (w/v) of mixing solution volume, and microalgae as much as 50% (v/v) of mixing solution volume. Mixing solution was heated and agitated for making the gelling solution. Na2CO3 was also
prepared if necessary for rising the alkalinity of pH solution. 3.2.3 Variable
Urea and ruminant bacteria were used as dependent variable, while yeast, microalgae, and the treatment of gelled and ungelled feed were used as independent variable.
3.2.4 Experiment Procedures
a.Study of biogas production from cassava starch effluent by adding microalgae as nitrogen source and yeast as substrate activator with the treatment of gelled and ungelled feed
effluent, ruminant bacteria, urea, and microalgae, Tank 5 was fed ungelling mixture of cassava starch effluent, ruminant bacteria, urea, yeast, and microalgae. While on semi-continuous process, the tank was fed ungelling mixture of cassava starch effluent, yeast, ruminant bacteria, and urea. This study was conducted in duplicate sample at ambient temperature for 30 days to obtain the volume of biogas production. The total biogas production was measured daily by the water displacement technique. The pH was measured daily and corrected when necessary with an alkaline buffer solution (Na2CO3). The equipment components
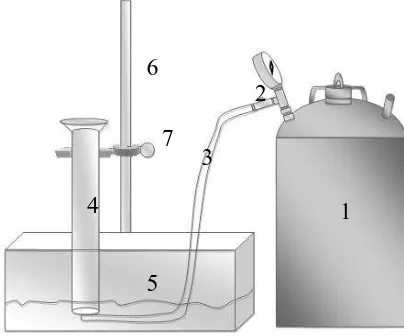
to measure the total biogas were fabricated as in Figure 3.2.
Figure 3.2 Water Displacement Technique Notes:
1.anaerobic biodigester 5L 2.valve
3.hose
4.measure glass 5.wash basin
6.statif 7.clamp
1 2
3 4
b.Study of pH control during biogas production using buffer Na2CO3
The pH was measured daily and corrected when necessary with an alkaline buffer solution (Na2CO3).
c.Study of feeding management in the semi-continuous process of biogas production Cassava starch effluent was fermented to achieve maximum output of biogas and reduction of total solids with minimum retention time under ambient conditions. In semi-continuous process, fresh feed (2 grams of total solid) was added every two days in order to displace the same amount of digested material to maintain the constant biogas production volume. Fresh yeast (0.08 % (w/v)) was also added every five days to stimulate biogas production.
CHAPTER IV
RESULT AND DISCUSSION
4.1 PHYSICAL AND CHEMICAL COMPOSITIONS OF CASSAVA STARCH
EFFLUENT
Cassava starch effluent was taken from Margoyoso, Pati, Central Java, Indonesia. There were 399 small-medium scale industries (IKMs) which had average production capacity 10 tons cassava/IKM-day. Water consumption of each IKM’s factory was 40 m3/day, so the total water consumption was 15,960 m3/day. Some physical and chemical compositions of cassava starch effluent is shown in the Table 4.1.
Table 4.1 Physical and Chemical Compositions of Cassava Starch Effluent No. Sample Amylose (ppm) Amylopectine (%) Total Solid (%)
*) Ana lysys Certifica te No. PS/106/IV/08 Food a nd Nutrient Study Center Ga ja h Ma da University
4.2 BIOGAS PRODUCTION FROM CASSAVA STARCH EFFLUENT USING
ANAEROBIK BIODIGESTER OF 5 L DIGESTION VOLUME
In this study, cassava starch effluent synthetic with 1% (w/v) of total solid as the substrate for biogas production was conducted in laboratory scale. The production was performed in the anaerobik biodigester of 5 L digestion volume. The anaerobic digestion was performed at ambient temperature (29.5-33 0C) for approximately 30 days.
4.3 STUDY OF PARAMETERS ADJUSTMENT FOR PRODUCING OPTIMUM
BIOGAS
4.3.1 The Concentration of Nitrogen Source
Nutrients have been considered to be the main factor affecting microorganisms in the biogas production. Like any other biological process, methanogenesis involves consortia of microorganisms that convert organic matters into methane, carbon dioxide and traces of other gases. The overall rates of organic matter utilization and methane production depend on the extent to which the nutritional requirements of the methanogenic bacteria and non-methanogenic bacteria could be met by constituents of the organic matters and by primary or secondary metabolites produced by one species (Bardiya and Gaur, 1999). Main nutrients is necessary for microorganisms in biogas production including carbon and nitrogen. Microorganisms in the anaerobic digestion commonly use carbon as an energy source for growth and nitrogen to built cell structure.
increase. The gas generation fails whenever the carbon to nitrogen ratio is higher than 52 : 1 (Sanders and Bloodgood, 1965). The carbon to nitrogen ratio employed in this study is 20-30:1.
Thus nitrogen supplement should be considered to enhance the biogas production from raw cassava starch effluent. Nitrogen can be added in inorganic form (e. g. ammonia) or in organic form (e. g. urea, animal manure or food waste) (Sterling
et al., 2001). In this study, urea was selected as nitrogen source due to it was easily digested to ammonia by variety of microorganisms. Additionally, urea which contained the nitrogen became nutrition source for the growth of microorganism. The concentration of urea 0.04% (w/v) was employed. Anunputtikul (2004) recommend for the biogas production from raw cassava starch effluent, concentration of urea should be 0.04 % (w/v). The overload of urea can be inhibited the methane production.
4.3.2 pH
Basicity or acidity of fermenting solution is indicated by pH. Most of methanogenic bacteria have pH optimal near neutrality (Jones et al., 1987). In this study, as Anunputtikul (2004) recommend, the optimum pH for biogas production was in the range of 6.8-7.2 with the limitation of the range for operation without significant inhibition being 6.5 to 7.6. Methanogenic bacteria can occasionally grow at pH ranges which defined as 6.5-8.2. As the reason for the methanogenic bacteria keeps alive and the production of biogas is optimum, the pH range should be 6.8-7.2.
4.3.3 Temperature
The biogas components and biogas yield depend on a feed materials due to the difference of material characteristics in each raw material (Anunputtikul, 2004). Many kinds of feed composition were investigated to determine characteristics of biogas production. In this study, the experiment had been done in batch and semi-continuous process. The characteristics of biogas production using batch and semi-continuous process are discussed as follow.
4.4.1 Batch Process
Tank 1 contained ungelling mixture of cassava starch effluent, yeast, ruminant bacteria, and urea. Tank 2 contained ungelling mixture of cassava starch effluent, ruminant bacteria, and urea. Tank 3 contained gelling mixture of cassava starch effluent, yeast, ruminant bacteria, and urea. Tank 4 contained ungelling mixture of cassava starch effluent, ruminant bacteria, urea, and microalgae. Tank 5 contained ungelling mixture of cassava starch effluent, ruminant bacteria, urea, yeast, and microalgae. The anaerobik biodigester with working volume of 5 L was performed at ambient temperature (29.5-33 0C) for 30 days.
a. The characteristics of the experiment result of each tank.
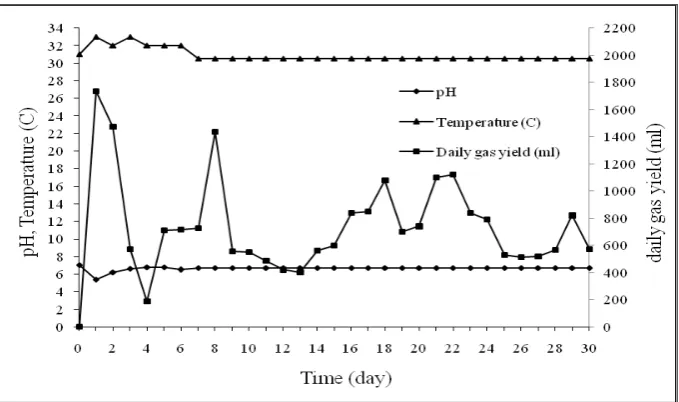
Figure 4.1 The Characteristics of The Experiment Result of Tank 1
and fourth days, the production of biogas decreased significantly, only 570 ml and 186 ml of which pH conditions at 6.64-6.79 and temperature 32-330C. Biogas production on fifth to seventh days tended to be equal to the average production of 715 ml per day at temperature 31-320C and pH 6.48-6.79. Whereas on eighth day, there was an significant increased of biogas production reached 1.435 ml at temperature 310C and pH 6.54. Biogas production after eighth day remained fluctuative but lower than previous days, while the pH and temperature on eighth day to thirtieth remain stable at pH 6.9 and temperature 310C.
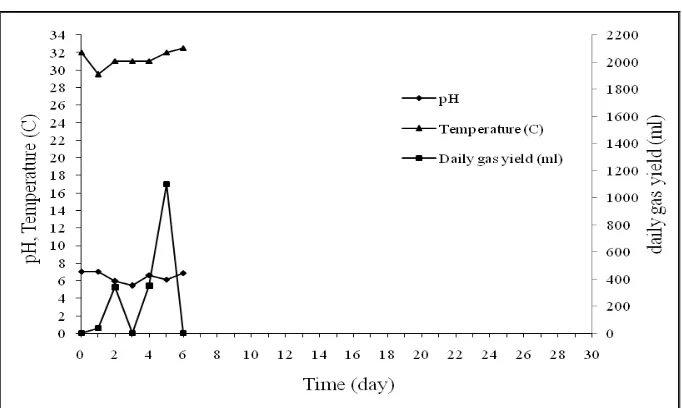
Figure 4.2 The Characteristics of The Experiment Result of Tank 2
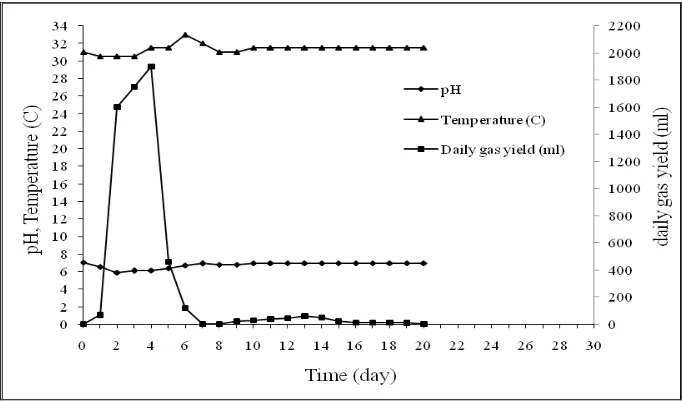
Figure 4.3 The Characteristics of The Experiment Result of Tank 3
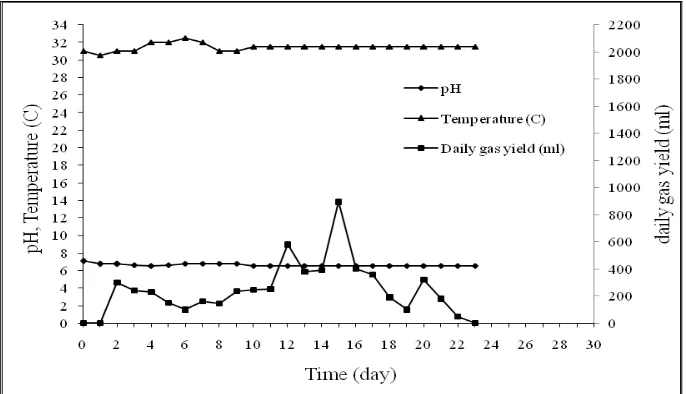
Figure 4.4 The Characteristics of The Experiment Result of Tank 4
Figure 4.4 shows that the production of biogas with ungelling mixture cassava starch effluent, ruminant bacteria, microalgae, and urea at the beginning of the experiment until second day, the biogas production was between 50-80 ml. On third day, there is no biogas production. However, on fourth day biogas production was very significantly increased at 795ml. The decline occurred on day five and biogas did not produce on day six to day eight. However, on day nine to day nineteen biogas still produced but in small number (very low), between 36-94ml. Biogas productions was completely discharged on day twenty. pH of the substrate decreased on day three and day four. The pH was increased and stable from day ten to day twenty. At the beginning of fermentation, it increased up to day ten, and the temperature fluctuated between 30-310C. Temperature remained stable on the day eleven to the day twenty at 31.50C.
Figure 4.5 The Characteristics of The Experiment Result of Tank 5
day twenty-two. On twenty-third day, the biogas was not produced anymore. The decreasing of pH occurred until the day four of the experiment. On the day five to day eigh, there was an increasing of pH (6.64-6.8). pH was relatively stable from day nine to day twenty-three at pH 6.83. At the beginning of fermentation up to day ten, the temperature fluctuated between 30.5-32.50C. Temperature remained stable on day eleven to day twenty-two in the temperature at 31.50C.
b. Biogas production from various feed compositions
0
Tank 1: tap ioca effluent+y east+ruminant bacteria+urea (ungelled)
Tank 2: tap ioca effluent+ruminant bacteria+urea (ungelled)
Tank 3: tap ioca effluent+y east+ruminant bacteria+urea (gelled) Various Feed Compositions Performed in Anaerobik Biodigester of 5 L Digestion Volume.
Figure 4.6 shows biogas production in ml and Figure 4.7 shows biogas production in ml per gram total solid.
0
Tank 2: tap ioca effluent+ruminant bacteria+urea (ungelled)
Tank 3: tap ioca effluent+y east+ruminant bacteria+urea (gelled)
Tank 4: tap ioca effluent+ruminant bacteria+urea+microalgae (ungelled)
Tank 5: tap ioca effluent+y east+ruminant bacteria+urea+microalgae (ungelled)
Figure 4.8 Accumulation Biogas Production (ml) from Various Feed Compositions Performed in Anaerobik Biodigester of 5 L Digestion Volume.
Figure 4.3 shows that accumulation biogas production from the gelling mixture (Tank 3) is high enough at the beginning of fermentation rather than the ungell mixture (Tank 2,4,5). It is caused by the formation of shorter carbon chains and yeast. Shorter carbon chains are more easily degraded by external enzymes produced by fermentative microorganism to lower molecular weight molecules (Milono, et al, 1981) so that in the next stage the bacteria would be easier to convert these organic materials into biogas. Yeast added also simplifies the hydrolysis processes. Unfortunately, biogas productions using the gelling mixture can not long lasting because the substrates digest faster by hydrolysis bacteria which accelerate with availability of yeast and form of shorter carbon chains. It ceases at sixth day retention time. If the substrates completely hydrolyzed and there is no fresh feeding into biodigester, biogas production will be finished. Better yield comes from Tank 1 which contains cassava starch effluent, ruminant bacteria, yeast, and urea without gelling. From the beginning, Tank 1 increase more significant than the other and still produce biogas until more than 30 days. Yeast as substrate activator and ruminant bacteria accelerates biogas production, but the substrates in biodigester do not hydrolyzed completely. It keeps biodigester produce biogas for long lasting.
used these simple organic materials as substrates to produce volatile acids, hydrogen, and carbon dioxide. Finally the methanogenic bacteria became established in the biodigester, and used end product from the acid forming bacteria digestion to produce methane. In this stage, methanogenic bacteria were predominant (Anunputtikul, 2004). Thus, the methane content of the biogas was starch effluent, yeast, bacteria ruminant, and urea (726.43 ml/g total solid).
If total biogas yield from Tank 2 and 4 were compared, adding microalgae as nitrogen source did not give significant effect to biogas production. Microalgae did not influence biogas production exceedingly. At Tank 1, 3, and 5 which used yeast as substrate activator, adding of yeast was very helpful to accelerate biogas production, so it also was used for semi-continuous process.
H2-producing bacteria) into acetate, hydrogen gas, carbon dioxide, and few other VFA such as propionic and butyric acid. The third stage was the methanogenic stage. The methanogenic bacteria or methane-forming bacteria produce methane, carbon dioxide, trace gases (e.g., H2S), and water. It was almost that 70% of methane was formed from acetate, and the rest was formed from carbon dioxide and hydrogen.
c. pH from various feed compositions
0 1 2 3 4 5 6 7 8
0 1 2 3 4 5 6 7 8 9 10
Time (day)
pH
Tank 1: tapioca effluent+yeast+ruminant bacteria+urea (ungelled) Tank 2: tapioca effluent+ruminant bacteria+urea (ungelled) Tank 3: tapioca effluent+yeast+ruminant bacteria+urea (gelled) Tank 4: tapioca effluent+ruminant bacteria+urea+microalgae (ungelled) Tank 5: tapioca effluent+yeast+ruminant bacteria+urea+microalgae (ungelled)
Figure 4.10 pH from Various Feed Composition Performed in Anaerobik Biodigester of 5 L Digestion Volume.
Figure 4.11 Buffer Na2CO3 Required for Rising Alkalinity Performed in Anaerobik
Figure 4.10 shows that the pH ranges of 5.84-6.94; 5.38-7.07; 5.38-6.9; 6.25-7.03; and 6.53-7.07 were found in the Tank 1, 2, 3, 4 and 5, respectively. Figure 4.11 shows Na2CO3 required for rising alkalinity based on delta pH solution. %
adding of Na2CO3 to delta pH solution was expressed by equation y = 3.914x +
0.042, so 0.39% of Na2CO3 was added in Tank 1 because the pH decrease from 7.1
to 5.4 at the first day fermentation. At the second, third, and sixth days, the pH was 6.2, 6.6, and 6.5 as a result 0.19%, 0.09%, 0.117% of Na2CO3 was added,
respectively. In Tank 2, at the second, third, fourth, and fifth days, the pH was 5.9, 5.41, 6.6, and 6.12 therefore of 0.27%, 0.395%, 0.09%, and 0.21% of Na2CO3 was
added, respectively. In Tank 3, 0.28%, 0.22%, 0.21%, 0.15% of Na2CO3 was added
at second, third, fourth, and fifth days. In Tank 4, 0.18% of Na2CO3 was added at
fourth day. In Tank 5, 0.1% of Na2CO3 was added at fourth day.
When the digester was initially heavily fed, acid forming bacteria quickly produced acids. The drop of pH was caused acid forming bacteria produce acetate, hydrogen gas, carbon dioxide, and few other VFA such as propionic and butyric acid. A low pH value inactivated microorganisms involved in the biogas production especially methanogenic bacteria (Vicenta et al., 1984).
In order to allow the methanogenic bacteria to grow, digester should be properly fed and buffered to rising alkalinity. In this study, Sodium carbonate (Na2CO3) was used to increase alkalinity or buffering capacity of fermenting slurry.
It was added to the digester whenever the pH below 6.8.
Since the reaction rate involving acid-forming bacteria proceeded much faster than the reaction involving methanogenic bacteria, a larger population of methanogenic bacteria must be fed and maintained. The methanogenic bacteria population might not be adequate to consume the acids produced and maintain a neutral pH resulting in declining pH below the neutral pH and diminishing growth of methanogenic bacteria and methanogenesis. The pH could be maintaining by adding Na2CO3 to increase alkalinity. The pH was the key indicator of operational
20
Tank 1: tap ioca effluent+y east+ruminant bacteria+urea (ungelled)
Tank 2: tap ioca effluent+ruminant bacteria+urea (ungelled)
Tank 3: tap ioca effluent+y east+ruminant bacteria+urea (gelled)
Tank 4: tap ioca effluent+ruminant bacteria+urea+microalgae (ungelled)
Tank 5: tap ioca effluent+y east+ruminant bacteria+urea+microalgae (ungelled)
Figure 4.12 Temperature from Various Feed Composition Performed in Anaerobik Biodigester of 5 L Digestion Volume.
During 30 days of operation, the temperature ranges of 30.5-330C, 29.5-330C, 31-330C, 30-32.50C, and 30.5-32.50C were found in the digester 1, 2, 3, 4 and 5, respectively (Figure 4.12). At the initial retention time, the temperature was fluxtuative from 29.50C until 330C, but since the day thirteenth the temperature of mixtures stabilized. A slightly difference of temperature between the gelling feed and ungelling feed was occured but they still in the range of mesophilic temperature (29.5-330C).
As the temperature falls, microbial activity decreases and the biogas production decreases. As the temperature increases some microorganisms begin to die, once again the production of biogas decreases.
4.4.2 Semi-continuous Process
Based on previous batch experiment, it was known that the adding of microalgae was not give significant effect to biogas production. So, in the semi-continuous experiment, microalga was not added. As nitrogen source, adding of urea was well to do.
ammount of feeding (2 grams per two days). The aim of this feeding management was increasing of biogas production (Sitohang, 2000).
a. Biogas production
Figure 4.13 Daily and Accumulation Biogas Production from Cassava starch Effluent using Yeast, Ruminant Bacteria and Urea in Anaerobik Biodigester of 5 L Digestion Volume.
However, the increasing of feeding-value will increase biogas production until certain value, then biogas production will be decrease exactly. It is based on substrate retention time in biodigester. More adding feeding-value, retention time in biodigester will be shorter, consequently also shorter in reaction time because substrate will be push out before the reaction complete.
b. pH and Temperature
Figure 4.14 pH and Temperature Performed in Anaerobik Biodigester of 5 L Digestion Volume.
During 30 days of operation, the pH ranges of 5.52-7.06 was found (Figure 4.14). The initial drops in pH from 7.04 to 5.52 was observed at first day retention time. At that time, a low pH value inactivated microorganisms involved in the biogas production especially methanogenic bacteria (Vicenta et al., 1984), so adding of Na2CO3 (0.2%) is needed to raising alkalinity in order to keep
microorganisms alive. On the second day, the pH stabilized at neutral pH. pH stability stayed awake until the 30-day because there were the addition of cassava starch effluent and yeast, so the activities of microorganisms remained stable.
Biogas production The simple anaerobik semi-continuous biodigester volume of 5 L digestion volume was performed at ambient temperature (27-33 0C) for 30 days at mesophilic level. There are three kinds of bacteria which have response with alteration temperature:
Mesophilic bacteria, these bacteria live at 20-400C with the optimum growth temperature is 35-400C.
Thermophilic bacteria, these bacteria grow at 40-650C with the optimum temperature between 55-600C.
CHAPTER V
CONCLUSIONS AND RECOMMENDATIONS
5.1 CONCLUSIONS
Anaerobic fermentation of biogas production is very complex reactions which involve many intermediate compound and microorganisms that play important role in anaerobic fermentation. This study focuses on the used of urea, ruminant, yeast, microalgae, the treatment of gelled and ungelled feed for biogas production, pH control during biogas production using buffer Na2CO3, and feeding management in the semi-continuous process of
biogas production. The result can be concluded as follows:
a. Adding of microalgae as nitrogen source did not give significant effect to biogas production. But adding of yeast as substrate activator was very helpful to accelerate biogas production.
b. The biogas production increased after cassava starch effluent and yeast was added. c. Biogas production from the ungelling and gelling mixture of cassava starch effluent,
yeast, ruminant bacteria, and urea were 726.43 ml/g total solid and 198 ml/g total solid. d. Biogas production from ungelling mixture without yeast was 58.6 ml/g total solid. e. Biogas production from ungelling mixture added by microalgae without yeast was 58.72
ml/g total solid and that with yeast was 189 ml/g total solid.
f. Biogas production from ungelling mixture of cassava starch effluent, yeast, ruminant bacteria, and urea in semi-continuous process was 581.15 ml/g total solid.
g. Requirement of sodium carbonate (Na2CO3) to increase alkalinity or buffering capacity
of fermenting solution depends on pH-value.
5.2 RECOMMENDATIONS
This study deals only with the composition of the feed, biogas production rate, the operating temperature, and the operating pH. For further research, it can be recommended as follows:
a. To find out how to control the stability of pH.
c. To determine the appropriate time foor feeding.
REFERENCES
Analysys Certificate No. PS/106/IV/08 Food and Nutrient Study Center Gajah Mada University. Anunputtikul, W., Rodtong, S., Investigation of The Potential Production of Biogas from
Cassava Tuber, Abstracts of the 15th Annual Meeting of The Thai Society for Biotechnology and JSPS-NRCT Symposium, Thailand, 2004, p. 70.
Anunputtikul, W., Rodtong, S., Laboratory Scale Experiments for Biogas Production from Cassava Tubers, The Joint International Conference on “Sustainable Energy and
Environment (SEE)”, Hua Hin, Thailand, 2004.
Barana, A.C., Cassava Wastewater (Manipueira ) Treatment Using A Two-Phase Anaerobic Biodigestor, Campinas, 2000.
Bardiya, N. and Gaur, Biomethanation of Banana Peel and Pineapple Waste, Bioresource Technology 58: 73-76, 1999.
Biogas Production Process, ZORG Ukraine Biogas Plants,
http://Biogas%20Production%20process_%20Four%20steps%20of%20fermentation.mht, e-mail: [email protected], (June 28th, 2009).
Bitton, G., Wastewater Microbiology, New York: A John Wiley & Sons, 1994 BPS, Produksi Bahan-bahan Pangan Indonesia, 2009.
Bunchueydee, P., Industrial Biogas: A Feasibility Study of Waste Utilization from Agro-industry in Thailand, Bangkok: Division of Energy Research and Development National Energy Administration Ministry of Science, Technology and Energy, 1984.
Busby, M. R., Tragitt G., Norman R. and Hillman K., A Complete Disposal-recycle Scheme for Agricultural Solid Waste, In Environmental Protection Technology, Environmental Protection Agency, Quoted in Milono, P., Biogas production from Agricultural Organic Residues, 1981, In the First ASEAN Seminar Workshop on Biogas Technology, Working Group on Food Waste Materials (pp. 52-65), Manila, Philipines: ASEAN Comitte on Science and Technology, 1977
Cereda, M.P., Caracterizacao dos Residuos da Industriaizacao da Mandicoa, In: Cereda, M.P. (Ed), Residuos da Industriaizacao da Mandicoa, Sao Paulo: Pauliceia, 1994, p. 11-50. Deublein, D., Steinhauster, A., Biogas from Waste and Renewabe Resources. An Introduction,
WILEY-VCH Verlag GmbH & Co. KGaA, Weinheim, 2008, p. 50.
Direktorat Pengolahan Hasil Pertanian, Pemanfaatan Limbah dan Kotoran Ternak menjadi Energi Biogas, Departemen Pertanian, 2009.
Hargono, Pembuatan Biogas serta Pemurniannya melalui Absorbsi Gas Karbondioksida (CO2)
dengan Menggunakan Larutan NaOH, Prosiding Seminar Nasional Rekayasa Kimia dan Proses, Jurusan Teknik Kimia Fakultas Teknik Universitas Diponegoro Semarang, Indonesia, 2008.
Jones, W. J., Nagel D. P. Jr. and Whitman, W. B., Methanogens and The Diversity of Archaebacteria, Microbiological Reviews 51: 135-177, Quoted in Boone, D. R., Whitman W. B. and Rouviere P., Diversity and Taxonomy of Methanogens, In Ferry, J. G. (ed), Methanogenesis: Ecology, Physiology, Biochemistry & Genetics (pp. 35-80), New York: Champman & Hall, 1987.
Thermophilic Temperatures, Applied Microbiology and Biotechnology 43: 346-350, 1995. Malhotra, M.S., Poly Aluminium Chloride as An Alternative Coagulant, 20th WEDC Conference
Colombo: Affordable Water Supply and Sanitation, Sri Lanka, 1994.
Manilal, V.B., Narayanan, C.S. and Balagopalan, C., Anaerobic digestion of cassava starch factory effluent, World Journal of Microbiology and Biotechnology 6, 1990, p. 149-154. Milono, P., Lindajati T. and Aman S., Biogas Production from Agricultural Organics Residues,
In The First ASEAN Seminar Workshop on Biogas Technology, Working Group on Food Waste Material (pp. 52-65), Manila, Philipines: ASEAN Committee on Science and Technology, 1981.
Mulyanto, A., Titiresmi, Implementation of Anaerobic Process On Wastewater From Tapioca Starch Industries, Laporan Penelitian BPPT, Puspitek Serpong, Tangerang, Indonesia, 2005.
Padmasiri, S.I., Zhang, J., Fitch, M., Norddahl, B., Morgenroth, E. and Raskin, L., Methanogenic Population Dynamics and Performance of An Aerobic Membrane Bioreactor(AnMBR) Treating Swine Manure Under High Shea r Condition, Water Research 41, 2007, p. 134-144.
Pohland, F. G. and Bloodgood D. E., Laboratory Studies on Mesophilic and Thermophilic Anaerobic Sludge Digestion, Journal of Water Pollution Control Federation 1: 11-42, Quoted in Kunawanakit, C., Biogas Production by Anaerobic Digestion of Water Hyacinth, M. S. Thesis, Chulalongkorn University, Tailand, 1963.
Polprasert, C., Organics Wastes Recycling, Chichester: Wiley, Quoted in Bitton, G., Wastewater Microbiology, 1994, New York: A John Wiley & Sons, 1989.
Ribas, M.M.F, Barana, A.C., Start-up Adjustment of A Plug Flow Digester for Cassa va Wastewater (Manipueira) Treatment, Scientia Agricola, v. 60, n. 2, 2003, p. 223-229. Rodtong, S., Anunputtikul, W., Conversion of Raw Cassava Roots to Biogas, Thailand, 2004. Renewable Natural Gas, http://en.wikipedia.org/wiki/Renewable_natural_gas, (June 28th, 2009). Saev, M., Koumanova, B. and Simeonov, Iv., Anaerobic Co-digestion of Wasted Tomatoes and
Cattle Dung for Biogas, Journal of the University of Chemical Technology and Metallurgy, 44, 1, 2009, p. 55-60.
Sanders, F. A. and Bloodgood D. E., The Effect of Nitrogen to Carbon Ratio on Anaerobic Decomposition, Journal of The Water Pollution Control Federation 37: 1741, Quoted in Viswanath, P., Devi S. S. and Nand K., Anaerobic Digestion of Fruit and Vegetable Processing Wastes for Biogas Production, Bioresource Technology 40: 43-48, 1965.
Simamora, Suhut, Slaundik, Sri Wahyuni, dan Sirajudin, Membuat Biogas Pengganti Bahan Bakar Minyak dan Gas dari Kotoran Ternak, Agro Media Pustaka, Jakarta, 2006.
Sitohang, Tongam J. L. dan Ihwan U. F., Evaluasi Parameter-Pa rameter yang Mempenga ruhi Produksi Biogas pada Bioreaktor Anaerobik, TK-470 Penelitian, Institut Teknologi Bandung, 2000.
Speece, R.E., Anaerobic Technology for Industrial Wastewater, Archae Press, USA, 1996. Sterling, M. C. Jr., Lacey R. E., Engler E. R. and Ricke S. C., Effects of Ammonia Nitrogen on
H2 and CH4 Production during Anaerobic Digestion of Daily Cattle Manure, Bioresource
Technology 77: 9-18, 2001.
Tanticharoen, M., Bhumiratana S., Putamayothin N. and Supajunya N., Biogas Technology in Thailand, In Bidin R., Chong C. N. and Wang C. W. (eds), Proceeding of the Second ASEAN Workshop on Biogas Technology Applied in the Management and Utilization of Food Waste Materials (pp. 104-110), Kuala Terengganu, Malaysia, 1984.
N. and Wang C. W. (eds), Proceeding of the Second ASEAN Workshop on Biogas Technology Applied in the Management and Utilization of Food Waste Materials (pp. 189-202), Kuala Terengganu, Malaysia, 1984.
APPENDIX A
REAGENTS PREPARATION
1. Cassava Starch Effluent Synthetic
1% (w/v) of mixing solution volume = 2,500 25gr 100
1
2. Urea
0.04% (w/v) of mixing solution volume = 2,500 1gr 100
0.04
3. Ruminant Bacteria
10% (v/v) of mixing solution volume = 2,500 250ml 100
10
4. Yeast
0.08% (w/v) of mixing solution volume = 2,500 2gr 100
0.08
5. Microalgae
50% (v/v) of mixing solution volume = 2,500 1,250ml 100
50
6. Water
For Tank 1, 2 and 3, water = mixing solution volume - ruminant bacteria = 2,500 – 250
= 2,000 ml
For Tank 4 and 5, water = mixing solution volume - ruminant bacteria – microalgae = 2,500 – 250 – 1,250
APPENDIX B
PARAMETERS AND RESULT OF BIOGAS PRODUCTION
USING ANAEROBIC BIODIGESTER FROM CASSAVA
STARCH EFFLUENT
Table 1 B. Biogas Production from Cassava Starch Effluent with Batch Process
Day
Tank1 Tank2
Table 2 B. Biogas Production from Cassava Starch Effluent with Semi-continuous Process Day
APPENDIX C
FIGURES OF RESEARCH MATERIALS AND APPARATUS
Figure 1. Anaerobic biodigester
Figure 3. Temperature measuring
Figure 4. pH measuring
BIOGAS PRODUCTION USING ANAEROBIC BIODIGESTER
FROM CASSAVA STARCH EFFLUENT
WITH RUMINANT BACTERIA AS BIOCATALYST
Audra Ayu O. (L2C006023) and Vincensia Dyan Aryati (L2C006106)
Chemical Engineering Department, Technical Faculty, Diponegoro University Jalan Prof. Sudharto, Tembalang, Semarang, 50239, Telp/Fax: (024)7460058
Advisor: Dr. nat.techn. Siswo Sumardiono, ST, MT
Abstract
IKMs’ factory activity in Margoyoso produces liquid and solid wastes. The possible alternative
was to use the liquid effluent as biogas raw material. This study focuses on the used of urea, ruminant, yeast, microalgae, the treatment of gelled and ungelled feed for biogas production, pH control during biogas production using buffer Na2CO3, and feeding management in the
semi-continuous process of biogas production that perform at ambient temperature for 30 days. Ruminant bacteria, yeast, urea, and microalgae was added 10% (v/v), 0.08% (w/v), 0.04% (w/v), 50% (v/v) of mixing solution volume, respectively. The pH of slurry was adjusted with range 6.8-7.2 and was measured daily and corrected when necessary with Na2CO3. The total biogas
production was measured daily by the water displacement technique. Biogas production from the ungelling and gelling mixture of cassava starch effluent, yea st, ruminant bacteria, and urea were 726.43 ml/g total solid and 198 ml/g total solid. Biogas production from ungelling mixture without yeast was 58.6 ml/g total solid. Biogas production from ungelling mixture added by microalgae without yeast was 58.72 ml/g total solid and that with yeast was 189 ml/g total solid. Biogas production from ungelling mixture of cassava starch effluent, yeast, ruminant bacteria, and urea in semi-continuous process was 581.15 ml/g total solid. Adding of microalgae as nitrogen source did not give significant effect to biogas production. But adding of yeast as substrate activator was very helpful to accelerate biogas production. The biogas production increased after cassava starch effluent and yeast was added. Requirement of sodium carbonate (Na2CO3) to increase
alkalinity or buffering capacity of fermenting solution depends on pH-value.
Key Words: biogas cassava; C/N ratio; ruminant bacteria; semi-continuous biodigester; yeast
1. Introduction
Indonesia is the third country of cassava producer after Brazil and Thailand, and has 1,205,440 hectares planted area and 21,990,381 tons cassava production/year (BPS, 2009). Mostly, cassava root was produced for tapioca starch. There are 399 small-medium scale industries (IKMs) in Margoyoso, Pati, Central Java, Indonesia, which have average production capacity 10 tons cassava/IKM-day. So, demand of cassava root was aproximately 3,990 tons/day with total water consumption 15,960 m3/day. Consequently, the IKMs’ factory activities produce liquid and solid wastes. The problem was that the effluent from tapioca starch factories was released directly into the river before properly treatment. To treat the effluent, we can conduct coagulation and floculation process (Malhotra, et.al., 1994). But the recovery result of the product can not be used for food product because of chemical residue. The possible alternative was to use the effluent as raw material of biogas.
Biogas production was conducted in the semi-continuous biodigester. Urea and microalgae were used as source of nitrogen in the biodigester. In this anaerobic process, ruminant bacteria was added as biocatalyst to enhance biogas production. This study focuses on the used of urea, ruminant, yeast, microalgae, the treatment of gelled and ungelled feed for biogas production, pH control during biogas production using buffer Na2CO3, and feeding management in the semi-continuous process of biogas production.
2. Materials and Methods
l
Cassava starch effluent was made syntheticly with total solid 1% (w/v). 25 gr of cassava starch was dissolved in 2,500 ml of mixing solution. Prepare urea as much as 0.04% (w/v) of mixing solution volume, ruminant bacteria as much as 10% (v/v) of mixing solution volume, yeast as much as 0.08% (w/v) of mixing solution volume, and microalgae as much as 50% (v/v) of mixing solution volume. Mixing solution was heated and agitated for making the gelling solution. Na2CO3 was also prepared if necessary for rising the alkalinity of pH solution.
2.2 Variable
Urea and ruminant bacteria were used as dependent variable, while yeast, microalgae, and the treatment of gelled and ungelled feed for biogas production as independent variable.
2.3 Experiment Procedures
d. Study of biogas production from cassava starch effluent by adding microalgae as nitrogen source and yeast as substrate activator with the treatment of gelled and ungelled feed
The production of biogas from cassava effluent was performed using anaerobic biodigester of 5 L digestion volume (Figure 1), but the volume of mixing solution was half of biodigester reactor. On batch process, Tank 1 was fed ungelling mixture of cassava starch effluent, yeast, ruminant bacteria, and urea, Tank 2 was fed ungelling mixture of cassava starch effluent, ruminant bacteria, and urea, Tank 3 was fed gelling mixture of cassava starch effluent, yeast, ruminant bacteria, and urea, Tank 4 was fed ungelling mixture of cassava starch effluent, ruminant bacteria, urea, and microalgae, Tank 5 was fed ungelling mixture of cassava starch effluent, ruminant bacteria, urea, yeast, and microalgae. While on semi-continuous process, the tank was fed ungelling of cassava starch effluent, yeast, ruminant bacteria, and urea. This study was conducted in duplicate sample at ambient temperature for 30 days to obtain the volume of biogas production. The total biogas production was measured daily by the water displacement technique. The pH was measured daily and corrected when necessary with an alkaline buffer solution (Na2CO3). The equipment components to measure the total biogas were fabricated as in Figure 1.
Figure 1. Water Displacement Technique
e. Study of pH control during biogas production using buffer Na2CO3.
The pH was measured daily and corrected when necessary with an alkaline buffer solution (Na2CO3). f. Study of feeding management in the semi-continuous process of biogas production
Cassava starch effluent was fermented to achieve maximum output of biogas and reduction of total solids with minimum retention time under ambient conditions. In semi-continuous process, fresh feed (2 grams of total solid) was added every two days in order to displace the same amount of digested material to maintain the constant biogas production volume. Fresh yeast (0.08% (w/v)) was also added every five days to stimulate biogas production.
3. Results and Discussion
3.1 Determination of Characteristics of Biogas Production
The biogas components and biogas yield depend on a feed materials due to the difference of material characteristics in each raw material (Anunputtikul, 2004).
li 4.4.3 Batch Process
a. Biogas production
Figure 2. Daily Biogas Production per Gram Total Solid (ml/g total solid) from Various Feed Compositions Performed in Anaerob Biodigester of 5 L Digestion Volume.
Figure 2 shows that a significant increasing in biogas production per day was found when the feed was gelled (Tank 3). At the beginning of fermentation, the biogas production per day from the ungelling feed of Tank 2, 4, and 5 were relatively low but the biogas production per day from the ungelling feed of Tank 1 was high from the beginning. The maximum of biogas production per day from Tank 1 was 55.52 ml/g total solid at the first day retention time. The maximum of biogas production per day from Tank 2 was 35.2 ml/g total solid at fifth day retention times. The maximum biogas production per day of Tank 3 and 4 were 60.8 ml/g total solid and 25.44 ml/g total solid, respectively at fourth day retention times. The maximum of biogas production per day from Tank 5 was 28.6 ml/g total solid at day twelve retention times. The fermentation reactions of Tank 1, 2, 3, 4 and 5 were ceased after operating for 40, 6, 20, 20, and 23 days, respectively.
Figure 3. Total Gas Yield per Gram Total Solid (ml/g total solid) from Various Feed Compositions Performed in Anaerob Biodigester of 5 L Digestion Volume.
The total biogas yield from Tank 1, 2, 3, 4 and 5 were 726.43, 58.6, 198, 58.72 and 189 ml/g total solid, respectively (Figure 3). The maximum of total biogas yield of this experiment was obtained from ungelling mixture of cassava starch effluent, yeast, bacteria ruminant, and urea (726.43 ml/g total solid).
lii
The steps employed in this study were as Milono, et al (1981). In the first stage, which was the fermentative stage, organic materials (protein, cellulose, lipid, and starch) were broken down by fermentative microorganism to lower molecular weight molecules. The second stage was the acid-forming stage. In this stage, products from the first stage were converted by acetogenic bacteria (acetate and H2-producing bacteria) into acetate, hydrogen gas, carbon dioxide, and few other VFA such as propionic and butyric acid. The third stage was the methanogenic stage. The methanogenic bacteria or methane-forming bacteria produce methane, carbon dioxide, trace gases (e.g., H2S), and water. It was almost that 70% of methane was formed from acetate, and the rest was formed from carbon dioxide and hydrogen.
b. pH from various feed compositions
Figure 4. pH from Various Feed Composition Performed in Anaerob Biodigester of 5 L Digestion Volume.
Figure 4 shows that the pH ranges of 5.84-6.94; 5.38-7.07; 5.38-6.9; 6.25-7.03; and 6.53-7.07 were found in the Tank 1, 2, 3, 4 and 5, respectively. The pH was corrected with Na2CO3 when the pH below 6.8. Based on previous study that the relation of percentage adding of Na2CO3 to delta pH solution was expressed by equation y = 3.914x + 0.042, so 0.39% of Na2CO3 was added in Tank 1 because the pH decrease from 7.1 to 5.4 at the first day fermentation. At the second, third, and sixth day, the pH was 6.2, 6.6, and 6.5 as a result 0.19%, 0.09%, 0.117% of Na2CO3 was added, respectively. In Tank 2, at the second, third, fourth, and fifth day, the pH was 5.9, 5.41, 6.6, and 6.12 therefore of 0.27%, 0.395%, 0.09%, and 0.21% of Na2CO3 was added, respectively. In Tank 3, 0.28%, 0.22%, 0.21%, 0.15% of Na2CO3 was added at second, third, fourth, and fifth days. In Tank 4, 0.18% of Na2CO3 was added at fourth day. In Tank 5, 0.1% of Na2CO3 was added at fourth day.
When the digester was initially heavily fed, acid forming bacteria quickly produced acids. The drop of pH was caused acid forming bacteria produce acetate, hydrogen gas, carbon dioxide, and few other VFA such as propionic and butyric acid. A low pH value inactivated microorganisms involved in the biogas production especially methanogenic bacteria (Vicenta et al., 1984).
In order to allow the methanogenic bacteria to grow, digester should be properly fed and buffered to rising alkalinity. In this study, Sodium carbonate (Na2CO3) was used to increase alkalinity or buffering capacity of fermenting slurry. It was added to the digester whenever the pH below 6.8.
liii c. Temperature from various feed compositions
Figure 5. Temperature from Various Feed Composition Performed in Anaerob Biodigester of 5 L Digestion Volume.
During 30 days of operation, the temperature ranges of 30.5-330C, 29.5-330C, 31-330C, 30-32.50C, and 30.5-32.50C were found in the digester 1, 2, 3, 4 and 5, respectively (Figure 5). At the initial retention time, the temperature was fluxtuative from 29.50C until 330C, but since the day thirteenth the temperature of mixtures stabilized. A slightly difference of temperature between the gelling feed and ungelling feed was occured but they still in the range of mesophilic temperature (29.5-330C).
As the temperature falls, microbial activity decreases and the biogas production decreases. As the temperature increases some microorganisms begin to die, once again the production of biogas decreases.
4.4.4 Semi-continuous Process
In semi-continuous experiment, 1% (w/v) of total solid of cassava starch effluent, 0.08% (w/v) of yeast, 10% (v/v) of ruminant bacteria, and 0.04% (w/v) of urea were mixed in the tank. According to Sitohang (2000), adding of fresh feed was conducted when biogas production achieve the maximum yield condition. In previous batch experiment, the maximum yield condition was occured at second days, consequently adding of fresh feed was conducted every two days with constant ammount of feeding (2 grams per two days). The aim of this feeding management was increasing of biogas production
Figure 6. Daily and Accumulation Biogas Production from Cassava starch Effluent using Yeast, Ruminant Bacteria, and Urea in Anaerob Biodigester of 5 L Digestion Volume.
liv
added on fifth day and the biogas production per day increased on sixth and seventh days. It was occurred because the yeast as substrate activator accelerates hydrolysis of substrates by microorganisms, then converts it into biogas. A significant increase in biogas production was occurred on the eighth day retention time (50.69 ml/g total solid/day), after the addition of cassava starch effluent and yeast. On the next day, the biogas production increased and decreased fluctuatively. Overall, a high biogas production was occurred during the early days (1-10 days). The biogas production normally increased after cassava starch effluent and yeast was added. But the addition of cassava starch effluent has been effect in increasing the biogas production after 3-4 days. A significant effect in increasing the biogas production was occurred after yeast was added every 5 days. The maximum of biogas production per day 50.69 ml/g total solid/day was obtained at eighth day retention times (Figure 6) and the total biogas production was 581.15 ml/g total solid.
The rising of biogas production was caused by fresh feed replace the fermented substrate. However, the increasing of feeding-value will increase biogas production until certain value, then biogas production was decrease exactly. It was based on substrate retention time in biodigester. More adding feeding-value, retention time in biodigester was shorter, consequently also shorter in reaction time because substrate was push out before the reaction complete.
b. pH and Temperature
Figure 7. pH and Temperature Performed in Anaerob Biodigester of 5 L Digestion Volume.
During 30 days of operation, the pH ranges of 5.52-7.06 was found (Figure 7). The initial drops in pH from 7.04 to 5.52 was observed at first day retention time. At that time, a low pH value inactivated microorganisms involved in the biogas production especially methanogenic bacteria (Vicenta et al., 1984), so adding of Na2CO3 (0.37%) was needed to raising alkalinity in order to keep microorganisms alive. On the second day, the pH stabilized at neutral pH. pH stability stayed awake until the 30-day because there were the addition of cassava starch effluent and yeast, so the activities of microorganisms remained stable.
Biogas production the simple anaerob semi-continuous digester volume of 5 L digestion volume was performed at ambient temperature (27-33 0C) for 30 days at mesophilic level. From Figure 7, there was maximum temperature for maximum biogas production: 300C for 50.69 ml biogas/g total solid/day.
4. Conclusions
Based on the discussion above, it can be concluded as follow:
h. Adding of microalgae as nitrogen source did not give significant effect to biogas production. But adding of yeast as substrate activator was very helpful to accelerate biogas production.
i. The biogas production increased after cassava starch effluent and yeast was added.
j. Biogas production from the ungelling and gelling mixture of cassava starch effluent, yeast, ruminant bacteria, and urea were 726.43 ml/g total solid and 198 ml/g total solid.
k. Biogas production from ungelling mixture without yeast was 58.6 ml/g total solid.
l. Biogas production from ungelling mixture added by microalgae without yeast was 58.72 ml/g total solid and that with yeast was 189 ml/g total solid l.
lv
n. Requirement of sodium carbonate (Na2CO3) to increase alkalinity or buffering capacity of fermenting solution depends on pH-value.
Acknowledgement
The writers are grateful to Dirjen Dikti Republik Indonesia for financial support via PKM, Dr. nat.techn. Siswo Sumardiono, ST, MT for his smart advices and stimulating discussions , Ir. Budiyono, M.Si, for his help and discussions during conducting this study, Mr. Untung for technical assistance, and Waste Treatment Laboratory of Chemical Engineering Department Diponegoro University for laboratory facility supports.
References
Anunputtikul, W., Rodtong, S., Investigation of The Potential Production of Biogas from Cassava Tuber, Abstracts of the 15th Annual Meeting of The Thai Society for Biotechnology and JSPS-NRCT Symposium, Thailand, 2004, p. 70.
Anunputtikul, W., Rodtong, S., Laboratory Scale Experiments for Biogas Production from Cassava Tubers, The Joint
International Conference on “Sustainable Energy and Environment (SEE)”, Hua Hin, Thailand, 2004.
Anunputtikul, W., Rodtong, S., Conversion of Raw Cassava Roots to Biogas, Thailand, 2004. BPS, Produksi Bahan-bahan Pangan Indonesia, 2009.
Malhotra, M.S., Poly Aluminium Chloride as An Alternative Coagulant, 20th WEDC Conference Colombo: Affordable Water Supply and Sanitation, Sri Lanka, 1994.
Milono, P., Lindajati T. and Aman S., Biogas Production from Agricultural Organics Residues, In The First ASEAN Seminar Workshop on Biogas Technology, Working Group on Food Waste Material (pp. 52-65), Manila, Philipines: ASEAN Committee on Science and Technology, 1981. Quoted in Anunputtikul, W., Rodtong, S., Biogas Production from Cassava Tubers, Thailand, 2004.
Sitohang, Tongam J. L. dan Ihwan U. F., Evaluasi Parameter-Parameter yang Mempengaruhi Produksi Biogas pada Bioreaktor Anaerobik, TK-470 Penelitian, Institut Teknologi Bandung, 2000.
Vicenta, M. Pacheco G. Alamis M. L. A., Anglo P. G., tan B. V. and Silverio C. M., A Study of Some Factors Affecting Biogas Production from Pineapple Peelings, In Bidin R., Chong C. N. and Wang C. W. (eds), Proceeding of the Second ASEAN Workshop on Biogas Technology Applied in the Management and Utilization of Food Waste Materials (pp. 189-202), Kuala Terengganu, Malaysia, 1984. Quoted in Anunputtikul, W., Rodtong, S., Biogas Production from Cassava Tubers, Thailand, 2004.