This ar t icle was dow nloaded by: [ Univer sit as Dian Nuswant or o] , [ Rir ih Dian Prat iw i SE Msi] On: 29 Sept em ber 2013, At : 20: 31
Publisher : Rout ledge
I nfor m a Lt d Regist er ed in England and Wales Regist er ed Num ber : 1072954 Regist er ed office: Mor t im er House, 37- 41 Mor t im er St r eet , London W1T 3JH, UK
Accounting and Business Research
Publ icat ion det ail s, incl uding inst ruct ions f or aut hors and subscript ion inf ormat ion: ht t p: / / www. t andf onl ine. com/ l oi/ rabr20
Determinants of intellectual capital disclosure in
prospectuses of initial public offerings
Inderpal Singh a & J–L W. Mit chel l Van der Zahn a a
School of Account ing, Curt in Universit y of Technol ogy, GPO Box U1987, Pert h, 6845, Aust ral ia Phone: +61 8 9266 7771 Fax: +61 8 9266 7771 E-mail :
Publ ished onl ine: 06 Jan 2011.
To cite this article: Inderpal Singh & J–L W. Mit chel l Van der Zahn (2008) Det erminant s of int el l ect ual capit al discl osure in prospect uses of init ial publ ic of f erings, Account ing and Business Research, 38: 5, 409-431, DOI: 10. 1080/ 00014788. 2008. 9665774
To link to this article: ht t p: / / dx. doi. org/ 10. 1080/ 00014788. 2008. 9665774
PLEASE SCROLL DOWN FOR ARTI CLE
Taylor & Francis m akes ever y effor t t o ensur e t he accuracy of all t he infor m at ion ( t he “ Cont ent ” ) cont ained in t he publicat ions on our plat for m . How ever, Taylor & Francis, our agent s, and our licensor s m ake no
r epr esent at ions or war rant ies w hat soever as t o t he accuracy, com plet eness, or suit abilit y for any pur pose of t he Cont ent . Any opinions and view s expr essed in t his publicat ion ar e t he opinions and view s of t he aut hor s, and ar e not t he view s of or endor sed by Taylor & Francis. The accuracy of t he Cont ent should not be r elied upon and should be independent ly ver ified w it h pr im ar y sour ces of infor m at ion. Taylor and Francis shall not be liable for any losses, act ions, claim s, pr oceedings, dem ands, cost s, expenses, dam ages, and ot her liabilit ies w hat soever or how soever caused ar ising dir ect ly or indir ect ly in connect ion w it h, in r elat ion t o or ar ising out of t he use of t he Cont ent .
This ar t icle m ay be used for r esear ch, t eaching, and pr ivat e st udy pur poses. Any subst ant ial or syst em at ic r epr oduct ion, r edist r ibut ion, r eselling, loan, sub- licensing, syst em at ic supply, or dist r ibut ion in any
1. Introduction
Business dynamics of the 21st century are increas-ingly determined and driven by intellectual capi-tal/knowledge-based elements. Numerous corporate executives, practitioners and business professionals, policymakers and scholars alike ac-knowledge factors of production, products and services, and market place dynamics will be radi-cally different than previously. The coming centu-ry will by necessity be an integrated and technologically networked global economy,
re-casting comparative advantages and discriminat-ing pricdiscriminat-ing for goods and services. In the future business and economic landscape, raw materials and their processing will decline in value whilst that of intellectual capital resources will increase. This clearly calls for a refreshed – if not alternative – understanding of business principles, informa-tion reporting and decision-making processes.
Market participants, practitioners and regulators alike argue there is an important need for greater investigation and understanding of intellectual capital disclosure as the usefulness of financial in-formation in explaining firm profitability contin-ues to deteriorate (Lev and Zarowin, 1999). Bukh (2003), for example, asserts that traditional report-ing mechanisms are not able to cope adequately with the reporting requirements of new economy firms. Bozzolan et al. (2003), meanwhile, observe an increasing dissatisfaction with traditional finan-cial reporting and its ability to convey to investors the wealth creation potential of firms.
Despite growing interest and demand for intel-lectual capital information, prior research (e.g. Williams, 2001; Beaulieu, et al., 2002; Garcia-Meca et al., 2005) suggests a persistent and signif-icant variation in the quantity and quality of information reported by firms on this pivotal re-source. As existing economic and business metrics track a declining proportion of the real economy, the deficiency and inconsistency in the reporting of intellectual capital-related information is
creat-Determinants of intellectual capital
disclosure in prospectuses of initial public
offerings
Inderpal Singh and J-L. W. Mitchell Van der Zahn*
Abstract—Intellectual capital is recognised as the new economic era’s pivotal factor underlying value creation. Deficient and inconsistent intellectual capital reporting is escalating information asymmetry between informed and uninformed investors. This provides fertile ground for informed investors to extract higher abnormal returns and higher wealth transfers from uninformed investors, particularly during a firm’s initial public offering (IPO). This study investigates the association between intellectual capital disclosure levels in prospectuses of 444 IPOs listing on the Singapore Stock Exchange between 1997 and 2006, and three potential explanatory determinants: (1) own-ership retention; (2) proprietary costs; and (3) corporate governance structure.
Statistical analysis supports our conjecture of a positive association between intellectual capital disclosure and ownership retention. We also find, consistent with expectations, a negative influence of proprietary costs on the positive intellectual capital disclosure – ownership retention association. However, contrary to predictions, we do not find an IPO’s corporate governance structure significantly influences the negative interaction of proprietary costs on the ownership retention – proprietary cost association. Our findings have implications for various parties such as regulators who may impose unnecessary costs on issuers if they introduce mandatory disclosures whilst lacking an understanding of the factors influencing intellectual capital disclosures.
Keywords: intellectual capital; disclosure; determinants; Singapore; initial public offerings
*Inderpal Singh is a lecturer and J-L. W. Mitchell Van der Zahn is a professor at the School of Accounting, Curtin University of Technology in Perth, Western Australia.
The authors wish to thank two anonymous reviewers for their helpful comments. They also thank various participants at the CBS Doctoral Colloquium (August 2007, Perth, Western Australia), 18th Asian-Pacific Conference on International Accounting Issues (October 2006, Maui, USA), 29th European Accounting Association Annual Congress (April 2007, Lisbon, Portugal) and the American Accounting Association Annual Conference (August 2007, Chicago, USA) where earlier versions of the paper were presented for their valuable comments, views and feedback. The authors are also indebted to the valuable comments of Greg Tower, Alistair Brown, P.N. Bukh, James Guthrie, Nick Bontis, Tony Kang, Phil Beaulieu, Michael Wright and Manfred Bornemann. They also express their thanks to faculty of the School of Accounting for their feedback regarding this paper. Correspondence should be addressed to: Inderpal Singh, Lecturer, School of Accounting, Curtin University of Technology, GPO Box U1987, Perth, Western Australia, 6845. Tel: +61 8 9266 7771; Fax: +61 8 9266 7196; E-mail: [email protected].
ing growing information asymmetry between in-formed and uninin-formed investors (Eustace, 2000; Gröjer, 2001; Walker, 2006). This provides fertile ground for informed investors to extract higher ab-normal returns.
Opportunities for informed investors to extract higher wealth transfers from uninformed investors are particularly ripe when information asymmetry is naturally high such as a firm’s initial public of-fering (IPO). Liberalisation of financial capital movement, in conjunction with financial market integration, provided an enriched sustainable envi-ronment during the past decade for the intensive expansion of numerous capital markets world-wide. A growing proportion of IPOs listing during this period – and with numbers projected to in-crease in the future – are intellectual capital inten-sive firms. Greater listing of firms particularly prone to information asymmetry concerns pro-vides an additional incentive to understanding in-tellectual capital disclosure practices of IPOs.
Despite the increasingly significant role to today’s firms, and intensive information asymme-try concerns (particularly within an IPO setting), very few studies have addressed the issue of intel-lectual disclosure practices by listing firms. Our study addresses this important void in the account-ing, finance and intellectual capital literatures. Drawing on signalling theory, we identify and ex-amine three potential determinants that may pro-mote or constrain voluntary intellectual capital disclosure in IPO prospectuses. The three specific determinants investigated are: (1) ownership re-tention; (2) proprietary costs; and (3) corporate governance structure.
Past IPO literature suggests ownership retention (Leland and Pyle, 1977) is a signal of firm quality. We extend this notion postulating ownership reten-tion is a complementary signal to intellectual capi-tal disclosure. Verrecchia (1983) suggests firms faced with high proprietary costs are likely to limit voluntary disclosure. Based on this contention, it is our conjecture the intellectual capital disclosure– ownership retention association will be suppressed by the extent of proprietary costs faced by an IPO. Previous researchers suggest corporate governance structure can reduce a firm’s cost of capital (e.g. Certo et al., 2001). Consequently, our final conjec-ture is that stronger corporate governance strucconjec-tures mitigate negative influences of higher proprietary costs on the association between intellectual capital disclosure levels and ownership retention.
Singapore is a vibrant environment for investi-gating issues related to intellectual capital and IPOs. First, with a very small land mass, Singapore’s rapid economic growth is primarily driven by de-velopment of key intellectual capital resources. Second, Singapore is ranked one of the world’s most business-friendly economies (World Bank,
2007). Also, Singapore has a well-established cor-porate law and governance system (Political and Economic Risk Consultancy (PERC), 2006; The Fraster Institute, 2007).1Similarities with
regulato-ry practices in major capital markets will enable re-sults from our study to be generalised more broadly. For example, the corporate regulatory sys-tem in Singapore was adapted from the British and still bears close resemblance today. Also, the legal and governance framework is highly aligned with the Commonwealth model such that Singapore is recognised as a corporate governance leader in Asia (Mak and Chng, 2000).2Accounting standards
in Singapore have long been highly consistent with IAS/IFRS requirements with accounting practices regulated by professional institutions (e.g. Institute of Certified Public Accountant of Singapore (ICPAS); Stock Exchange of Singapore (SGX)) and government bodies (e.g. Accounting Standards Council (ASC)) (ACGA, 2007). The auditing mar-ket in Singapore is dominated by Big Four ac-counting firms (Rusmin et al., 2006) whilst there are sophisticated intermediaries such as security analysts, credit rating agencies and investors acting as market monitors (Mak and Chng, 2000). Finally, Singapore’s capital and IPO markets are mature, highly active and internationalised.3 Comprising
two primary boards (SGX Main Board and SGX SESDAQ)4the SGX has grown significantly since
the late-1990s with the number of firms listed by the end of 2006 having more than doubled (nearly three times) since the start of 1997 (SGX Factbook, 2006).
Statistical analysis is based on a sample of 444 IPOs listing on the Singapore Stock Exchange (SGX)5between 1 January 1997 and 31 December
1Singapore’s corporate governance system is perceived to be the highest in Asia whilst the legal system is also ranked number one in Asia for integrity and lack of corruption (La Porta et al., 1997, 1998; PERC, 2006).
2 Relative to other Asian nations (and many worldwide) Singapore has been a leader in developing corporate gover-nance practices. For example, since 1990 publicly listed firms in Singapore have been required to have established audit committees. In contrast, audit committees were not formally required in other Asian (and many developed economies like Australia) nations until the late 1990s.
3As of 31 December 2006, more than 20% of firms listed on the SGX were domiciled overseas (SGX Factbook, 2006). 4Firms wishing to list on the SGX Main Board are subject to higher initial pre-listing performance standards than coun-terparts listing on the SGX SESDAQ. In essence, the SGX SESDAQ was established to allow younger firms without a lengthier, positive financial performance history access to cap-ital market funding.
5The highly internationalised SGX is a pivotal capital mar-ket in Asia with listed firms having more than doubled since 1997. We focus on Singapore because the nation’s lack of nat-ural resources meaning profitability of Singapore firms is highly dependent upon the development and maintenance of intellectual capital resources. Consequently, intellectual capi-tal disclosure is important to Singapore firms and market par-ticipants in enabling better valuations.
2006. We find average intellectual capital disclo-sure levels in IPO prospectuses increased annually between 1997 and 2006. Statistical tests indicate a significant positive association between intellectu-al capitintellectu-al disclosure and ownership retention. Additionally, we find a negative influence of pro-prietary costs on the positive intellectual capital disclosure–ownership retention linkage. Contrary to expectations we do not find better corporate governance structures influence the ownership re-tention–proprietary cost–intellectual capital dis-closure interaction. Our findings have implications for various parties. For example, regulators may impose unnecessary costs on issuers if mandatory reporting is introduced without sufficient under-standing of factors influencing intellectual capital disclosure.
Our study contributes to various literatures (i.e. accounting, finance and intellectual capital) in two key aspects. First, our study considers potential de-terminants of intellectual capital disclosure most befitting of an IPO setting. Previous related work (e.g. Bukh et al., 2005a) generally concentrates on traditionally established disclosure determinants such as firm size, leverage or firm performance. Findings from our study help build an expanded profile of factors influencing intellectual capital disclosure. Second, we draw on the tenets of an es-tablished theoretical perspective to consider the underlying rationale motivating disclosure of in-tellectual capital-related information. This is con-trary to prior intellectual capital disclosure determinant research that usually lacks an underly-ing theoretical foundation to explain why factors selected influence intellectual capital disclosure practices. Application in our study of a specific theoretical perspective can provide a foundation for more constructive theorisation of intellectual capital disclosure practices in the future. Aside from the two major contributions noted we provide other important offerings. For example, our in-depth longitudinal study provides further evidence of growth in quantity of intellectual capital infor-mation disclosed during the past two decades. Furthermore, we report about intellectual capital disclosure practices for firms from a nation reliant on intellectual capital not previously examined; thereby, adding an additional piece to the global jigsaw map on intellectual capital disclosure prac-tices. Finally, whilst offering its own individuality Singapore’s regulatory and institutional environ-ment overlaps with regulations and requireenviron-ments observed in major international capital markets. This assists, therefore, in generalising findings from our study to other nations and regions.
The remainder of this paper is organised as fol-lows. The next section outlines the extant literature associated with voluntary disclosure and informa-tion asymmetry. This is followed in Secinforma-tion 3 with
the formal development of testable hypotheses. The research method is discussed in Section 4 with sample selection, descriptive and statistical results reported in Section 5. Discussion and conclusions are drawn in Section 6.
2. Literature review: voluntary disclosure
and information asymmetry
Prior research implies intellectual capital resource-rich firms exhibit more volatile market values and are subject to a higher degree of information asym-metry. Aboody and Lev (2000), for example, report that intangibles (an intellectual capital component) contribute positively to information asymmetry particularly amongst research and development (R&D) intensive firms. Consequently, informed investors achieve abnormal returns (Aboody and Lev, 2000). Amihud and Mendelson (1986) and Lev (2001) also attribute widening bid-ask spreads to information asymmetry. To compensate, in-vestors require higher returns thus driving up the cost of capital.
With respect to intellectual capital Van der Meer-Kooistra and Zijlstra (2001) report that a lack of disclosure related to this pivotal resource increases investors’ risk perception. They (Van der Meer-Kooistra and Zijlstra, 2001: 457) argue ‘a lack of information about investments in intellec-tual capital could lead to an underestimation of fu-ture earnings’ and, thereby, increases the cost of capital. Chan et al. (2001) provide similar findings regarding R&D arguing that lack of disclosure in-creases the degree of uncertainty (or perceived risk) for R&D intensive firms. Consequently, re-turn volatility intensifies with greater R&D expen-ditures that are supported by low disclosures. Again, higher cost of capital results. Chan et al., 2001: 2454 argue ‘even if market prices on aver-age incorporate the future benefits from R&D, the lack of accounting information on such an impor-tant intangible asset may impose real costs on in-vestors through increased volatility.’
To reduce investors’ perceived risk and firm value volatility, various studies (e.g. Diamond and Verrecchia, 1991; Elliot and Jacobson, 1994; Coles et al., 1995; Botosan, 1997, 2006; Sengupta, 1998) suggest greater disclosure decreases the required return by investors. Diamond and Verrecchia (1991) and Zhang (2001) develop theoretical mod-els demonstrating the relations between voluntary disclosure and a firm’s cost of capital. Diamond and Verrecchia (1991) conclude increased volun-tary disclosure results in a reduction in the infor-mation asymmetry component of the cost of capital. Information asymmetry arises as a result of the market participants having different levels of information. Zhang (2001), meanwhile, posits private information production by investors leads to a widening information gap between informed
and uninformed investors, resulting in increased cost of capital. Firms can reduce this information asymmetry and, thereby, lower their cost of capital by increasing the level of voluntary disclosure.
Consistent with these views, Lev (1992) also as-serts that the existence of a permanent information gap between outsiders and insiders creates the need for a systematic disclosure strategy by firms. Similarly, Leuz and Verrecchia (2000) explored the notion that a firm’s commitment to greater dis-closure should lower the information asymmetry component of the firm’s cost of capital. Leuz and Verrecchia (2000) contend that to overcome the re-luctance of potential investors to hold firm shares in illiquid markets, firms must issue capital at a discount leading to fewer proceeds to the firm and, thus, higher cost of capital. Empirical results from Botosan (2000) support this view. Botosan (2000) found the cost of equity capital decreased with in-creases in the level of two categories of informa-tion: forward looking information (forecasts of sales, profits and capital expenditure) and key non-financial statistics (order backlogs, market share and growth in units sold). An important implica-tion of Botosan (2000), therefore, is there is room for improvement in the voluntary disclosure by all firms, especially in the forward looking and non-financial categories.
Healy and Palepu (1993) argue corporate man-agers issuing equity (or acquiring another compa-ny) would consider it important for investors to have a favourable perception of the issuer (or ac-quirer). Myers and Majluf (1984) point out that entrepreneurs seeking external financing have in-centives to make voluntary disclosure to mitigate information asymmetry problems. Empirical evi-dence of analysts’ ratings of disclosure supports the view that firms issuing securities provide greater disclosures (Lang and Lundholm, 1993). In later work, Lang and Lundholm (1997) document a significant increase in disclosure beginning six months prior to the issue of equity, particularly for items over which management has greater discre-tion. Healy and Palepu (1993) also suggest managers can improve investor communication by developing disclosure strategies that help in-vestors understand managers’ business objectives. Voluntary disclosures could include articulation of the firm’s long-term strategy, specification of non-financial leading indicators useful in judging the effectiveness of the strategy implementation, dis-cussion of the leading indicators and outlines of present and future joint ventures, strategic al-liances and partnerships.6
In the IPO context Leland and Pyle (1977) es-tablish a simple model of capital structure and fi-nancial equilibrium in which entrepreneurs seek financing of projects whose true characteristics are known only to them. Allen and Faulhaber (1989) assert that an important issue in signalling models is whether the signal being examined would be used if the firm had a wider choice of available signals. IPOs can signal their quality with several variables other than price such as underwriter choice (Booth and Smith, 1986) and auditor (Titman and Trueman, 1986). Allen and Faulhaber (1989) argue price is likely to be just one of sever-al signsever-als used to convey information. Ownership retention is frequently cited as a prime signal of an IPO’s quality (Jog and McConomy, 2003). Gonedes (1978), for example, argues IPO man-agers will use their ownership retention as a signal to complement voluntary disclosures (such as that related to intellectual capital) made in the prospec-tus. By retaining a higher ownership percentage post-listing, pre-IPO owners signal to investors the firm’s quality by accepting greater risk rather that diversifying their interests by retaining less inter-est in a single entity.
Whilst there appears a general consensus that voluntary disclosure benefits firms accessing cap-ital markets, there are disincentives for managers to make full disclosure. This is because such dis-closure would contain proprietary information that would undermine the firm’s competitive position (Dye, 1986; Verrecchia, 1983). Empirical studies of the impact of proprietary costs suggest disclo-sure is hampered by proprietary costs. Scott (1994) carried out an empirical investigation of the pro-prietary cost implications of defined benefit pen-sion plan (DBPP) disclosures in Canada. He (Scott, 1994) found a significant negative associa-tion between the probability of a firm disclosing pension plan information and the potential propri-etary costs attached to its labour relations. The larger the proprietary cost, the greater the decrease in firm value, and the greater the incentive not to disclose. Guo et al. (2004) examine the impact of various competitive costs on the extent of product-related information disclosed by biotech IPOs in prospectuses. They (Guo et al., 2004) find biotech firms operate in a highly competitive environment and, therefore, are reluctant to disclose product-re-lated information with high proprietary costs.
An entity’s corporate governance structure may mitigate the disincentive to voluntarily disclose key information with high proprietary costs. Stronger corporate governance mechanisms are thought to lower the cost of equity by reducing the cost of external monitoring by outside in-vestors. Lombardo and Pagano (2002), for exam-ple, postulate that investors need to incur external monitoring costs to ensure a given pay-off from 6Disclosure on issues such as present and future joint
ven-tures, strategic alliance and partnerships or a firm’s long-term strategy are representative of disclosures that would fall with-in the scope of with-intellectual capital.
management. Additional monitoring costs are compensated by a higher required rate of return. External investors are likely to demand a lower re-quired rate of return from firms with better corpo-rate governance. This is because they can spend less time and resources on monitoring the manage-ment. Corporate governance can also reduce the cost of equity by limiting opportunistic insider trading, thereby, reducing information asymmetry. Battacharya and Daouk (2002), for example, find the cost of equity in a country decreases signifi-cantly after the first prosecution under insider trad-ing laws. If corporate governance mechanisms reduce the cost of capital then this provides greater scope for firms to voluntarily disclose more infor-mation even in light of high proprietary costs. Recent evidence from the UK suggests that stronger corporate governance structures are asso-ciated with increased intellectual capital disclosure (Li et al., 2008).
3. Hypothesis development
The bulk of early empirical studies examined in-tellectual capital disclosure in the context of annu-al reports (Guthrie and Petty, 2000; Brennan, 2001; Beaulieu et al., 2002) with some more recent work undertaking comparative analysis across in-ternational boundaries (Bozzolan et al., 2006; Vergauwen and van Alem, 2005). Only a few stud-ies have considered intellectual capital disclosure in IPO prospectuses (Guo et al., 2004; Bukh et al., 2005a). Bukh (2003: 51–52) states ‘the prospectus indicates which type of information is selected by a company and its advisers for the best possible vi-sualisation of the company’s value creation poten-tial in relation to investors and analysts because the prospectus intends to prove continued growth and increased shareholder wealth’. Bukh (2003) concludes that the inclusion of information on in-tellectual capital in prospectuses is an indication that companies and their advisers believe this type of information is important in the capital market’s assessment of the value of the company.
Consistent with prior research (e.g. Diamond and Verrecchia, 1991; Botosan, 1997, 2006; Sengupta, 1998) it is our general contention that voluntary disclosure of intellectual capital infor-mation will reduce a firm’s cost of capital. As per Section 2 discussion, we contend that within an IPO setting, the extent of intellectual capital dis-closure depends upon signalling mechanisms, pro-prietary costs and the firm’s corporate governance structure. Specifically, we propose since intellec-tual capital disclosures are not as easily interpret-ed by investors (given the lack of a recognisinterpret-ed reporting framework), management must incur costly signals such as higher fractional ownership post-listing to complement direct disclosure sig-nals (Hughes, 1986). Firms entering highly
com-petitive industries, however, may elect to restrict voluntary disclosures (Darrough and Stoughton, 1990), particularly those associated with intellec-tual capital (Guo et al., 2004), even with high levels of ownership retention. Finally, strong cor-porate governance structures may override high proprietary costs negative influence associated with disclosure (such as intellectual capital infor-mation) leading to increased reporting (La Porta et al., 1997; 1998).
Formal hypotheses to test our general conjecture of ownership retention, proprietary costs and cor-porate governance structure influences are devel-oped in the following sub-sections.
3.1. Ownership retention
Certo et al. (2001) argue two central tenets of signalling theory are: (1) a signal must be observ-able and known prior to the IPO; and (2) the signal must be more costly for lower quality IPO firms to mimic. We take the perspective that the proportion of shares retained by the original owners is a sig-nal observable in the prospectus document and one lower quality firms find costly to imitate. Specifically, owners of low quality firms would want to diversify as much personal risk as possible by attempting to sell as many of their IPO shares as possible (Downes and Heinkel, 1982).
Leland and Pyle (1977) developed an equilibri-um signalling model which predicts the behaviour of the entrepreneur faced with information asym-metry. In Leland and Pyle’s (1977) model, it is im-plied that the entrepreneur’s willingness to invest in his own project signals to the market that the project is of good quality. It is costly for the entre-preneur to retain a significant ownership stake in the firm as this action would preclude the entre-preneur from diversifying his personal investment portfolio. Therefore, the entrepreneur will only re-tain a significant ownership interest if expected fu-ture cash flows are higher relative to the current firm value (Leland and Pyle, 1977). Rational in-vestors observe fractional ownership retained as a signal of firm value.
Firth and Liau-Tan (1998) argue that entrepre-neurs disclose information that signals their pri-vate knowledge of the firm in order to add credibility to the basic valuation parameters con-tained in the prospectus (information on assets, historical profitability, economic prospects, invest-ment plans, etc.). Firth and Liau-Tan (1998) also found that fractional ownership of the firm by the original pre-issue shareholders is a major sig-nalling mechanism. Their (Firth and Liau-Tan, 1998) findings indicate the level of ownership re-tained by pre-IPO owners is used as a complemen-tary signal. Research on intellectual capital disclosure determinants is scarce. Similarly, re-search on intellectual capital underpinned by
nalling theory is virtually non-existent. Bukh et al. (2005a) is one exception reporting that the extent of managerial ownership prior to the IPO is signif-icantly associated with the level of intellectual capital disclosure. Firms where management had an ownership interest upon listing disclosed more intellectual capital information (Bukh et al., 2005a).
Overall, the IPO literature implies ownership re-tention is a key signal to the market of a firm’s quality. A good quality IPO, however, is likely to use multiple signals such as greater voluntary dis-closure to entice investors to view it favourably (Jog and McConomy, 2003). Based on this prem-ise, good quality IPOs (proxied by higher levels of ownership retention) and specifically their direc-tors are more likely to provide greater disclosure to substantiate the value of the IPO. Therefore the following hypothesis is proposed:
H1 There is a positive association between the extent of intellectual capital disclosure and the level of ownership retention at the IPO. 3.2. Proprietary costs
Proprietary information is ‘information whose disclosure reduces the present value of cash flows of the firm endowed with the information’ (Dye 1986: 331). For this study, proprietary costs are viewed as a moderating variable given the highly proprietary nature of intellectual capital disclo-sure. That is, the impact of ownership retention on the level of intellectual capital disclosure will be moderated (negative direction) by the existence of proprietary costs for the IPO firm.
Theoretical models developed by Verrecchia (1983) suggest the threshold level of disclosure in-creases as the proprietary costs increase. Verrecchia (1983) suggests the nature of competi-tion is pertinent in determining the level of disclo-sure. For example, product market competition may provide disincentives for voluntary disclosure (Guo et al., 2004). Further, Darrough and Stoughton (1990) assert that while voluntary infor-mation aids the capital market in evaluating the firm’s value more accurately, such disclosure could compromise the firm’s competitive position by revealing strategic information to potential competitors.
Beaulieu et al. (2002) find a positive relationship between the size of Swedish publicly listed firms and the total amount of intellectual capital
provid-ed in their respective annual reports. It is speculat-ed that the lack of disclosure amongst smaller firms on intellectual capital matters could be due to threats of competitive disadvantage (Beaulieu et al., 2002). Williams (2001), meanwhile, finds that when intellectual capital performance7is too high,
disclosure is reduced. The negative association supports the notion that firms reduce intellectual capital disclosures when performance reaches key threshold levels for fear of eroding competitive ad-vantages (Williams, 2001). A recent study of biotech IPOs by Guo et al. (2004) investigates the impact of several competitive cost proxies on the extent of product-related information disclosed. Results indicate disclosure levels are significantly higher for firms with patent protection for their products compared to firms with no patent protec-tion. Similar results are yielded for the other vari-ables such as product development stage and venture capital backing (Guo et al., 2004).
Given the proprietary nature of intellectual capi-tal information and the implications of prior studies, it is expected that firms with higher pro-prietary costs will result in a weakening of the pos-itive association between ownership retention and the level of intellectual capital disclosure. This leads to the second hypothesis:
H2 The positive association between the extent of intellectual capital disclosure and the level of ownership retention will be weaker for firms with higher levels of proprietary costs. 3.3. Corporate governance structure
Prominent work by La Porta et al. (1997, 1998) highlights the potential association between corpo-rate governance and disclosure patterns. Recent studies suggest board independence is a specific feature of corporate governance that affects corpo-rate disclosures. Using data from Singapore, Eng and Mak (2003) hypothesised a positive associa-tion between the proporassocia-tion of outside directors and the level of voluntary disclosure. Chen and Jaggi (2000) find comprehensive disclosures are positively related to the proportion of independent non-executive directors on corporate boards. Li et al. (2008) find a positive association between the proportion of independent directors and intellectu-al capitintellectu-al disclosure in the UK. These results sug-gest external directors play a complementary role to disclosure.
Gompers (1995) argues that in the presence of information asymmetry which is prevalent for start-up firms, an independent board structure is essential for effective monitoring. As a minimum the independent board may signal the presence of an effective monitoring mechanism, thereby, en-hancing firm value (Certo et al., 2001). Fama and Jensen (1983) posit a board comprised mainly of outside directors may promote the implementation 7Intellectual capital performance is the increase or decline
across a period of time in a firm’s (a) wealth, (b) efficient out-put of physical assets; (c) competitive advantage; and (d) value of other types of capital that results from the activities and actions undertaken by corporate management to efficient-ly utilise, manage and develop the firm’s intellectual capital resources (Williams, 2001).
of effective controls over reporting. Gul and Leung (2004), meanwhile, examined the linkages between board leadership structure in terms of CEO duality (CEO who jointly serves as board chair), the proportion of expert outside directors on the board and voluntary corporate disclosures. They (Gul and Leung, 2004) find CEO duality is associated with lower levels of voluntary corpo-rate disclosures. However, the negative CEO dual-ity/voluntary disclosure association is weaker for firms with a higher proportion of expert outside di-rectors on the board.
Based on the above discussion this study postu-lates that sound corporate governance features (such as board independence) negate the weaken-ing effects of proprietary costs on the level of in-tellectual capital disclosure in IPO prospectuses. This leads to the third and final hypothesis:
H3 The interaction effect of proprietary costs on the association between the extent of the in-tellectual capital disclosure and ownership retention will be weaker for firms with a stronger corporate governance structure.
4. Research method
This section outlines the proxy measures for the dependent, independent and control variables, and defines the main statistical model used to test the hypotheses.
4.1. Dependent variable metric
Prior research examining disclosure typically rely on either a: (1) researcher constructed disclo-sure index (e.g. Botosan, 1997; Guo et al., 2004); or (2) publicly available disclosure quality indica-tor (e.g. Lang and Lundholm, 1993, 1997; Sengupta, 1998). No public intellectual capital dis-closure indicator is presently available; thus, we construct our own index. Initial selection of intel-lectual capital disclosure items is based on three prior indices (Williams, 2001; Beaulieu et al., 2002; Bukh et al., 2005a) previously used to meas-ure intellectual capital disclosmeas-ure in either annual reports or IPO prospectuses (Bukh et al., 2005a). All three indices were reviewed to determine over-lapping items. A composite disclosure index com-prising 89 items is formed. A further eight items (not contained in any of the three noted indices) is added after further consideration of the Singapore business environment and recent developments in intellectual capital research and practice. All 97 items are then comprehensively scrutinised for rel-evance and suitability to the study’s objectives. Scrutiny involved discussions between the re-searchers, intellectual capital scholars and practi-tioners, corporate executives and accounting practitioners. From this extensive review 16 items were excluded. This left a final disclosure index
comprising 81 items covering six major cate-gories: (1) human resources; (2) customers; (3) in-formation technology; (4) processes; (5) R&D; and (6) strategic statements. The full index is pre-sented in Appendix A.
To minimise scoring subjectivity we use an un-weighted8dichotomous scale (one (1) if item
dis-closed, otherwise zero (0)) to score each item.9An
IPO’s intellectual capital disclosure (ICDiscj) level
is defined as the ratio of items disclosed in the prospectus of IPO j to the total number disclosure items applicable to IPO j. The ratio, as a percent-age, is arithmetically defined as:
Where:
DItemi = IC disclosure index item disclosed by IPOjin its prospectus;
ADItemi = IC disclosure index item applicable to IPOj;
i = IC disclosure index item; and
j = IPO firm.
4.2. Independent and moderating variables metrics
4.2.1. Ownership retention
Consistent with the IPO literature we define ownership retention (denoted αj) as the percentage
of outstanding common shares retained by pre -IPO shareholders to total shares outstanding after the IPO (e.g. Clarkson et al., 1992; Firth and Liau-Tan, 1998). For purposes of the regression analy-sis a transformation based on the natural logarithm
8An unweighted or weighted scoring approach can be used for scoring. Prior research (Cooke, 1989; Marston and Shrives, 1991; Ho and Williams, 2003) reports either approach typically yields similar results.
9Various steps were taken to ensure consistency in scoring of intellectual capital disclosure in each prospectus examined. For example, before commencing scoring of all the prospec-tuses a random sample of 20 were scored by each author. Scores were then compared and any discrepancies noted. The authors then discussed any major discrepancies to resolve any noted differences in scoring. The review of coding and dis-cussion of discrepancies was concluded again once all prospectuses had been coded by both authors. An additional check for consistent scoring by the authors involved the use of several independent coders throughout the coding process. That is, an independent coder was given a randomly selected sample of prospectuses (completed by the authors) for coding. Results of the coding by the independent coder were then compared to the two authors for any major discrepancies. Results of coding by the independent coders did not yield any major differences with results developed by the two authors. Independent coders included accounting professionals, in-vestors familiar with IPO prospectuses and academic scholars.
of αjis performed. The transformation defined by
the equation αj+ Ln(1 – αj) is based on the
ap-proach of Downes and Heinkel (1982) and consis-tent with the technique as used by and defined by Jog and McConomy (2003). The transformation is performed to reduce any anomalies in the distribu-tion of ownership retendistribu-tion. The post-transforma-tion proxy values are denoted as EDORj.
4.2.2. Proprietary costs
Competitiveness in a given industry has been ap-plied as a proxy for the proprietary costs faced by a firm in prior literature (e.g. Verrecchia, 1983; Berger and Hann, 2007).10Consistent with this
lit-erature we use a Herfindahl Index as the proxy measure for proprietary costs as defined by the fol-lowing technique:
Where:
HerfIndConj = measure of the industry
concen-tration of the industryl to which
firmjis entering.
MarketSharej = Market share of firmj within
in-dustrylto which it is entering.
Salesj = Sales of firmj for year
immedi-ately prior to its IPO as reported in the IPO prospectus.
Saleskl = Sales as reported in the annual
report of firmk in industryl for
year immediately prior to the IPO of firmjentering industryl. N = number of firms in industryl.
4.2.3. Corporate governance structure
For this study, a composite measure of corporate governance (defined as CGScorej) is developed
such that IPOjis given a score of one (1) (other-wise zero (0)) for each of the following conditions in the corporate governance structure met at the time of listing: (a) number of independent direc-tors on the board of direcdirec-tors at time of IPO ex-ceeds the mandatory minimum; (b) the same individual does not occupy the roles of chairman of the board and chief executive officer; and (c) the chairman of the board of directors is a non-executive director independent of management. The CGScorej value for IPOj, therefore, ranges from 0–3.
4.3. Control variables
To formally test if intellectual capital disclosures assist investors in determining the value of an IPO
beyond typical and complementary disclosures, and other signalling methods available to issuers we include a number of control variables into the analysis. Firth and Liau-Tan (1998) report a sig-nificant association between underpricing and an issuer’s selection of an auditor. A higher quality IPO signals key information to market participants about the IPO’s value by engaging an auditor with high reputation capital (Firth and Liau-Tan, 1998). Chen and Mohan (2002) put forward a similar ar-gument for underwriter prestige. To control for the possible compounding signalling effects of auditor reputation we include a control variable denoted Audj. Following prior research (e.g. Firth and
Liau-Tan, 1998; Jog and McConomy, 2003) IPO j is scored one (1) if engaging a Big Four11 audit
firm at the time of listing; otherwise IPO j is scored zero (0).
We also control for underwriter prestige consis-tent with past IPO research (e.g. Chen and Mohan, 2002). Without any defined ranking of underwrit-ers in Singapore and some data availability issues we are not able to measure underwriter prestige using many of the techniques applied using data from the US. Nonetheless, we use a modified ap-proach of Johnson and Miller (1988) and Megginson and Weiss (1991). Specifically, the prestige (Prek,i) of underwriter kin year iis
meas-ured as the ratio of the number of IPOs
underwrit-10Several approaches have been applied in the literature to measure proprietary costs. Whilst the main results reported in this study focus on industry competitiveness (as measured by the Herfindahl Index) we did consider alternative proxies for proprietary costs. For example, we also used (a) the level of research and development and (b) the number of copyrights and patents. Tests using the alternative measures yield results consistent with those using the Herfindahl Index though it is noted the significance of the association between proprietary costs and level of intellectual capital disclosure is slightly stronger for the alternative measures. However, due to con-cerns with consistency of data to measure the amount of R&D, and the number of copyrights and patents the authors elected to use (and report main finding) the more conservative Herfindahl Index due to greater confidence in the consistency of the data used in the measure.
11The term Big Four is not entirely applicable across the full observation period. In 1997 and 1998 it was widely recognised that the audit market worldwide was dominated by six major audit firms (dubbed the Big Six). At the start of 1999 two of the Big Six (Coopers and Lybrand and Price Waterhouse) had merged to form PriceWaterhouseCoopers (or PWC). For IPOs listing in 1997 and 1998 that engaged one of the Big Six firms as the external auditor were scored one (1); otherwise zero (0). In 2002 the Big Five became the Big Four after the demise of Arthur Andersen. Thus, for our study IPOs listing in 1999 to 2001 are scored one (1) if the IPO j engages an audit firm comprising the Big Five; other-wise IPO j is scored zero (0). From 2002 onwards the Big Four classification is used such that if the IPO j engages an audit firm comprising the Big Five; otherwise IPO j is scored zero (0). Whilst the term Big Four is not applicable for the en-tire period we solely use the phrase Big Four in the main text to avoid confusion.
ten by underwriter kin year ito the total number of IPOs in year i. Underwriters with higher Prek
ra-tios in year ihave higher levels of prestige capital at stake in year irelative to other underwriters and will seek to reduce underpricing (Jog and McConomy, 2003). For the control variable Undja score of one (1) is assigned to IPO jlisting in year i if the underwriter kused by IPO jis one of two underwriters with the highest Prekratios in year i. All other IPOs are scored zero (0).
Prior research indicates litigation risk may influ-ence underpricing (Hughes and Thakor, 1992; Keloharju, 1993). Whilst litigation risk in Singapore is low, legal issues related to an IPO re-main highly complex. To signal to the market in-formation about the IPO’s commitment to avoiding legal disruptions (during and after list-ing), promoters of a high quality IPO may be in-clined to engage solicitors that are highly conversant in the IPO process. For their part, so-licitors routinely dealing in IPO matters have an incentive to deal predominantly with high quality firms to protect their reputation capital as leading legal advisors on IPO issues. There is no definitive method to measure solicitor reputation. Hence, for this study we apply the approach as for under-writer prestige in following Johnson and Miller (1988) and Megginson and Weiss (1991). That is, the reputation (Repk,i) of solicitor firm kin year i is
measured as the ratio of the number of IPOs un-dertaken by solicitor firm k as the lead solicitor firm in year ito the total number of IPOs in year i. Solicitor firms with higher Repkratios in year i will have higher levels of reputation capital at stake in year i and will seek to reduce underpricing. For the control variable Solja score of one (1) is assigned to IPO j listing in year i if the solicitor firm k used is one of two solicitor firms with the highest Repk ratios in year i. All other IPOs are scored zero (0). Researchers (Koh and Walter, 1989; Kim and Ritter, 1999; Su and Fleisher, 1998) suggest the level of ex ante uncertainty is likely to be less in highly leveraged IPOs. Debt, therefore, may act as a credible signal of the IPO’s quality. With higher debt the threat of bankruptcy imposes harsher budget constraints on managers, limits manage-ment’s control over cash flows, and raises the risk to a firm’s undiversified stock ownership (Levis, 1990). Lower quality firms are less likely to be willing to assume the additional concerns associat-ed with high debt as they have a higher chance of being forced into bankruptcy. To control for sig-nalling effects of leverage (Levj) we use the book
value of total debt divided by the book value of the total assets of firm j as reported in the last financial period preceding the IPO.
We also control for bonus or stock option plans in executive compensation packages as their pres-ence suggests a higher degree of information asymmetry. This presumption is based on the premiss that bonus or stock option plans are con-tingent on future net income and share price per-formance. This is likely to influence the incumbent management’s time horizon. On average, IPO managers with bonus and stock options as part of their executive compensation packages have greater access to private information about future earnings than other stakeholders. IPO managers can use their inside information to optimise any bonus or stock option provisions to benefit their own self-interests rather than the interests of future shareholders. If outside stakeholders have the same information as IPO managers this may influ-ence valuations of the IPO. For the control vari-able ExeCPj IPOs with a bonus or stock option plan as part of executive compensation packages is scored one (1), otherwise zero (0).
Finally, we include two controls for ex ante un-certainty: (1) offering size (LnGPj) is measured as the natural logarithm of gross proceeds of the IPO as per the prospectus; and (2) prior operating his-tory of the IPO (Agej) is the natural logarithm of the number of days from the date of the firm’s in-corporation to the IPO date. Beatty and Ritter (1986) find when using the inverse of the gross proceeds from the offering (or one plus the number of uses of the proceeds) as a measure of ex ante uncertainty, smaller offerings are more ‘specula-tive’. Prior research (e.g. Beatty, 1989; Clarkson, 1994; Clarkson and Merkley, 1994) also shows a negative and significant association between firm age and underpricing.
Proxy measures for all variables are defined and summarised in Table 1.
4.4. Main model specification and statistical tests This study uses various statistical tests (uni-variate and tests of correlation) to analyse the data. The hypotheses are tested formally through multiple regression analysis. To formally test the three hypotheses developed for this study three specific regression models are estimated as fol-lows:
Table 1
Summary variables and their proxy measure determination
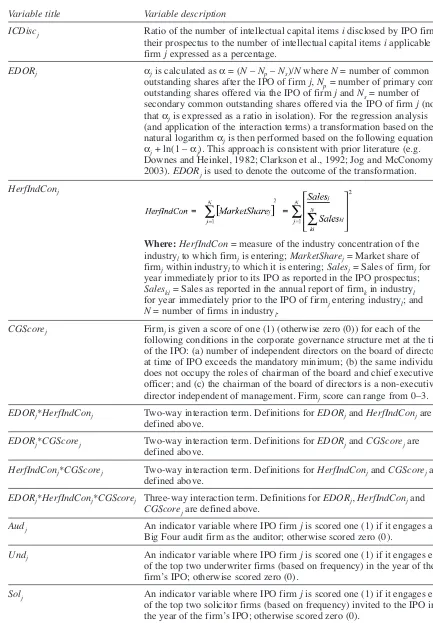
Variable title Variable description
ICDiscj Ratio of the number of intellectual capital items i disclosed by IPO firm j in
their prospectus to the number of intellectual capital items i applicable to firm jexpressed as a percentage.
EDORj αjis calculated as α= (N– Np– Ns)/Nwhere N= number of common
outstanding shares after the IPO of firm j, Np= number of primary common
outstanding shares offered via the IPO of firm jand Ns= number of
secondary common outstanding shares offered via the IPO of firm j(note that αjis expressed as a ratio in isolation). For the regression analysis
(and application of the interaction terms) a transformation based on the natural logarithm αjis then performed based on the following equation: αj+ ln(1 – αj). This approach is consistent with prior literature (e.g. Downes and Heinkel, 1982; Clarkson et al., 1992; Jog and McConomy, 2003). EDORjis used to denote the outcome of the transformation.
HerfIndConj
Where: HerfIndCon= measure of the industry concentration of the industrylto which firmjis entering; MarketSharej= Market share of
firmjwithin industrylto which it is entering; Salesj= Sales of firmjfor
year immediately prior to its IPO as reported in the IPO prospectus;
Saleskl= Sales as reported in the annual report of firmkin industryl
for year immediately prior to the IPO of firmjentering industryl; and
N = number of firms in industryl.
CGScorej Firmjis given a score of one (1) (otherwise zero (0)) for each of the
following conditions in the corporate governance structure met at the time of the IPO: (a) number of independent directors on the board of directors at time of IPO exceeds the mandatory minimum; (b) the same individual does not occupy the roles of chairman of the board and chief executive officer; and (c) the chairman of the board of directors is a non-executive director independent of management. Firmjscore can range from 0–3.
EDORj*HerfIndConj Two-way interaction term. Definitions for EDORjand HerfIndConjare
defined above.
EDORj*CGScorej Two-way interaction term. Definitions for EDORjand CGScorejare
defined above.
HerfIndConj*CGScorej Two-way interaction term. Definitions for HerfIndConjand CGScorejare
defined above.
EDORj*HerfIndConj*CGScorej Three-way interaction term. Definitions for EDORj, HerfIndConjand
CGScorejare defined above.
Audj An indicator variable where IPO firm jis scored one (1) if it engages a
Big Four audit firm as the auditor; otherwise scored zero (0).
Undj An indicator variable where IPO firm jis scored one (1) if it engages either
of the top two underwriter firms (based on frequency) in the year of the firm’s IPO; otherwise scored zero (0).
Solj An indicator variable where IPO firm jis scored one (1) if it engages either
of the top two solicitor firms (based on frequency) invited to the IPO in the year of the firm’s IPO; otherwise scored zero (0).
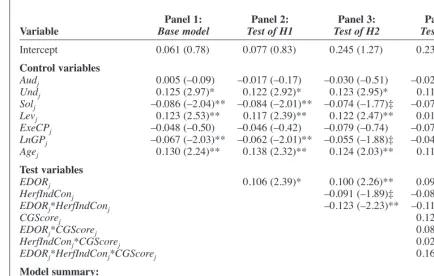
ICDiscj= λj+ β1EDORj+ β2HerfIndConj+ (3) β3EDORj*HerfIndConj+ β4CGScorej+ β5EDORj*CGScorej+
β6HerfIndConj*CGScorej+ 7β7EDORj*HerfIndConj*CGScorej+ γ1Audj+ γ2Undj+ γ3Solj+ γ4Levj+ γ5ExeCPj+ γ6LnGPj+ γ7Agej+ ηj Where:
Formal definitions are presented in Table 1;
λj = the coefficient on the intercept term;
βi = the coefficients 1–7 on the independent and interaction variables;
γi = the coefficients 1–7 on the independent and interaction variables; and
ηj = the error term.
Support for H1 acceptance is derived if the coef-ficient β1 on the independent variable EDORj is found to be statistically significant at conventional levels and with a positive directional sign in re-gressions based on Equations 1, 2 and 3. In the context of H2, this hypothesis will be supported if the coefficient β3 on the interaction variable EDORj*HerfIndConj is statistically significant at conventional levels and the directional sign is neg-ative in regressions based on Equations 2 and 3. Finally, there will be support to accept H3 if the coefficient β7 on the interaction variable EDORj*HerfIndConj*CGScorejis statistically sig-nificant at conventional levels with a positive di-rectional sign in regressions based on Equations 3.
5. Sample and results
5.1. Sample selection and industry distribution Our initial sample comprises SGX IPOs satisfy-ing the followsatisfy-ing criteria:
I. The IPO applied for initial listing on the SGX between 1 January 1997 and 31 December 2006 (based on listings from the SGX). II. The IPO issued equity shares not previously
publicly traded, and whose fiscal year end was prior to or on 31 December 2006.
III. The IPO is not a life investment fund, stock index fund, real estate unit fund or limited partnership.
IV. The IPO did not issue preferred shares only. V. The IPO did not provide a prospectus as part
of a cross-listing arrangement.
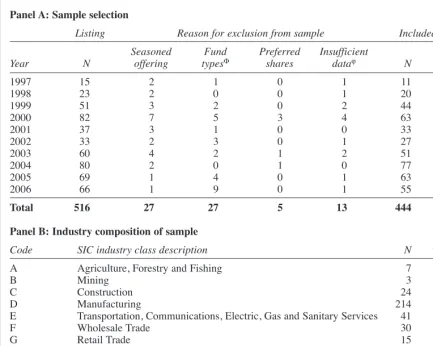
Of the 516 firms applying for a SGX listing be-tween 1997 and 2006, 444 meet our prescribed cri-teria. Of those not meeting the criteria 27 were seasoned offerings, 27 unit fund related issues and five issuing only preferred shares. Another 13 IPOs are excluded: (i) due to insufficient prospec-tus information to construct the proxy measures; or (ii) incomplete prospectuses to enable measure-ment of intellectual capital disclosures. Our final useable sample comprises 86.05% of total IPOs during the review period. A breakdown of the sam-ple selection by year is reported in Table 2, Panel A. The annual breakdown indicates IPO activity is particularly high during two sub-periods: (1) 1999–2000; and (2) 2004–2006. Strong IPO activ-ity during 1999–2000 is synonymous with the hype surrounding the ‘Internet Bubble’ as found in Table 1
Summary variables and their proxy measure determination(continued)
Variable title Variable description
Levj Ratio of book value of total debt (expressed in Singapore Dollars (SGD))
for IPO firm jto total book value of total assets (expressed in (SGD)) of IPO firm jin the accounting period immediately preceding the IPO as per the prospectus.
ExeCPj An indicator variable where the IPO firm jis scored one (1) if the firm has
a bonus or stock option component as part of its executive compensation plan; otherwise scored zero (0).
LnGPj Natural logarithm of the gross proceeds (based on the gross proceeds of the
IPO as per the prospectus) to be received by firm jfrom the IPO (expressed in SGD).
Agei Natural logarithm of the number of days from the date of incorporation of
firm jto the date of the IPO.
other major capital markets (Ljungqvist and Wilhelm, 2002; Loughran and Ritter, 2002; Ofek and Richardson, 2003). High IPO activity in Singapore from 2004 through 2006 can be attrib-uted, in part, to a growing enthusiasm for: (a) at-tracting China-based firms; or (b) investment into Singapore incorporated firms that are developing and/or expanding operations in China. Low IPO activity in 1997–1998 and 2001–2003 is likely due to poor economic conditions.12
An industry breakdown (US SIC single-digit classification) shown in Table 2, Panel B shows nearly 50% of the IPOs representation were from the manufacturing sector (i.e. 214 of 444 or 48.20%). The strong representation of IPOs from the manufacturing sector is consistent with
under-lying dominance of this industry sector in Singapore. The services sector is also strongly rep-resented with 21.84% (i.e. 97 of 444) of the IPOs being classified into this business sector. Given Singapore’s lack of natural resources it is not sur-prising few mining firms listed on the SGX (i.e. 3 or 0.68%). Mining sector firms listing on the SGX generally had extensive mining operations in Indonesia, Malaysia or Vietnam.
Table 2
Breakdown of sample selection process
Panel A: Sample selection
Listing Reason for exclusion from sample Included in sample
Seasoned Fund Preferred Insufficient % Total
Year N offering typesΦ shares dataϕ N listing
1997 15 2 1 0 1 11 73.33
1998 23 2 0 0 1 20 86.96
1999 51 3 2 0 2 44 86.27
2000 82 7 5 3 4 63 76.83
2001 37 3 1 0 0 33 89.19
2002 33 2 3 0 1 27 81.82
2003 60 4 2 1 2 51 85.00
2004 80 2 0 1 0 77 96.25
2005 69 1 4 0 1 63 91.30
2006 66 1 9 0 1 55 83.33
Total 516 27 27 5 13 444 86.05
Panel B: Industry composition of sample
Code SIC industry class description N % Sample
A Agriculture, Forestry and Fishing 7 1.58
B Mining 3 0.68
C Construction 24 5.41
D Manufacturing 214 48.20
E Transportation, Communications, Electric, Gas and Sanitary Services 41 9.23
F Wholesale Trade 30 6.75
G Retail Trade 15 3.38
H Finance, Insurance and Real Estate 9 2.03
I Services 97 21.84
J Public Administration 4 0.90
Total 444 100.00
Where:
Φ– Offerings categorised in this group included life investment funds, stock index funds and real estate funds that issued unit trusts via the SGX.
ϕ – IPOs classified as ‘Insufficient Data’ typically included those where a verifiable copy of the original prospectus could not be obtained, or IPOs where a prospectus was obtained but necessary information relevant to this study (such as for determining key variables) was not available.
12In late 1997, for example, Singapore (like other Asian na-tions) was savaged by the Asian Financial Crisis that lingered into 1998. Whilst in the midst of an economic recession in 2001–2002 Singapore’s economic prosperity was further dampened by the SARS crisis.
5.2. Descriptive results
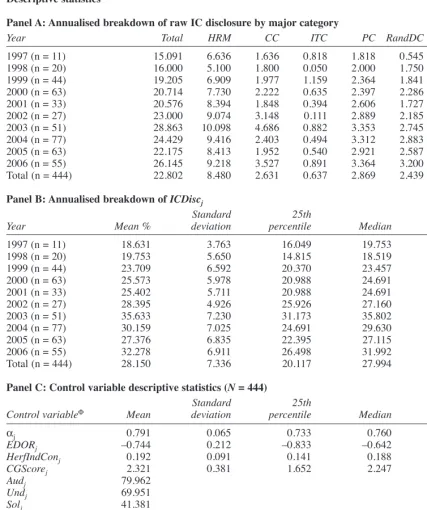
Table 3, Panel A reports an annual breakdown of the raw amount of intellectual capital disclosure. Average raw total intellectual capital disclosure rises yearly from 15.091 items in 1997 to a peak of 28.863 items in 2003 followed by a decline in 2004 (24.429 items) and 2005 (22.175 items) be-fore a rebound in 2006 (26.145 items). An ANOVA test (not tabulated) did not indicate sig-nificant variations in the annual average total raw intellectual capital disclosure across the study pe-riod. Bukh et al. (2005a) is presently the only study enabling any meaningful longitudinal com-parison.13They (Bukh et al., 2005a) report an
an-nual upward trend in IC disclosure in Danish IPO prospectuses from 1990 to 1999 with a slight de-cline in 2000 and 2001.14Comparatively, average
raw intellectual capital disclosure for Singapore IPOs is marginally below Danish IPOs from 1997 to 2001 (the period during which both studies overlap).15
An annual raw disclosure breakdown by major intellectual capital categories is also reported in Table 3, Panel A.16Changes in raw disclosure
as-sociated with human resource, customer and process capital follows a similar path (i.e. upward annually from 1997–2003 with a decline in 2004 and 2005, and then rising in 2006) to total raw in-tellectual capital disclosure. Average raw disclo-sure on information technology capital spiked in 1999 (1.159 items) followed by an annual decline. Disclosure related to information technology capi-tal again spikes in 2003 (0.882) before two further years of moderation before a third spike in 2006 (0.891 items). This pattern of spikes followed by declines could be systematic of fluctuations in ex-penditure and attention to information technology that could follow cyclical paths. Average raw R&D capital disclosures fluctuated between 1997 and 2002 before a rise and stabilisation in 2003 and 2004. There is a dip in 2005 with a rebound in the subsequent year. Besides two anomalies in 1997 and 2003 the average raw disclosure for strategic capital is quite flat though with a sharp rise in 2006 relative to prior years.
An annualised breakdown of average ICDiscj scores is reported in Table 3, Panel B. Consistent with average raw total disclosures the average ICDiscj scores increased annually from 1997 to 2003 (18.631% to 35.633%) before a pullback in 2004 (30.159%) and 2005 (27.376%). This is fol-lowed by an increase in 2006 (32.278%). An ANOVA test (not tabulated) did not indicate sig-nificant variations at conventional levels between the annual average ICDiscjscores.
Descriptive statistics for the independent vari-ables (based on pooled sample) are reported in Table 3, Panel C.17 Statistical tests (not tabulated)
show only the mean annual values for EDORjand
Agei differ significantly. Of 2001 IPOs (and to some degree 2002 IPOs) average retained owner-ship and age is significantly higher than 2004–2005 IPOs. Poor economic conditions in Singapore in 2001 may partially explain this ob-servation. With the economy struggling, only high quality firms (indicated by a higher level of retained ownership and/or a longer established record) would have found it viable to list. A more buoyant economy in 2004–2006 would have pro-vided a higher likelihood of reasonable returns. Thus, a higher number of lower-quality firms and/or those with a shorter prior operating history would have been attracted to list in 2004–2006 as opposed to 2001. The average HerfIndConjscore (0.192) indicates business sectors being entered by IPOs between 1997 and 2006 were moderately to highly concentrated. This result is consistent with prior views that business sectors in Singapore are dominated by large sector leaders that capture the majority of sales turnover. The average corporate governance score for the pooled sample (i.e. 2.321) implies that upon listing on the SGX IPOs were, in general, well governed. However, de-scriptive statistics for CGScorejalso indicate vari-ations in standards.
13Bukh et al., (2005b) measure IC disclosures of a sample of Japanese firms using the Bukh et al., (2005a) index but only for a single year (i.e. 2003). Strom (2005) also measures intel-lectual capital disclosures in prospectuses of Swedish IPOs. His index (Strom, 2005) comprises fewer items and focuses on specific subsets of intellectual capital from Bukh et al., (2005a).
14The upward trend is consistent with growth in the aware-ness and attention to intellectual capital issue during the 1990s.
15Data for the Bukh et al. (2005a) study is from 1990 to 2001. Whilst not a specific parallel to our study the Bukh et al. (2005a) study provides a basic benchmark.
16As the number of items in each major category varies a comparison of raw disclosure between categories is not pru-dent. Caution should be taken if making any such comparison. Due to difficulty in making such a comparison we do not pro-vide any commentary in this paper on any cross-category comparisons.
17IPOs opting to disclose less intellectual capital informa-tion in their prospectus may have different organisainforma-tional characteristics than IPOs disclosing more (Bukh et al., 2005a). For instance, a smaller IPO may opt not to disclose as much intellectual capital information due to the threat of competitive pressures from larger firms. Larger IPOs, however, may not be subject to this disincentive. Table 3, Panel A describes various organisational characteristics for the pooled sample. Using the median value (for the pooled sample and by year) for each or-ganisational characteristic as the cut-off point we conducted statistical tests to determine if the level of intellectual capital disclosure may have been significantly influenced by relevant firm-specific characteristics. Any significant variations noted may have inferred possible self-selection bias. Between and within tests (not tabulated for brevity) did not indicate any sig-nificant differences in the level of intellectual capital disclo-sure (for the pooled sample or individual years) due to the firm-specific characteristics listed in Table 3, Panel A. Based on these findings we conclude that self-selection bias is not a significant concern with the sample.
Table 3
Descriptive statistics
Panel A: Annualised breakdown of raw IC disclosure by major category
Year Total HRM CC ITC PC RandDC SC
1997 (n = 11) 15.091 6.636 1.636 0.818 1.818 0.545 3.636 1998 (n = 20) 16.000 5.100 1.800 0.050 2.000 1.750 5.300 1999 (n = 44) 19.205 6.909 1.977 1.159 2.364 1.841 4.955 2000 (n = 63) 20.714 7.730 2.222 0.635 2.397 2.286 5.444 2001 (n = 33) 20.576 8.394 1.848 0.394 2.606 1.727 5.606 2002 (n = 27) 23.000 9.074 3.148 0.111 2.889 2.185 5.593 2003 (n = 51) 28.863 10.098 4.686 0.882 3.353 2.745 7.098 2004 (n = 77) 24.429 9.416 2.403 0.494 3.312 2.883 5.922 2005 (n = 63) 22.175 8.413 1.952 0.540 2.921 2.587 5.762 2006 (n = 55) 26.145 9.218 3.527 0.891 3.364 3.200 5.945 Total (n = 444) 22.802 8.480 2.631 0.637 2.869 2.439 5.745
Panel B: Annualised breakdown of ICDiscj
Standard 25th 75th
Year Mean % deviation percentile Median percentile
1997 (n = 11) 18.631 3.763 16.049 19.753 20.988 1998 (n = 20) 19.753 5.650 14.815 18.519 23.148 1999 (n = 44) 23.709 6.592 20.370 23.457 27.160 2000 (n = 63) 25.573 5.978 20.988 24.691 29.630 2001 (n = 33) 25.402 5.711 20.988 24.691 28.395 2002 (n = 27) 28.395 4.926 25.926 27.160 33.333 2003 (n = 51) 35.633 7.230 31.173 35.802 40.741 2004 (n = 77) 30.159 7.025 24.691 29.630 35.494 2005 (n = 63) 27.376 6.835 22.395 27.115 31.752 2006 (n = 55) 32.278 6.911 26.498 31.992 41.643 Total (n = 444) 28.150 7.336 20.117 27.994 33.943
Panel C: Control variable descriptive statistics (N= 444)
Standard 25th 75th
Control variableΦ Mean deviation percentile Median percentile
αj 0.791 0.065 0.733 0.760 0.822
EDORj –0.744 0.212 –0.833 –0.642 –0.621
HerfIndConj 0.192 0.091 0.141 0.188 0.211
CGScorej 2.321 0.381 1.652 2.247 2.402
Audj 79.962
Undj 69.951
Solj 41.381
Levj 0.592 0.292 0.408 0.562 0.712
ExeCPj 47.224
Gross proceeds $40,150,708 $47,491,448 $4,600,130 $10,350,000 $68,221,000
LnGPj 16.606 0.988 15.242 16.587 17.006
Age in days 2,100 4,091 250 881 4,572
Agei 6.749 1.527 5.544 6.507 8.181
Where:
See Table 1 for definitions of variables.
‡ – Of all the dependent, independent and control variables ANOVA tests indicate only significant variations in mean values between each year of the review period for EDORjand Agei.
Φ– The control variables are all shown in italics. Variables not in italics are supplementary information relat-ed to respective control variables before transformation. For all control variables measurrelat-ed using a dichoto-mous scale (i.e. Audj, Undj, Soljand ExeCPj) the value reported is the percentage of the sample that employed
the services of a Big Four audit firm, prestige underwriter and/or highly reputable solicitor firm, and those with bonuses and stock options as a component of the executives compensation package. For example, 79.962% of the sample (or 355 IPOs of 444) engaged a Big Four audit firm.