he Political Geography of Voters and Political Participation:
Evidence from Local Election in Suburban Indonesia
Pitri Yandri
Received: 21 05 2016 / Accepted: 23 01 2017 / Published online: 30 06 2017 © 2017 Faculty of Geography UGM and he Indonesian Geographers Association
Abstract he praxis of political issue including voter turnout and political participation does not exist in a vacuum. herefore, geographical and spatial issues are frequently engaged and even embedded into it. hus, this article is writ-ten with one purpose: to investigate the spatial relationship of voter turnout and their political participation. As stated earlier, the complexity of the political analysis based on geography will take us on a multidimensional approach that includes social, cultural and economy. However, this article starts the discussion from spatial analysis by using a map that illustrates the administrative boundaries of a region, then determining whether one region is adjacent to another. In this case, Moran’s I is used to determine the spatial autocorrelation of voter turnout and political participation. he result indicates that the voter turnout and political participation in one region is adjacent to each other. Possible reasons for the result are discussed in this article.
Abstrak Praktik-praktik dan isu politik, termasuk suara pemilih dan partisipasinya tidak berada di ruang hampa. Karena
itu, isu-isu geograis dan keruangan sering kali terlibat dan bahkan melekat di dalamnya. Artikel ini ditulis dengan satu tujuan: menginvestigasi keterkaitan spasial suara pemilih dan partisipasi politik penduduk. Sebagaimana telah disebut sebelumnya bahwa kompleksitas analisis politik berdasar perspektif geograi akan membawa kita pendekatan multidimen-sional, termasuk sosial, budaya dan ekonomi. namun demikian, artikel ini memulai diskusinya dari analisis spasial dengan menggunakan peta yang menggambarkan batas-batas sebuah wilayah kemudian menentukan apakah satu wilayah memi-liki keterkaitan dengan wilayah lainnya. Dalam hal ini, Moran’s I digunakan untuk menentukan autokorelasi spasial suara pemilih dan partisipasi politik. Hasil menunjukkan, suara pemilih dan partisipasi politik penduduk memiliki keterkaitan spasial. Beberapa alasan yang mendasarinya didiskusikan lebih jauh dalam artikel ini.
Keywords: adjacent, democracy, gentriication, neighboring, spatial autocorrelation, south tangerang municipality
Kata kunci: autokorelasi spasial, demokrasi, gentriikasi, ketetanggaan, kedekatan, Kota Tangerang Selatan.
I.Introduction
Currently, Indonesia is known as one of the most liberal democracy countries in the world [Anwar, 2010], and in Southeast Asia as well, apart from Timor-Leste and the Philippines [Peou, 2014]. herefore, what is a liberal democracy? Bollen [1993] tries to compile it into the following parameters: freedom of broadcast and freedom of print media, civil liberties, freedom of group opposition, political rights, competitiveness of nomination process, a chief executive elected, and efectiveness of legislative body. However, Plattner [2010] states that the deinition has a complexity. Nevertheless, Carter and Stokes [2002] provide a straightforward model for the basic elements of a liberal democracy. One of these elements includes a government accountable to its citizens by means of regular elections. Additionally, there should be a parliament that can exercise control over the government, and all this happens within a framework of the rule of law, and individual freedom that allows popular participation by means of free
Pitri Yandri
STIE Ahmad Dahlan Jakarta
Doctoral Student of Regional & Rural Development Planning Sci-ences, Bogor Agricultural University (IPB)
Coresponden e-mail: p.yandri@gmail.com
debate, freedom of association and the right to protest. In the efort to concretize the academic discourse, Freedom House [2008] then introduces ive categories that can be aggregated into Democracy Index: electoral process and pluralism, civil liberties, functioning of government, political participation and political culture. Aterwards, the Indonesia Government then compiles since 2009 its own Democracy Index, which consists of three indicators: civil liberty, political rights and institution of democracy [Rauf et al, 2011].
In the case of Indonesia Democracy Index, although it is still categorized as a lawed democracy— rank 49 with performance value of 7.03 [he Economist, 2015]—the performance was rated better than countries in Southeast Asia, and even better than in 2014 with a value of 6.95 [he Economist, 2014]. Nevertheless, political scientists believe that democracy in Indonesia is still an electoral-procedural [Hadiz, 2004; Slater, 2006; Abdulbaki, 2008; and Soebagio, 2009]. In many aspects it is oten counterproductive to the spirit of democracy [Ida, 2014] and it causes backwardness because it is not supported by strong democratic institutions [Hillman, 2011]. However, the deep and sharp academic debate simultaneously shows that scientists’ attention to
Indonesian Journal of Geography Vol. 49, No.1, June 2017 (57 - 64)
the situation of democracy in Indonesia is still preoccupied with micro-electoral democracy issues [Darmoval, 2006]. It also happens in an instant analysis of political scientists during the selection process, as carried out by a number of quick surveys with the support of national televisions. Tragically, scientiic discourse and empirical studies of geographic democracy in Indonesia apparently has not received serious attention. heir analysis focuses only on the voice and participation of voters, without concerning themselves with aspects of geographic space. In this case, theoretically O’Loughlin [2003] expresses the need to enter and even integrate spatial analysis in political science to this context; an explanatory analysis equipment to reduce deiciencies in the micro analysis is urgently needed. hat fact motivates Darmoval [2006] to believe that macro level perspective can give more attention to the issue of the political dimensions of political participation. With that in mind, the perspective describes at the same time the collective responsibility of the actors in the process of electoral democracy, the political elite and citizens, as well as the quality of democracy itself. Moreover Darmoval [2006] explains that the beneits of macro-level approach in investigating the voter turnout are important in the context of democratic development, especially its geographical implications. Cox [2002] states that political geography is concerned in territory, state, social, cultural and people who are in the scope of the territory. For others, political geography is the study of political process, difering from political science only in the emphasis given to geographical inluences and outcomes, as well as in the application of spatial analysis techniques [Kasperson and Mingi, 1969; Burnett and Taylor, 1981] in Jones, et al [2004]. Abroad, studies on political geography has been developed widely. For example, a study conducted by O’Loughlin, Flint and Anselin [1994] which investigates Nazi voter geography; Jenkins and Sala [1998] which examines the spatial distribution of voters in the United States; Perdomo [2004] in Mexico, and Montero [2010] in Brazil. In the context of Indonesia, little efort yet signiicant has been exercised by Prahutama [2014] through his studies at the local elections in Central Java. By using spatial autocorrelation, he inds that every candidate has a spatial autocorrelation.
Studies abroad regarding voter turnout and political participation related to regional phenomena has also been very attractive. In the context of urban area, for example, there are studies by Preuss [1981]; Mwinyi and Kayunze [2014] in Tanzania. In rural areas, Rashid and Gao [2012] examine the determinants of attitudes of young voters in politics in Bangladesh, while Landry and Davis [2010] examine the general elections in rural areas in China. In the context of political science in Indonesia, the issue of suburb voters has rarely become the object of studies. hus, this article is expected to contribute to the new approach to
the discourse of democracy, especially in the context of electoral democracy at the local elections in Indonesia
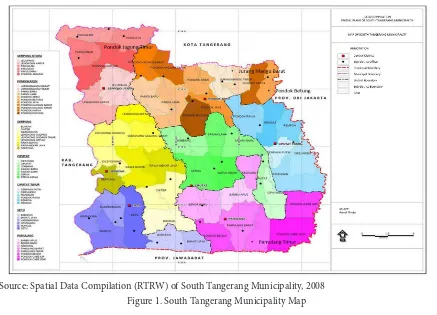
Based on the First Tobler heorem, which states that “everything is related to everything else, but near thing are more related than distant things” in Miller (2004), irstly this article elaborates on the geography of the voter turnout and political participation in the local head election (Pemilukada) in South Tangerang Municipality and simultaneously investigate its spatial autocorrelation. he Pemilukada held on December 9, 2015 was also part of the nationwide local elections, held simultaneously throughout Indonesia, both the provincial and district/county. he Pimilukada organized in 32 provinces out of 34 provinces, which covers 269 districts/counties, excluding Jakarta and Aceh Province. As a suburb, South Tangerang Municipality was formed under Act No. 51/2008 on the establishment of South Tangerang Municipality on 29 Septemper 2008. Located in the eastern province of Banten and administratively consists of 7 districts, 54 subdistricts with an area of 147.19 km2 (Figure 1). he administrative boundaries of the region: northern side with Jakarta Province and Tangerang Municipality; eastern side with Jakarta Province and Depok Municipality; southern side with Bogor Regency and Depok Municipality; and western side with Tangerang Regency. As has been described by Yandri [2014], most population in this region works in Jakarta as commuters.
Secondly, as a hinterland, this article also presents how the phenomenon of spatial relationship occurs in suburban areas. his argument is relevant because in its development, a number of rural areas in Indonesia experience a massive urbanization process. he phenomenon leads to the emergence of suburban fringe, urban fringe, and rural-urban fringe, each with its own dynamics of geography.
2.he Methods
Data in this article gathered from www.kpu.go.id. On this website we can track voter turnout on the “AMJ Pilkada” menu, which then we can search the voter turnout and the level of political participation on the “Informasi Perhitungan Suara” on http://www. kpu.go.id/index.php/pages/detail/2015/395. General Election Commission (KPU) provides database of local head election results based on the districts/ counties throughout Indonesia. In addition to that data, the map data was also necessary to determine the administrative boundaries of each sub-district.
he statistical tool used to evaluate the global spatial autocorrelation was Moran I, with the following formula:
[1] With more operational equation, the equation [1] can be rewritten in the form:
[2]
Where:
N : number of spatial units indexed by i and j : mean of Xi
Xj : value in location to-i Xi : value in location to-j
Wij : element of a matrix of spatial weights
he expected value of Moran’s I under the null hypothesis of no spatial autocorrelation is:
, its variance equals to:
[3]
where:
[4]
[5]
[6]
[7]
[8]
heoretically, the resulting value in the calculation of Moran index ranges between -1 <I <1. he value I is expressed by:
I0 = -1/n – 1 close to 0 which means there is no spatial autocorrelation.
I > I0 which means that there is positive spatial autocorrelation and this means data patterns are clustered. I < I0 which means that there is negative spatial autocorrelation and this means data patterns are dispersed.
3.Result and Discussion
In the Indonesian electoral system, especially in the organization of local elections, each candidate, consisting of a pair of one mayor and one deputy mayor, must be nominated by a political party or coalition of political parties. It is stated clearly in Act No. 1/2015. However, the rules that are considered castrating the rights of citizens were then converted Figure 1. South Tangerang Municipality Map
into Act No. 8/2015 that legitimates independent candidates to be backed by a number of constituents. In South Tangerang Municipality, on the local elections in 2015, all participating candidates were supported by political parties. he following was information on all candidates and their supporting political parties.
Table 1. he Candidate of Mayor and Vise Mayor Candidates Political Parties Back-Up Ikhsan Modjo & Li
Clau-dia Chandra
Demokrat, Gerindra
Arsid & Elvier Ariadian-nie Soedarto Poetri
PDIP, Hanura
Airin Rachmi Diany & Benyamin Davnie
PKB, PKS, PAN, PPP, NasDem, Golkar Source: www.kpu.go.id, 2015
Table 1 shows the fact that the incumbent, Airin Rachmi Diany and Benyamin Davnie, had the most number of political parties supporting them. Some local political analysts said that their key to victory lied in Airin’s powerful igure. She is the wife of Tubagus Chaeri Wardana, who is the younger brother of Ratu Atut Chosiyah, Banten Governor—later was jailed for two cases of corruption and bribes regarding the procurement of medical equipment to the Chairman of the Constitutional Court, Akil Mochtar. Regardless of what was faced by Chosiyah, one thing that is clear was the map of political power here was still held by the family around them, and this happened in many districts/ counties in Banten Province (Hidayat, 2007; Agustino and Yusof, 2010). In the early stages of the 2015 political contestation, that inluence seemed to cause Airin and Benyamin got supported by six political parties. he result was the incumbent have actually won the competition for political power and led the South Tangerang City until 2020, by votes reaching 59.61%. Meanwhile, the most voted ater Airin was Arsid and Elvier Ariadiannie Soedarto Poetri (32.18%); Ikhsan Modjo and Claudia Li Chandra (8.22%). In the context of Airin, although her family, especially her husband, was being awarded with public spotlight for corruption cases, she could still won the political competition. Public’s positive sentiment apparently
was closely related to a number of free public service programs throughout the period of her leadership. Basic public services, such as primary education (elementary school), health and administrative services (ID card, certiicate of birth / death, etc.) could be taken care of without charge. his is as stated in by Local Act (Perda) No. 9/2011 on Population Administration Implementation and Local Act No. 4/2013 on Municipal Health System. In the health sector, for example, free health service users reached 60.734 people in 2013, and the number of beneiciaries of this service increased to 64.560 people in 2014. hat fact answered the questions about why public still voted for her in the 2015 Election. his unique case conirmed that there has been no correlation between poor family name reputations for corruption and the failure of a candidate in a political competition. hat is, if the leaders of the region are able to provide quality public services, the issue of corruption will only be newspaper talk, without any impact whatsoever to the election.
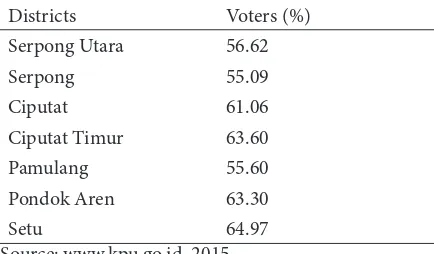
According to data from the KPU, Airin and Benyamin elected by 305.049 voter turnout from a total of 533.444 users sufrage. Average voter in every district reached 60.03%. hey obtained the highest vote in the Setu (64.97%), Ciputat Timur (63.60%), and Pondok Aren District (63.30%). Table 2 below shows the complete information of their vote totals in each district.
Table 2. he Average of Airin’s and Benyamin Voters by Disricts in Local Election 2015
Districts Voters (%)
Serpong Utara 56.62
Serpong 55.09
Ciputat 61.06
Ciputat Timur 63.60
Pamulang 55.60
Pondok Aren 63.30
Setu 64.97
Source: www.kpu.go.id, 2015
Now, the irst step of Moran’s I calculation was to look at the map of South Tangerang Municipality (Figure Source: ArcGIS Help 10.
1) to determine the adjacent inter-sub-district (wij). If inter-sub-district have an adjacent, then it was rated 1, wij = 1; and conversely, a value of 0 was set for sub-district that do not have an adjacent, wij = 0. In terms of the process of calculating the value of the adjacent of each district, the easiest way was to only input sub-districts that have an adjacent. From this process, the next step was to calculate Moran’s I in each sub-district. Table 3 below is an illustrative calculation Moran’s I for Pondok Jagung sub-district located in Serpong Utara district. he procedure in table 3 was conducted in ity-four sub-districts in South Tangerang Municipality.
Tabel 3. Moran Index Calculation for Pondok Jagung Sub-District
NEIGHBORING SUBDISTRICT VOTES (yi) PRODUCT
Pakualam 49.73 -8.35 -10.12 1 84.502
Pakulonan 57.58 -8.35 -2.27 1 18.9545
Paku Jaya 58.53 -8.35 -1.32 1 11.022
Pondok Kacang Barat 69.35 -8.35 9.5 1 -79.325
Jelupang 58.62 -8.35 -1.23 1 10.2705
Lengkong Karya 63.97 -8.35 4.12 1 -34.402
Ʃ -1.32 6 11.022
�51.5− �� ��− �� ���
Source: www.kpu.go.id 2015, proceeded
he process of global Moran index aggregation was obtained by using the equation [1]. he calculation was shown in Appendix 1 to this article. he number of sub-district observed was 54, n = 54; so n – 1 = 53. he value of (yi – ў )2 = 1926.825987; and the
value of = 2029.845334,
as well as the total value wij = 247, then the value of global Moran index is:
[9]
0.226 Moran’s I showed that there was positive spatial autocorrelation on voter turnout in the region, which means that the pattern of voter turnout were clustered. In other words, Airin and Benyamin’s voter in a sub-district had spatial autocorrelation with voters in other neighborhood sub-district.
he main explanation that makes sense for this evidence was not because the process of political marketing (banners, billboards, etc.), but rather because of, irst, the political agent of a political party that worked in every urban village and sub-district. With the support of 6 political parties, Airin and Benyamin had a higher chance to mobilize the voice of citizens than any other candidates. Table 4 conirmed, the parties supporting the Airin and Benyamin acquire 52.3% votes. With the acquisition of the votes, each supporting party had seats in local legislative body (DPRD) with the following composition: Golkar Party 9, PKS 5; and PKB, PAN, PPP and NasDem Party spread into Madani dan Padi Faction, respectively: NasDem Party 3, PKB 3, PAN 3, and PPP 2.
Second, as an incumbent, they had easier access to campaign budget and government resources that could be indirectly used to boost campaigns. Accelerating the improvement of public services and activities down to the grass root to interact with the community then formed a positive image to the public. hird, special attention was paid to social and cultural movement as long as she took oice. his movement was very efective in boosting the voting at the elections. Interviews with members of the KPUD South Tangerang Municipality example, states:
“Airin oten attend any invitation of ‘hajatan’ of residents, although the villagers had no kinship with her. He congratulated and greeted the family who celebrate the ‘hajatan’ and even see the process of cooking the dishes in the kitchen, a place where women generally gathered. Even if she couldn’t attend it, she would leave a wreath on the family’s celebration. In addition to the way it was, Airin was relatively active in women’s recitation organizations”
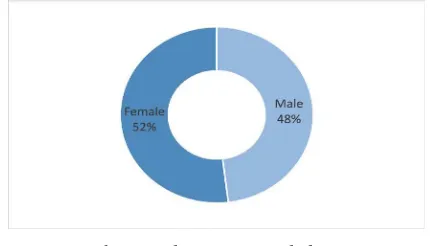
In the context of the Local Election, all those methods were ultimately intended to mobilize their votes. It then formed a positive opinion and at the same sympathy of women toward her. hat logic was proven by the fact that the number women voters were higher than the male, by reaching 52% of female voters (Figure 3). hese practices conirmed what Sjaf (2014) called with ethnic-based politics of women.
Source: www.kpu.go.id 2015, proceeded
Figure 3. Percentage of Gender Voter Turn
Nevertheless, the election as an attraction in suburban Indonesia kept one fundamental problem, namely the lack of public political participation. For that problem, high public political participation relected improvements in the consolidation of democracy. KPU data showed, the level of public political participation in the 2015 election in South Tangerang Municipality is only about 57.98% (Appendix 2). Political participation was not much diferent when compared to the election in 2010, which is only 57%.
as Dimitrova and Bystrom [2013]. However, generally the main cause is because of apathy towards politics and politicians [Scully, Jones and Trystan, 2004], in addition to the outbreak of money politics as well as the revitalization of customary institutions and local identities through decentralization [Elizabeth [2012] and the lack of civic education (Mwinyi and Kayunze, 2014]. In the context of decentralization, the study Hajnal and Lewis [2003] explains, the better the local government in providing quality public services, the better the level of public political participation.
However, in the context of urban/suburban, low political participation has been noted long ago by Preus [1981]. He stated that there are degrees of unwillingness and the inability of the urban population to choose. In the perspective of geography, Knotts and Haspel [2006] answer the problem with Gentriication heory. Gentriication indicates socio-cultural changes in a region that is created by the rich buying residential property in less aluent neighborhoods. As a result, the average income increases in the region and, simultaneously, there occurs unoicial economy expulsion to low-income residents due to rental rates, home prices and rising property taxes. On the other hand, gentriication oten changes the heterogeneous character of a community into an economically homogeneous society that has the character of suburban [Smith, 1979]. In the study Knotts and Haspel [2006], due to lack of community connection, suburb gentriication has lower political participation, and longstanding residents’ political participation will simultaneously decrease along with new residents. his process causes a decrease in the overall political participation, both on longstanding residents and new residents.
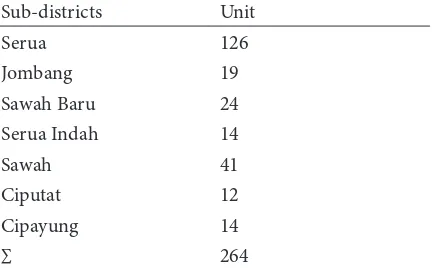
Gentriication theory explains why political participation in South Tangerang Municipality is low. he empirical data of BPS of Banten Province in 2008, for example, conirms that the number of residential areas was only about 75 units. But in 2011, they conirmed that the number of residential areas swelled to more than 150 units. In 2015, in the Ciputat District only, the number has reached 264 units (Table 5).
Table 5. Total of Housing Complex in Ciputat District
Sub-districts Unit
Serua 126
Jombang 19
Sawah Baru 24
Serua Indah 14
Sawah 41
Ciputat 12
Cipayung 14
∑ 264
Source: Ciputat District in Figures, 2015
he residential complex areas that are spread evenly throughout the districts seemed to explain why the low political participation also had a spatial relationship. he calculations showed that the value of (yi – ў)2 = 1788.935888; and the value of
= 1324.1442, as well as the total value wij = 247, then the value of global Moran index is:
[10]
In addition, the Schram’s study [1991] inds that non-commuting public bureaucrats vote at a higher rate in a local election than private sector workers of commuting public bureaucrats. he study was later conirmed by Newman, Johnson, and Lown [2013] which state “even ater controlling for a variety of relevant individual and contextual factors, time spent working exerts no impact on one’s level of participation. An increase in time spent commuting, however, is found to lead to a signiicant decrease in participation”.
he question is whether the studies of Schram [1991]; Newman, Jhonson, and Lown [2013] have also answered the low political participation in South Tangerang Municipality and at the same spatial autocorrelation. As I ever researched, the characteristics of people living in a residential area in South Tangerang City is working in Jakarta, and as we know, the employment sectors that are emerging in Jakarta is the service sector [Yandri, 2014]. Tabel 4. Distribution of Voters of the Political Parties Legislative Elections in South Tangerang
Municipality 2014
Source: Local General Election Commission (KPUD) South Tangerang Municipality, 2014
Districts PKB PKS PAN PPP Nasdem Golkar Ʃ Voters of
Political Party Serpong Utara 2,371 2,947 3,962 1,588 3,977 8,514 59,010 Serpong 11,568 4,246 1,754 2,689 4,445 9,126 65,439 Ciputat 3,537 6,824 6,651 6,419 3,240 25,939 96,736 Ciputat Timur 4,223 5,542 2,310 3,316 12,702 10,480 83,026 Pondok Aren 8,175 13,267 7,673 6,661 13,007 29,466 138,242 Pamulang 8,929 12,125 11,706 8,789 5,490 31,130 145,669 Setu 2,222 3,586 1,139 4,231 4,135 6,205 35,622
Ʃ Valid Voters 41,025 48,537 35,195 33,693 46,996 120,860 623,744
herefore, the data conirmed, population working in industry is dominated by the services sector and others, that percentage reached 91.3% of the 656,498 workers [BPS South Tangerang Municipality, 2015]. heir daily routine is to go to Jakarta and back home using various modes of transport (commuters), such as trains, buses, and private vehicles (cars and motorcycles). Estimates from www.tempo.co.id (8 November 2013), for example, shows the number of train passengers from the regions each morning reached 600 thousand people per day. In the region there is Integrated Border Bus Transport Bus (APTB). APTB operates 17 hours (05:00 to 22:00) with a capacity of 85 people each bus where each APTB route’s capacity is about 17,340 people per day.
hus, the results of this study are consistent with the indings of Schram [1991]; Newman, Jhonson, and Lown [2013] as well as answering why political participation in the suburb has a spatial autocorrelation. herefore, last but not least, the novelty position of this study then completes our understanding of political dynamics and space entities in the Pemilukada in Indonesia. Even so, to reinforce these indings, the challenge for the next study is to investigate in detail voters’ age and education level, with which we can get a deinitive answer about the why they choose/ not to choose. In addition, observations of voters in a number of residential concentration as a result of gentriication in detail should also be reinvestigated.
4.Conclusion
here are two issues to be addressed by this study; are voters and political participation of voters associated spatially? his question turns out to take us on the methods of analysis that must combine spatial analysis and at the same time social, economic and political simultaneously. In spatial analysis, we need a map depicting the boundaries of areas with boundaries that we can determine whether the area has adjacent to other regions. In this context, the regions in question are areas of districts and villages. hen, to determine whether the voters and participants have a spatial relationship, we need a spatial autocorrelation analysis tool known as Moran’s I.
In turn, Moran’s I calculation results couldn’t be interpreted without involving another dimension, because political events do not occur in a vacuum. It is conirmed that the understanding of the phenomenon of space entities will involve multiple dimensions: social, economic, and cultural. From the combination of these shared dimensions we can conclude that the voter turnout to vote and participation has spatial association. In the case of South Tangerang Municipality as a suburb, the winning of Airin’s and Benyamin because irst, the high support from numerous political parties gives them upper hand with parties’ agents spread across the districts and villages. More agents who can mobilize public votes means that the greater the
winning potential. Second, it is also related to their status the incumbent. Regional head candidates derived from the incumbent has access to the inancial resources of the area for concealing campaign activities as development programs in all districts and sub-districts. his method is then formed positive image and raise electability. hird, Airin’s play on ethnic-based politics of women proves to be quite efective. he phenomenon of spatial autocorrelation of political participation associated with gentriication in suburb brings new housing complex, spread evenly in South Tangerang Municipality. he main characteristic of the families’ job in the housing complex is the service sector in Jakarta, and they are commuters. heir even spread is the answer why political participation (lower) also has a spatial autocorrelation. herefore, the conclusion is clear: the phenomenon of gentriication is counterproductive to eforts to create a better democracy. herefore, this evidence can be taken as recommendations for policy makers to redesign suburban residential area in Indonesia.
Acknowledgment
hanks to Aziz Hasyim [University of Khairun, Ternate] for giving his opinion; Syarifah Dalimunthe [Research Center for Population LIPI] on deepening discussion; Bambang Dwitoro [Members of KPUD South Tangerang Municipality] for supporting data and interview are necessary in the process of writing this article.
References
Abdulbaki, L., (2008). Democratisation in Indonesia: from transition to consolidation, Asian Journal of Political Science, Volume 16, Issue 2: 151-172. Agustino, L., & Yusof, M.A., (2010) Local politic in Indonesia: form autocratic to political reform [in bahasa], Jurnal Ilmu Politik, Edisi 21: 6-30. Anwar, D.F., (2010). Foreign policy, Islam and
democracy in Indonesia, Journal of Indonesian Social Sciences and Humanities, Vo. 3, 2010: 37-54. Bollen, K., (1993). Liberal democracy: validity and method
factors in cross-national measures, American Journal of Political Science, Vol. 37, No. 4, November 1993: 1207-1230. Carter, A., & Stokes, G., (2002). Democracy and citizenship, in democratic theory today: challenges for the 21st century, Carter, A., & Stokes (ed), Cambridge: Polity Press. Cho, W.K.T., Gimpel, J.G., & Dyck, J.J., (2006).
residential concentration, political socialization, and voter Turnout, he Journal of Politics, Vol. 68, No. 1, February 2006: 156-167. Clinton, J.D., & Lapinski, J.S., (2004). “Targeted”
advertising and voter turnout: an experimental study of the 2000 presidential election, he Journal of Politics, Vol. 66, No. 1, February 2004: 69-96. Cox, R.K., (2002). Political Geography: Territory, State,
and Society, Blackwell Publishers, Oxford, UK. Darmoval, D., (2006). he political geography of
social media on political participation and candidate image evaluations in the 2012 Iowa caucuses, American Behavioral Scientist, XX(X): 1-15. Rhoads, E, (2012). Women’s political participation
in Indonesia: decentralization, money politics and collective memory in Bali, Journal of Current Southeast Asian Afairs 2/2012: 35-56. Hadiz, V.R., (2004). Decentralization and democracy
in Indonesia: a critique of neo-institutionalist perspectives, Development and Change 35(4): 697-718. Hajnal, Z.L., & Lewis, P.G., (2003). Municipal institution and voter turnout in local elections, Urban Afairs Review, Vol. 38 No. 5, May 2003: 645-668. Hidayat, S., (2007). Shadow State…? business and politics
in Banten Province [in bahasa], in Nordholt, H.S., & van Klinken G., Local Politics in Indonesia, Jakarta: KITLV Press & Yayasan Obor Indonesia. Hillman, B., (2011). Electoral governance and
democratic consolidation in Indonesia, he Indonesian Quarterly, Vol. 39, No. 2: 301-323. Knotts, H.G., dan Haspel, M., (2006). he impact of
gentriication on voter turnout, Social Science Quarterly, Vol. 27, Number 1, March 2006: 110-121. Ida, L., (2014) . Election and political evil ambition in Indonesia’s reformasi era, International Journal of Politics and Good Governance, Volume 5, No. 5.4 Quarter IV: 1-24. Jenkins, J.A., & Sala, B.R., (1998). he spatial theory of voting and the presidential election of 1824, American Journal of Political Science, Vol. 42, No. 4, October 1998: 1157-1179. Jones, M., et al (2004). An introduction to political geography: space, land and politics, Routledge: New York. Landry, P.F., & Davis, D., (2010). Elections in
rural China: competition without parties, Comparative Political Studies, XX(X): 1-28. Lassen, D.D., (2005). he efect of information on voter turnout:
evidence from a natural experiment, American Journal of Political Science, Vol. 49, No. 1 (Jan, 2006): 103-118. Mead, L.M., (2004). State political culture and welfare reform, he Policy Studies Journal, Vol. 32, No. 2, 2004; 271-296. Miller, H.J., (2004). Tobler’s First Law and Spatial
Analysis, Annuals of the Association of Americal Geographers, 94(2004): 284-289 Montero, A.P., (2010). No country for letist? clientelist
continuity and the 2006 vote in the brazilian northeast, Journal of Politics in Latin America, 2,2: 113-153. Mwinyi, M.O., & Kayunze, K.A., (2014). Civic education signiicantly associated with turnout in general election in Marogoro urban constituency, Tanzania, Research on Humanities and Social Sciences, Vol. 4, No. 13: 68-76. Newman, B.J., Jhonson, J., Lown, P.L., (2013). he “daily
grind”: work, commuting, and their impact on political participation, American Politics Research, 42: 141-170 O’Loughlin, J., Flint, C., & Anselin, L., (1994). he geography of
the Nazi vote: context, confession, and class in the reichstag election of 1930, Annals of the Association of American Geographers, Vol. 84, No. 3 (Sept., 1994): 351-380. O’Loughlin, J., (2003). Spatial Analysis in Political Geography,
in Agnew, J., Mitchell, K., Toal, G., (ed), A Companion to Political Geography, USA: Blackwell Publishing. Peou, S., (2014). he limits and potential of liberal democratization in Southeast Asia, Journal of Current Southeast Asian Afairs, 3/2014: 19-47. Perdomo, C.J.V., (2004). he Local context and the
spatial difusion of multiparty competition in urban Mexico, 1994-2000, Political Geography 23: 403-423.
Plattner, M.F., (2010). Populism, pluralism, and liberal democracy, Journal of Democracy, Volume. 21, Number 1, January 2010, 81-92. Prahutama, A., (2014). Analysis governor election in
Central Java in 2013 with a spatial autocorrelation [in bahasa], Statistika, Vol. 2, No. 1, Mei 2014: 6-12. Preuss, G.G., (1981). he efects of density and urban
residence on voter turnout, Population and Environment, Vol. 4(4), Winter 1981: 246-265. Rashid, M.M., & Gao, Q., (2012). Determinant’s of rural
youth’s attitude and involvement in Bangladesh politics, International Journal of Humanities and Social Sciences, Vol. 2, No. 23, December 2012: 183-193. Rauf, M., et al, (2011). Measuring Democracy
Indonesia: Indonesian Democracy Index 2009 [in bahasa], Jakarta: UNDP.
Schram, A.J.H.C., (1991). Voter Behavior in Economics Perspective, Springer-Verlag: Paris. Scully, R., Jones, R.W., & Trystan, D., (2004). Turnout, participation and legitimacy in post-devolution Wales, British Journal of Political Science, Vol. 34, Issue 03, July 2004: 519-537. Smith, N., (1979). Toward a theory of gentriication a
back to the city movement by capital, not people, Journal of the American Planning Association, published online 26 Nov 2007, 45:4, 538-548. Sjaf, S., (2014). Ethnic Politics: Local Political Dynamics
in Kendari [in bahasa], Jakarta: Penerbit Obor. Slater, D., (2006). he ironies of instability in Indonesia,
Social Analysis, Vol. 50, Issue I, Spring 2006: 208-213. Soebagio, (2009). Distortions in the Transition to
Democracy in Indonesia [in bahasa], Makara, Sosial Humaniora, Vol. 13, No. 2, Desember 2009: 111-116. he Economist, (2014). Democracy Index 2014: Democracy and its Discontent, http://www.sudestada.com.uy/Content/ Articles/421a313a-d58f-462e-9b24-2504a37f6b56/ Democracy-index-2014.pdf, accessed 6 Mei 2016. ---, (2015). Democracy Index 2015: Democracy in an Age of Anxiety, http://www.yabiladi.com/img/content/ EIU-Democracy-Index-2015.pdf, accessed 6 Mei 2016. Vigna, S.D., & Kaplan, E., (2007). he Fox news
efect: media bias and voting, he Quarterly Journal of Economics, August 2007: 1187-1234. Yandri, P., (2014). Residential area and income inequality
in suburban Indonesia, Indonesian Journal of Geography, Vol. 45, No, 1, June 2014: 69-77. Zhao et al, (2006). he efect of local political culture