Volume 24, Number 1, 2009, 81 – 99
NOISE AS THE IMPACT OF TRADING MECHANISM AND
PERIODIC CLEARING PROCEDURES: SUBSTANTIVE
EVIDENCE FROM INDONESIA STOCK EXCHANGE
Sumiyana
Faculty of Economics and Business, Universitas Gadjah Mada ([email protected])
ABSTRACT
Sumiyana (2007b) investigates that noises occurred in Indonesia Stock Exchange. Especially, Sumiyanas’ research concludes that noise over trading and nontrading period, along with overnight and lunch break nontrading session, and the first and second trading session, had occurred. However, Sumiyana’s research does not identify who are responsible for the noise. This research used intraday data in Indonesia Stock Exchange. Samples of the data are the firms consecutively listed in LQ 45 indexes for the year of 2004-2006.
This research attempts to identify who are responsible for the noise. This research studies effects of trading mechanism and clearing mechanism on the stock return behaviour. Finally, this research is enabling to differentiate the effect of trading mechanism from the effect of clearing mechanism. This research concludes that periodic clearing procedure at the beginning of the trading period is noisy. Therefore, this research suggests that trading mechanism in Indonesia Stock Exchange is inefficient. This research also hopefully recommends shifting from the periodic to continuous trading mechanism. Keywords: Intraday data, trading mechanism, trading and nontrading periods, stock
return behaviour, noise, negative autocorrelation, clearing mechanism, periodic clearing procedure.
INTRODUCTION
Phenomena of trading mechanism, including the periodic clearing procedure, have been recognized for quite sometimes. Since the trading mechanism and periodic clearing procedure have significant impact on return behaviour or on stock price, the existence of noise could be considered as part of trading mechanism problem. Return behaviour would be nastiest because of noise occurrences. Previous empirical studies indicate that noiseoccurred within the context of negative autocorrelation values such as (1) negative autocorrelation between the return of trading period and its previous periods (Amihud & Mendelson, 1991; Huang, Liu &
Fu, 2000), and (2) negative correlation of daily return (Guner & Onder, 2002). It means that if the autocorrelation was negative, the noisecondition cannot be avoided.
now called as Indonesian Stock Exchange (IDX), the periodic trading mechanism is still in use (morning and afternoon periods). It can be inferred that the Indonesia Stock Exchange still does not consider the advantages of non-periodic trading system.
Sumiyana (2007b) conducted a research on periodic trading mechanism documents that high return volatility had caused noise occurrences. In particular, he suggests that
noise at Indonesian Stock Exchange occurred during morning and afternoon trading periods. Therefore, if the management still reluctant to change it periodic trading systems, Indonesian Stock Exchange could not escape from the noise occurrences. Several similar studies investigate to periodic trading mechanism and conclude that this mechanism is not efficient (Amihud & Mendelson, 1991; Amihud, Mendelson & Murgia, 1990). Both studies conclude that trading mechanism including periodic clearing procedures cause noise.
Sumiyana (2007b) have limitations in his investigating noise occurrences. He had failed to identify the main causes of the noise occurrences. His research so far did not reveal the data and reasons why the noise occurs. He only assumed that the noise could be triggered by two indicators: periodic trading mechanism and transaction clearing procedure during each trading period or the combination of both. Furthermore, the noise was influenced by the combination of periodic trading mechanism and transaction clearing procedure. Because of those impacts, the noise would be more permanent and much higher. This level of noise, however, could be substantiated statistically.
If the noise is really influenced by firms’ fundamental value, the stock price will automatically reverse to the previous price for the next period. By having so, the return level will positively auto-correlated to the others or the noise will not materialize for the next trading period (Amihud & Mendelson, 1991; Chelley & Steeley, 2001). Nevertheless, the
influence is caused by the trading mechanism, the noise will occur in a longer period or in a permanent circumstance. It can be interpreted that noise will occur permanently whether both trading mechanism and periodic clearing procedures are still applied in this stock exchange. Sumiyana (2007b) concludes irrevocably that noise have occurred for long periods in the year of 1999-2006. Therefore, it could be inferred that noise would always take place whenever market still adopt periodic trading mechanism and periodic clearing transaction systems.
This research investigates stock return volatilities reflected by noise occurrences by using intraday data from the IDX. Noise would be investigated by the existence of price reversion indicated by negative autocorrelations or negative partial-adjustment coefficients. Subsequently, this study searches main factors caused noise occurrences. This searching process were conducted by diffe-rentiate between noise caused by trading mechanism and noise caused by periodic clearing procedure. Although, this study will possibly conclude that noise initiated by combination of both main factors.
Research Purposes
High stock return volatilities in IDX were used as research subjects by investigating specifically to noise occurrences. Meanwhile, IDX uses trading mechanism that are two trading periods, morning trading session and afternoon trading session. Noise would be differed to its main factor that contributes directly to its noises’ magnitudes. By using intraday data, this study investigates stock return volatility reflected from noise occurrences at the IDX. Among the aims of the research are:
2. Identifying main factor that causes the noise occurrences within two categories; noise that caused either by trading mecha-nism or by periodic clearing transaction procedures.
Research Benefits
The research is worth for the investor and potential investors to analyze their asset-investment and to predict the feasibility of their assets. This study will also recommend traders to be more conservative in their trading at the IDX, because the IDX still adopts periodic trading mechanism. This study will gain information whether noise occurs or not. The second advantage of the research is to provide return information reliability related to investment decisions, particularly, the return during the trading period. Furthermore, this study also suggests that adopted trading mechanism in the IDX is not efficient systems. Therefore, this study offers an alternative option to the IDX to shift its periodic trading mechanism into non-periodic trading mechanism.
LITERATURE REVIEW AND HYPOTHESES DEVELOPMENT
Noise
Price and stock return do not only always represent the information from informed traders, but also represent information from noise traders. Noise traders set a price cumulatively to stock prices. However, stock prices will reverse to their fundamental values in the next time. The more stock prices vary from their fundamental values, there would be reversed to their fundamental values (Black, 1986). Several stock market anomalies such as stock return volatility and price mean’s reversion in the stock market can be explained by noise traders’ behaviours. To overcome this problem, the stock market usually used professional arbitrary. Professional arbitrary usually responds to noise trading that do not exist in informed trading. Nevertheless, it
needs a lot of human resources to check out and predict the asymmetric signals that commonly used by noise traders.
Noise traders may sometimes made untruthful forecast on their return variance distributions. By having such misinter-pretation, they collectively accumulate higher return than the rational investors have. They can survive and dominate the stock market within long term asset together with its risk takers. Noise-based trading strategy is potential for initiating instability in the stock prices and it pushes the prices much higher than their fundamental prices if the noise traders make a herd. Nevertheless, the price will be stable if informed traders are strong enough to prevent stock prices increase swiftly from their fundamental values. The studies on herd indicated that the group often considers the stabilizing price as permanent price. Therefore, the herd fosters price stability and protects the stock price from instability situation (Harsono, 2003).
Chelley & Steeley (2001) investigates noise occurrences by arguing that opening return possesses higher volatility and it negatively correlates with closing return. The clauses are caused by overreaction behaviour and the noise, so that opening return behaviours are different from closing return behaviours. It means that the opening price errors can be corrected directly at the next trading period. If there is noise, the increased stock price at a certain trading period will be followed by price reversion at non-trading period and so does vice versa. The differences between the noise and information arrivals were detected through a different correlation value of current trading period and previous trading periods (Amihud & Mendelson, 1991; Sumiyana, 2007a). The negative autocorre-lation does indicate the occurrence of noise,
Sumiyana (2007b) has found substantive proof of the noise occurrence patterns or the prototype of the information arrival at the Indonesian Stock Exchange. He states that the first patterns are the noise occurs within the interval of one, two, and three previous periods either at trading or non-trading session. There is no noise occurrence at the lag of four previous periods before. The second model is that the noise occurrence is resembled to one interval of previous periods. The third one is that the information arrival or the absence of noise is valued as the same pattern with four previous periods or it has the one day lags.
Trading Mechanism
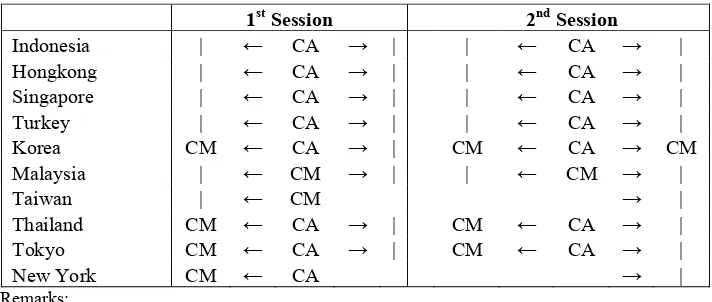
Trading mechanism vary from one country to another. NYSE (New York Stock Exchange), for example, the government used non-period trading mechanism. This trading runs without afternoon non-trading pauses. Meanwhile, Indonesia Stock Exchange (IDX) uses different trading mechanism; the opening and closing were determined by periodic continuity of two times a day. It implies that there are two opening prices and two closing prices at each period.
The following figure shows the diffe-rences between Indonesia stock exchange and other countries stock exchange.
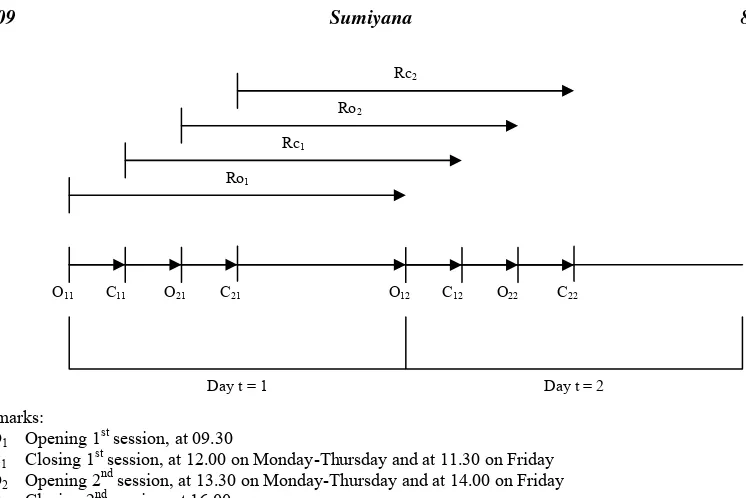
Trading period is not the same for each day. Figure 2 below illustrates some trading periods including morning session, afternoon session, second session, non-trading period, afternoon break session, overnight break session, return value, closing price, etc.
Noise in the Trading Mechanism
Trading mechanism is able to influence stock price volatilities. Such mechanism affects dominant differences between close-to-close return variances in comparison with open-to-open return variances. There are four return variances used to analyze return volatilities of one day trading period; the return of opening price and closing price of trading period (O1 and C1) and the return at the
afternoon trading period (O2 and C2). The
variance ratio was used to analyze information arrival dissemination in which the highest return variance occur as it is connected to the noise of one day and to the previous day (Guner & Onder, 2002).
1st Session 2nd Session
Indonesia | ← CA → | | ← CA → |
Hongkong | ← CA → | | ← CA → |
Singapore | ← CA → | | ← CA → |
Turkey | ← CA → | | ← CA → |
Korea CM ← CA → | CM ← CA → CM
Malaysia | ← CM → | | ← CM → |
Taiwan | ← CM → |
Thailand CM ← CA → | CM ← CA → |
Tokyo CM ← CA → | CM ← CA → |
New York CM ← CA → |
Remarks:
CM: Call Market Method; CA: Continuous Auction Method
Source: Amihud & Mendelson (1991), Chang, Hsu, Huang, & Rhe (1999), and Guner & Onder (2002)
Remarks: O1 Opening 1
st
session, at 09.30
C1 Closing 1st session, at 12.00 on Monday-Thursday and at 11.30 on Friday O2 Opening 2
nd
session, at 13.30 on Monday-Thursday and at 14.00 on Friday C2 Closing 2nd session, at 16.00
Rijt ln (Pij,t/Pij,t-1) is return of transaction ij (i=o foro opening, c for closing; j=1 for 1 st
session, 2 for 2nd) from day (t-1) to t.
Source: Amihud & Mendelson (1991), Chang, Hsu, Huang & Rhe (1999), and Guner & Onder (2002)
Figure 2. Transaction Period at BEI
Amihud & Mendelson (1987a), Stoll & Whaley (1990), and Sumiyana (2007a) find the phenomena that return variance at the open-to-open period is higher than close-to-close period. Amihud & Mendelson (1987a) explain that such price patterns were caused by different trading mechanism which adopted by stock exchange in determining the prices. Amihud & Mendelson (1987a) and Stoll & Whaley (1990) suggest the hypothesis of trading mechanism by comparing return variance of open-to-open and return variance of close-to-close of the stock that listed at NYSE, because the NYSE has adopted both trading mechanisms. The opening price was determined by call market mechanism, while closing price was identified through conti-nually non periodic trading method. The results of their research empirically proved that return variance of open-to-open period are much higher than those of close-to-close period. The hypothesis of trading mechanism is supported.
Return variance are also employed to analyze stability of information arrivals or the noise for a particular day (Guner & Onder, 2002). If the information arrivals are able to generate return volatilities, the sum total of daily volatilities counted from opening price and closing price should be balance. Besides, the open-to-open return variance and close-to-close return variance can be acted as the tool for finding out the influence of trading mecha-nism (Amihud & Mendelson, 1987a). The differences of trading mechanism between opening and closing trading at Tokyo Stock Exchange(TSE) have caused different volati-lities between open-to-open return and those of close-to-close return. Trading mechanism as well as closing clearing systems could not be analyzed because IDX uses continuous trading systems, that prices from the previous trading periods are used to determine the prices in the subsequent trading periods.
Lam & Tong (1999) states that the opening prices are more volatile than the O11 C O11 C21 21 O12 C O12 C22 22
Ro1 Rc1
Ro2 Rc2
closing price because of monopoly power specialist and the absence of trading activities. Guner & Onder (2002) also explain that the open-to-open return variance at the ISE (Istanbul Stock Exchange) was higher than open-to-open return variance of the first and the second sessions. Since there are no differences of trading procedure at the first and afternoon break session, so the return volatilities is triggered by the absence of trading activities over previous non-trading period. Therefore, return variances could be used as tools to measure the tendency of noise occurrences (Amihud & Mendelson, 1991).
Regarding the increasing price of stock without any fundamental changes, noise hypothesis has already postulated that the price will be set back to the previous price for next periods or the return figure is positively correlated. The hypothesis on the information arrivals also had mentioned that the price differences caused by the new information arrivals do not make any set back price (Bery & Howe, 1994; French & Roll, 1986; Nofsinger, 2001; Frino & Hill, 2001; Suhaibani & Kryzanowski, 2000). Statis-tically, when the information arrivals only influence the stock price for one period, its autocorrelation will be zero. On the other hand, if the information arrival affects the stock within a longer period (more than one period), its autocorrelation will be positive. Based on the explanation above, the researcher draws hypotheses below.
Ha1: There would be negative autocorrelation
(noise) between opening return of morning trading period and that of previous morning trading period.
Ha2: There would be negative autocorrelation
(noise) between closing return of morning trading period and that of previous morning trading period.
Ha3: There would be negative autocorrelation
(noise) between opening return of afternoon trading period and that of previous afternoon trading period.
Ha4: There would be negative autocorrelation
(noise) between closing return of afternoon trading period and that of previous afternoon trading period.
The Influence of Trading Mechanism
Indonesia Stock Exchange has two session trading periods and two break-session periods: morning and afternoon session, afternoon-break and overnight-afternoon-break sessions. Those various sessions influence the stock return behaviours which are signified by trading mechanism during long-overnight break and short-afternoon break. These performances are also affected by transaction procedure of periodic clearing system at two sessions (Amihud & Mendelson, 1987a, 1987b, 1991; Stoll & Whaley, 1990; Gunner & Onder, 2002; Chelley & Steeley, 2001).
The clearing time of transaction may influence the stock return behaviour. The reasons can be explained that in a continuous trading, the price adjustment that is usually made by the brokers can be used for observing the future transaction together with its stock price changing (Amihud & Mendelson, 1991; Chelley & Steeley, 2001). In other side, information of opening stock price is provided at the beginning trading period only (single-shot) without a continuous observation on the following transactions that show uninterrupted stock value changing (Amihud & Mendelson, 1991; Chelley & Steeley, 2001).
Stock return volatilities at the opening and closing prices are useful to investigate efficient pricing process finding out the balance of demand and supply stock. In addition, partial-adjustment coefficients bet-ween opening return or closing return at a particular day and that of preceding trading day; to investigate return behaviours may also use residual return. Variance and auto-correlation returns can also be used to estimate efficient return behaviour in transaction clearing procedure (Amihud & Mendelson, 1991; Chelley & Steeley, 2001). This reasoning is that returns residual variance and autocorrelation are used to describe the inter-dependency among periods which are not reflected into fundamental stock values.
To calculate the return variance and return residual autocorrelation, this study uses ordinary linear regression to associate firm individual return and market return. The regression test was done specifically to each trading mechanism i in session j. The regression equation was Rijt = αij + βijRMijt +
eijt, in which RMijtis average market return for all companies listed on the stock exchange in the trading period of i, session of j, and the day of t. Moreover, having the amount of return variance, this study initiates correlation test among residual return variances. The residual returns inter-dependency between one period and the other periods indicated the efficient level of periodic transaction clearing procedure (Amihud & Mendelson, 1991; Chelley & Steeley, 2001).
The efficiency was measured from the return residual inter-dependency among the trading periods that have been conducted periodically. The analysis was administered through return residual autocorrelation among the trading periods. Low efficiency is indicated by negative autocorrelation between return residual of a certain trading period with its preceding periods. It can be concluded that there has been noise (negative autocorrelation) among trading periods (Amihud &
Mendelson, 1991; Chelley & Steeley, 2001). High efficiency, on the other hand, is indicated by positive autocorrelation between return residual of the trading period and those of preceding (Amihud & Mendelson, 1991; Chelley & Steeley, 2001). In other words, there is no dependent condition among returns residual or there has been conditional interdependence of return residual.
To differentiate the lower or the higher efficiency, this study theorizes some hypotheses as follows.
Ha5: There would be negative autocorrelation
(noise) between residual returns of opening period in the morning session and those of previous opening periods.
Ha6: There would be negative autocorrelation
(noise) between residual returns of closing period in the morning session and those of previous closing periods.
Ha7: There would be negative autocorrelation
(noise) between residual returns of opening period in the afternoon session and those of previous opening periods.
Ha8: There would be negative autocorrelation
(noise) between residual returns of closing period in the afternoon session and those of previous closing periods.
RESEARCH METHOD
Data and Sample
actively traded stock over the morning and afternoon sessions.
Based on the criteria above, there were only 25 individual stocks that fulfilled the research prerequisites. Here are the detail; AALI (Astra Agro Lestari, Tbk), ANTM (Aneka Tambang), ASII (Astra), BBCA (Bank Central Asia), BDMN (Bank Danamon), BNII (Bank BNI), BRPT (Barito Pasific Pulp & Timber), BUMI (Bumi Resources), GGRM (Gudang Garam), GJTL (Gajah Tunggal), INCO (International Nickel), INKP (Indah Kiat Pulp), INTP (Indocement), KIJA (Kawasan Industri Jababeka), KLBF (Kalbe Farma), PNBN (Bank Pan), PTBA (Tambang Batubara), RALS (Ramayana Lestari), SMCB (Semen Cibinong), SMRA (Summarecon Agung), TKIM (Tjiwi Kimia), TLKM (Telkom Indonesia), UNTV (United Tractor), dan UNVR (Unilever).
The data used in the research could be classified into secondary data, because they were taken from intraday data of stock price at the opening and closing periods during the first (morning) and the second (afternoon) sessions. The data were collected by using documentation techniques in which the researcher collects the written evidence from various sources, copies the document, and observes stock figures. Intraday data were collected from Indonesia Stock Exchange (IDX) and from the library of doctorate program, Faculty of Economics and Business, Universitas Gadjah Mada.
Operational Definitions
Opening and Closing at every session
What this study means by opening and closing prices are the first and the latest prices at the morning and afternoon sessions which are identified from its first or latest transaction. If there is more than one transaction at the same time, for the opening price, the smallest transaction number will be considered as the first transaction. In other side, for the closing price, the biggest
transaction number will be considered as the latest transaction. Therefore, in this research, there are four types of prices at each day: opening price of the first session (PO1), closing
price of the first session (PC1), opening price
of afternoon session (PO2) and closing price of
afternoon session (PC2).
Return
Return is determined by natural logarithm of relative price Rt= ln(Pt/Pt-1). To calculate opening and closing return at a certain trading day, the period is divided into four categories: two opening return (RO1 dan RO2) and two
closing return (RC1 dan RC2), so for the daily
equation the researcher uses;
Return of Opening Price at the first session:
RO1, t = ln(PO1, t /PO1, t-1)
Return of Closing Price at the first session:
RC1, t = ln(PC1, t /PC1, t-1)
Return of Opening Price at the second session:
RO2, t = ln(PO2, t /PO2, t-1)
Return of Closing Price at the second session:
RC2, t = ln(PC2, t /PC2, t-1)
ResidualReturn
The calculation of return residual is made by applying regression equation Rijt = αij + βijRMijt + eijt, where RMijt is the average market return of all companies during the trading period of i session of j, and on day of t. The estimated results of the return residual then were used for calculating residual return variance.
Data Analysis Procedure
The data were analyzed by using the following procedures;
2. Deleting transaction days around earning and dividend announcements to avoid extreme price fluctuation (t-3 and t+3), and
make some adjustments on stock dividend,
stock split, bonus share, as well as on the stock reserve split when it occurs.
3. Examining return autocorrelation in order to get indication of noise occurrences by testing;
a. Between opening return of a certain trading period and opening return of previous day, and
b. Between closing return of a certain trading period and closing return of previous day.
4. Conducting regression test by using the regression equation above in order to estimate residual return of each opening and closing returns.
5. Examining partial-adjustment of return residual to find out the existence of the noise occurrences by;
a. Testing opening return residual and its preceding period.
b. Testing closing return residual and its preceding period.
RESULTS AND DISCUSSION
Descriptive Statistics
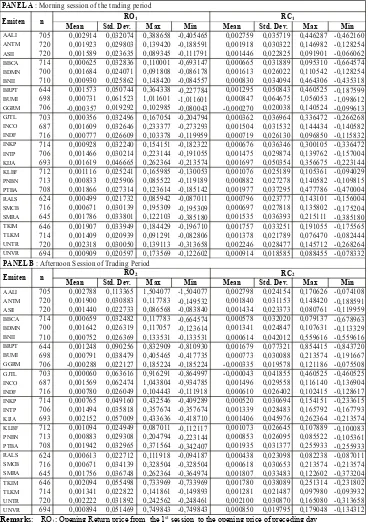
From 45 firms registered at the Indonesia Stock exchange during 2004-2006, there are only 25 individual securities that are eligible for the experiment with 17,428 observations (multiplication of types of return period, trading sessions, trading day in one year, number of year, and number of sample). First of all, descriptive statistic shows the opening and closing returns at a daily trading consisted of four categories; opening return of the second session (RO1), closing return of the
second session (RC1), opening return of fourth
session (RO1), and closing return of the fourth
session (RC2). Detailed descriptive statistics
presented on table 1 below.
It could be implied from table 1 that there were 700 days of observation given to each individual stock, mean return of opening price on morning session and its closing price, opening price of afternoon session and its closing price as well. It is noticed on this table that the opening mean return of AALI on morning session (RO1 ) was 0.002914, RC1
was 0.002759, RO2 was 0.002788, and RC2
was 0.002798. It means that its standard deviation, maximum and minimum price were not extremely varied one and another. The scores were relatively equal. The standard deviation of the AALI opening return was 0.032074 for morning session and 0.035719 for its closing return; its afternoon session indicated the figure of 0.113365 for opening and 0.024154 for closing session. The maximum returns of each session respectively were 0.388658, 0.646287, 1.504077, and 0.170626. Their minimum returns for every session were given in succession 0.405465, -0.462160, -1.504077, and -0.074108.
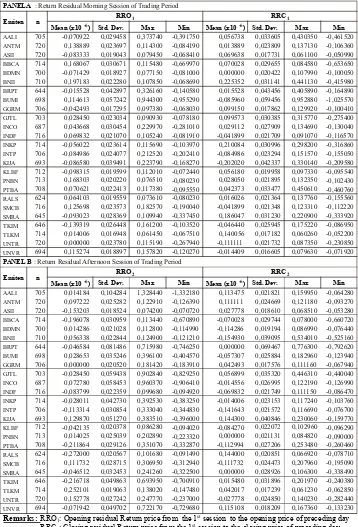
Return residual results were identified from four main trading periods: morning and afternoon, opening and closing periods. By using the regression equation, this study constructs the residual return for opening price of the second session (RRO1) and its closing
price (RRC1), residual return for opening price
of the fourth session (RRO1) and its closing
price (RRC2). The detail statistics figures were
illustrated in Table 2.
It can be inferred from table 2 that descriptive statistics show residual return has the same indication to those of return --- mean residual return of morning opening session and its closing session, residual return of afternoon opening session and its closing session. From the table, it is observed, for example, the ANTM companies achieved mean return (RRO1) at the figure of
0.138889(x10-6), RRC1 at 0.013889(x10-6),
RRO2 at 0.097222(x10-6), and RRC2 at
Tabel 1. Descriptive Statistic of Return During the Opening and Closing of Trading Periods
Mean Std. Dev. Max Min Mean Std. Dev. Max Min
AALI 705 0,002914 0,032074 0,388658 -0,405465 0,002759 0,035719 0,446287 -0,462160 ANTM 720 0,001923 0,029803 0,139420 -0,188591 0,001918 0,030322 0,146982 -0,128254 ASII 720 0,001589 0,023635 0,089345 -0,111791 0,001446 0,022825 0,091901 -0,066062 BBCA 714 0,000625 0,032836 0,110001 -0,693147 0,000665 0,031889 0,095310 -0,664574 BDMN 700 0,001684 0,024071 0,091808 -0,086178 0,001613 0,026022 0,110542 -0,128254 BNII 710 0,000930 0,025862 0,148420 -0,084557 0,000830 0,034094 0,464306 -0,435318 BRPT 644 0,001573 0,050744 0,364338 -0,227784 0,001295 0,050843 0,460525 -0,187599 BUMI 698 0,000731 0,061523 1,011601 -1,011601 0,000847 0,064675 1,056053 -1,098612 GGRM 706 -0,000357 0,019292 0,102985 -0,080043 -0,000270 0,020038 0,140524 -0,099613 GJTL 703 0,000356 0,032496 0,167054 -0,204794 0,000362 0,036964 0,336472 -0,266268 INCO 687 0,001609 0,032646 0,233377 -0,273293 0,001504 0,031532 0,144434 -0,140582 INDF 716 0,000777 0,026609 0,103378 -0,119959 0,000719 0,026130 0,096850 -0,115832 INKP 714 0,000928 0,032240 0,154151 -0,182322 0,000676 0,036346 0,300105 -0,336472 INTP 706 0,001466 0,030214 0,223144 -0,191055 0,001475 0,029874 0,139762 -0,157004 KIJA 693 0,001619 0,046665 0,262364 -0,213574 0,001697 0,050354 0,356675 -0,223144 KLBF 712 0,001116 0,025241 0,165985 -0,130053 0,001076 0,025189 0,105361 -0,094029 PNBN 713 0,000833 0,025906 0,085522 -0,119189 0,000882 0,027278 0,140582 -0,109815 PTBA 708 0,001866 0,027314 0,123614 -0,185142 0,001977 0,037295 0,477786 -0,470004 RALS 624 0,000499 0,021732 0,085942 -0,087011 0,000796 0,023777 0,143101 -0,156004 SMCB 716 0,000671 0,030139 0,195309 -0,195309 0,000697 0,027818 0,135802 -0,175204 SMRA 645 0,001786 0,033801 0,122103 -0,385180 0,001535 0,036393 0,215111 -0,385180 TKIM 646 0,001907 0,033949 0,184429 -0,196710 0,001757 0,033251 0,191055 -0,175565 TLKM 714 0,001409 0,020939 0,091291 -0,082806 0,001378 0,021789 0,076470 -0,082444 UNTR 720 0,002318 0,030050 0,139113 -0,313658 0,002246 0,028477 0,145712 -0,268264 UNVR 694 0,000909 0,020597 0,173569 -0,122602 0,000914 0,018585 0,088455 -0,078332
Mean Std. Dev. Max Min Mean Std. Dev. Max Min
AALI 705 0,002788 0,113365 1,504077 -1,504077 0,002798 0,024154 0,170626 -0,074108 ANTM 720 0,001900 0,030883 0,117783 -0,149532 0,001840 0,031153 0,148420 -0,188591 ASII 720 0,001440 0,022733 0,086568 -0,083840 0,001434 0,023373 0,080761 -0,119959 BBCA 714 0,000659 0,032482 0,117783 -0,664574 0,000578 0,032020 0,079137 -0,678963 BDMN 700 0,001642 0,026319 0,117057 -0,123614 0,001341 0,024847 0,107631 -0,113329 BNII 710 0,000752 0,026369 0,133531 -0,133531 0,000614 0,042012 0,559616 -0,559616 BRPT 644 0,001248 0,090256 0,832909 -0,810930 0,001679 0,077321 0,854415 -0,843720 BUMI 698 0,000791 0,038479 0,405465 -0,417735 0,000773 0,030088 0,213574 -0,191667 GGRM 706 -0,000288 0,022127 0,185224 -0,185224 -0,000335 0,019578 0,121186 -0,075508 GJTL 703 0,000060 0,063616 0,916291 -0,864997 -0,000043 0,041855 0,460525 -0,460525 INCO 687 0,001569 0,062474 1,043804 -0,934785 0,001496 0,029558 0,116140 -0,136904 INDF 716 0,000780 0,026049 0,104443 -0,111918 0,000610 0,026402 0,102415 -0,128617 INKP 714 0,000765 0,049160 0,432546 -0,409289 0,000520 0,030694 0,154151 -0,233615 INTP 706 0,001494 0,035818 0,357674 -0,357674 0,001339 0,028483 0,165792 -0,167793 KIJA 693 0,002152 0,057009 0,433636 -0,418710 0,001406 0,045976 0,262364 -0,213574 KLBF 712 0,001094 0,024949 0,087011 -0,112117 0,001073 0,026645 0,107889 -0,100083 PNBN 713 0,000883 0,029308 0,204794 -0,223144 0,000853 0,026095 0,085522 -0,105361 PTBA 708 0,001942 0,032965 0,371564 -0,342407 0,001935 0,031377 0,255933 -0,255933 RALS 624 0,000613 0,022712 0,111918 -0,094187 0,000438 0,023098 0,082238 -0,087011 SMCB 716 0,000671 0,034139 0,328504 -0,328504 0,000618 0,030653 0,213574 -0,213574 SMRA 645 0,001756 0,036748 0,262364 -0,364974 0,001807 0,033483 0,122602 -0,373204 TKIM 646 0,002094 0,055498 0,733969 -0,733969 0,001780 0,038089 0,251314 -0,231802 TLKM 714 0,001341 0,022822 0,141861 -0,149893 0,001281 0,021487 0,097980 -0,093932 UNTR 720 0,002222 0,031892 0,242562 -0,248461 0,002100 0,030870 0,165080 -0,313658 UNVR 694 0,000894 0,051469 0,749843 -0,749843 0,000850 0,019795 0,179048 -0,134312 PANEL A : Morning session of the trading period
RC1
RO2 RC2
RO1
PANEL B : Afternoon Session of Trading Period
Emiten n
Emiten n
Remarks: RO1: Opening Return price from the 1st session to the opening price of preceding day
Tabel 2. Descriptive Statistic of Residual Return on Opening and Closing Sessions
Mean (x10-6) Std. Dev. Max Min Mean (x10-6) Std. Dev. Max Min
AALI 705 -0,070922 0,029458 0,373740 -0,391750 0,056738 0,033605 0,430350 -0,461520 ANTM 720 0,138889 0,023697 0,114300 -0,084190 0,013889 0,023809 0,137130 -0,106360 ASII 720 -0,083333 0,019043 0,079450 -0,068410 0,069638 0,017731 0,061100 -0,050990 BBCA 714 0,168067 0,030671 0,115480 -0,669970 0,070028 0,029655 0,084580 -0,653650 BDMN 700 -0,071429 0,018927 0,077150 -0,081000 0,000000 0,020422 0,107990 -0,100050 BNII 710 0,197183 0,022280 0,107850 -0,068690 0,225352 0,031141 0,441130 -0,415980 BRPT 644 -0,015528 0,042897 0,326160 -0,140580 0,015528 0,043456 0,405890 -0,164890 BUMI 698 0,114613 0,057242 0,944300 -0,955290 -0,085960 0,059456 0,952880 -1,025570 GGRM 706 -0,042493 0,017295 0,097380 -0,068030 0,099150 0,017862 0,129920 -0,100410 GJTL 703 0,028450 0,023034 0,090930 -0,078180 0,099573 0,030385 0,315770 -0,275400 INCO 687 0,043668 0,030454 0,229970 -0,281010 0,029112 0,027909 0,134690 -0,130040 INDF 716 0,069832 0,021070 0,105240 -0,081910 -0,041899 0,021709 0,091070 -0,116570 INKP 714 -0,056022 0,023614 0,115690 -0,103970 0,210084 0,030996 0,298200 -0,316860 INTP 706 -0,084986 0,024077 0,212520 -0,202410 -0,084986 0,023294 0,151570 -0,155050 KIJA 693 -0,086580 0,039491 0,223790 -0,168270 -0,202020 0,042337 0,330140 -0,209580 KLBF 712 -0,098315 0,019599 0,112010 -0,072440 0,056180 0,019958 0,097330 -0,095540 PNBN 713 0,168303 0,020220 0,076510 -0,080230 0,028050 0,021895 0,132350 -0,102430 PTBA 708 0,070621 0,022413 0,117380 -0,095550 0,042373 0,033477 0,450610 -0,460760 RALS 624 0,064103 0,019559 0,073610 -0,080230 0,016026 0,021364 0,137760 -0,155560 SMCB 716 0,125698 0,023573 0,182570 -0,190040 -0,041899 0,021348 0,123310 -0,112220 SMRA 645 -0,093023 0,028369 0,109940 -0,337450 0,186047 0,031230 0,220900 -0,333920 TKIM 646 -0,139319 0,026448 0,161200 -0,103520 -0,046440 0,025945 0,175220 -0,086950 TLKM 714 0,014006 0,016948 0,061450 -0,067510 0,140056 0,017182 0,060260 -0,052200 UNTR 720 0,000000 0,023780 0,115190 -0,267940 -0,111111 0,021732 0,087350 -0,230850 UNVR 694 0,115274 0,018897 0,157820 -0,120270 -0,014409 0,016605 0,079630 -0,071920
Mean (x10-6) Std. Dev. Max Min Mean (x10-6) Std. Dev. Max Min
AALI 705 0,014184 0,104284 1,328440 -1,332180 0,113475 0,021821 0,159950 -0,064280 ANTM 720 0,097222 0,025282 0,122910 -0,126390 0,111111 0,024669 0,121180 -0,093270 ASII 720 -0,153203 0,018524 0,074200 -0,070720 0,027778 0,018610 0,068510 -0,053280 BBCA 714 -0,196078 0,030959 0,113440 -0,670890 -0,070028 0,029744 0,078000 -0,660720 BDMN 700 0,014286 0,021028 0,112800 -0,114990 -0,114286 0,019194 0,086990 -0,076440 BNII 710 0,056338 0,022844 0,124900 -0,121210 -0,154930 0,039095 0,534010 -0,525160 BRPT 644 -0,046584 0,081486 0,715980 -0,746250 0,000000 0,069467 0,776300 -0,792620 BUMI 698 0,028653 0,035246 0,396100 -0,404570 -0,057307 0,025884 0,182960 -0,123940 GGRM 706 0,000000 0,020520 0,181420 -0,183910 0,042493 0,017576 0,111160 -0,067940 GJTL 703 -0,028450 0,059438 0,902840 -0,829250 0,056899 0,035320 0,446310 -0,440040 INCO 687 0,072780 0,058453 0,960370 -0,906410 -0,014556 0,026995 0,122190 -0,126990 INDF 716 -0,083799 0,022359 0,099680 -0,094920 -0,069832 0,021749 0,111150 -0,086470 INKP 714 -0,028011 0,042730 0,392530 -0,383250 -0,014006 0,023153 0,117240 -0,103760 INTP 706 -0,113314 0,030854 0,333040 -0,344830 -0,141643 0,021572 0,116690 -0,076700 KIJA 693 0,129870 0,051270 0,383510 -0,396000 0,144300 0,040846 0,230060 -0,159770 KLBF 712 -0,042135 0,020378 0,086280 -0,094020 -0,084270 0,022072 0,102960 -0,096290 PNBN 713 0,014025 0,025039 0,202890 -0,223320 0,000000 0,021131 0,084820 -0,090000 PTBA 708 -0,211864 0,029126 0,351070 -0,332870 -0,112994 0,027206 0,253480 -0,260460 RALS 624 -0,272000 0,020567 0,101680 -0,091490 0,144000 0,020851 0,066920 -0,078710 SMCB 716 0,111732 0,028715 0,306950 -0,312940 -0,111732 0,024473 0,207960 -0,195090 SMRA 645 -0,046512 0,032453 0,241260 -0,322500 0,000000 0,028926 0,106300 -0,338490 TKIM 646 -0,216718 0,049863 0,693950 -0,700910 0,015480 0,031896 0,201970 -0,240380 TLKM 714 0,252101 0,019063 0,138020 -0,147480 0,042017 0,017239 0,061230 -0,062850 UNTR 720 0,152778 0,027242 0,247770 -0,237000 -0,027778 0,024850 0,140230 -0,282440 UNVR 694 -0,071942 0,049702 0,722170 -0,729680 0,115108 0,018209 0,167360 -0,133230
PANEL B: Return Residual Afternoon Session of Trading Period
PANEL A: Return Residual Morning Session of Trading Period
RRO2 RRC2
Emiten n
Emiten n RRO1 RRC1
Remarks: RRO1: Opening residual Return price from the 1st session to the opening price of preceding day
It means that ANTM’s standard deviation, maximum and minimum price were not highly distributed. The standard deviation of the ANTM opening residual return was 0.023679 for morning session and 0.023809 for its closing return; its afternoon session indicated the figure of 0.025282 for opening and 0.024669 for closing session. The maximum residual returns of each session were 0.114300, 0.137130, 0.122910 and 0.121180. The minimum residual return for every session
were given respectively; -0.084190, -0.106360, -0.126390, and -0.093270.
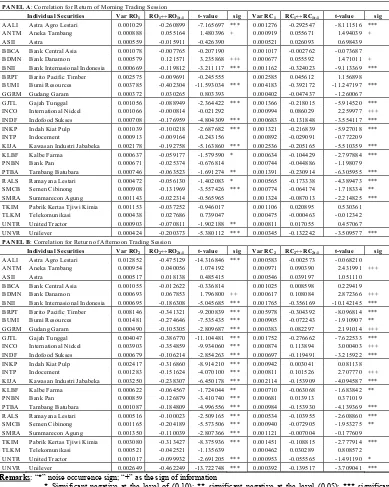
Noise Tests of Opening and Closing Return
There has been noise occurrence that is partial-adjustment between opening return (ROi,t) and the opening return of its preceding
day (ROi,t-1). The occurrences were
high-lighted by using the mark”*, **, ***”. Detailed noise test results of 25 samples such as return correlation for opening of morning price (RO1t ↔ RO1t-1) and its closing price
(RC1t↔RC1t-1), return correlation for opening
of afternoon session (RO2t↔ RO2t-1) and its
closing price (RC2t ↔RC2t-1) are given on
table 3. In panel A, there are 13 individual securities that have noise for the correlation price during opening of morning session (RO1t ↔RO1t-1) or approximate to 52%. This figure
is dominant enough compared to foreign stock exchanges (seen from the research of Amihud & Mendelson, 1991). There is also noise that correlated to closing return of afternoon session (RC1t ↔ RC1t-1). The figure is
relatively the same with opening and closing of noise return. Furthermore, there are only 12 individual securities possess with consistent noise correlation for their opening and closing trading session. Those 12 individual securities resemble to the figure of 92,31%. Based partial-adjustment tests above, the hypothesis Ha1 and Ha2 are supported.
Table 3 indicates that more noise occur at Panel B rather than panel A. It is observed that there are 20 individual securities that have
noise or negative correlation with return of afternoon opening session (RO2t↔ RO2t-1) or
it equals to the figure of 75%. This figure is dominant if it is compared to the figure of others stock exchange. In detail, there are 13 companies have noise correlation at the closing of afternoon session (RC2t↔ RC2t-1).
The decreasing firms that have return noise on the opening session rather than on the closing session are very extreme for individual stocks. On the other hand, the consistency has recorded on the noise which correlated to opening return and closing return of afternoon trading session. There are 13 companies or 65% of them achieve this consistency. As the results, hypothesis Ha3 and Ha4 are also
supported.
Referring to the whole test results, it can be concluded that the return volatilities of opening and closing return for each session are varied substantially, and the stock prices of opening or closing for the subsequent session has been corrected (Sumiyana, 2007a; 2007b). It may also show that stock price reversion occurred only to individual stocks (Amihud & Mendelson, 1991; Chelley & Steeley, 2001) that listed at the Indonesia Stock Exchange (Sumiyana, 2007a; 2007b).
Tabel 3. Return Correlation Among the Sessions and Their Preceding Periods
PANEL A: Correlation for Return of Morning Trading Session
Individual Securities Var RO1 RO1↔RO1t-1 t-value sig Var RC1 RC1↔RC1t-1 t-value sig
AALI Astra Agro Lestari 0.001029 -0.260899 -7.165697 *** 0.001276 -0.292547 -8.111516 *** ANTM Aneka Tambang 0.000888 0.055164 1.480396 + 0.000919 0.055671 1.494039 + ASII Astra 0.000559 -0.015911 -0.426390 0.000521 0.026093 0.698439 BBCA Bank Central Asia 0.001078 -0.007765 -0.207190 0.001017 -0.002762 -0.073687 BDMN Bank Danamon 0.000579 0.121571 3.235868 +++ 0.000677 0.055592 1.471011 + BNII Bank Internasional Indonesia 0.000669 -0.119812 -3.211117 *** 0.001162 -0.324023 -9.113369 *** BRPT Barito Pacific Timber 0.002575 -0.009691 -0.245555 0.002585 0.045612 1.156898 BUMI Bumi Resources 0.003785 -0.402304 -11.593034 *** 0.004183 -0.392172 -11.247197 *** GGRM Gudang Garam 0.000372 0.030265 0.803393 0.000402 -0.047437 -1.260067 GJTL Gajah Tunggal 0.001056 -0.088949 -2.364422 *** 0.001366 -0.218015 -5.914520 *** INCO International Nickel 0.001066 -0.000814 -0.021292 0.000994 0.086029 2.259977 +++ INDF Indofood Sukses 0.000708 -0.176959 -4.804309 *** 0.000683 -0.131848 -3.554117 *** INKP Indah Kiat Pulp 0.001039 -0.100218 -2.687682 *** 0.001321 -0.216839 -5.927018 *** INTP Indocement 0.000913 -0.009164 -0.243156 0.000892 -0.029091 -0.772209 KIJA Kawasan Industri Jababeka 0.002178 -0.192758 -5.163860 *** 0.002536 -0.205165 -5.510359 *** KLBF Kalbe Farma 0.000637 -0.059177 -1.579590 * 0.000634 -0.104429 -2.797884 *** PNBN Bank Pan 0.000671 -0.025374 -0.676814 0.000744 -0.044886 -1.198079 PTBA Tambang Batubara 0.000746 -0.063523 -1.691274 ** 0.001391 -0.230914 -6.305955 *** RALS Ramayana Lestari 0.000472 -0.056130 -1.402083 * 0.000565 -0.173338 -4.389473 *** SMCB Semen Cibinong 0.000908 -0.131969 -3.557426 *** 0.000774 -0.064174 -1.718334 ** SMRA Summarecon Agung 0.001143 -0.022314 -0.565965 0.001324 -0.087013 -2.214825 *** TKIM Pabrik Kertas Tjiwi Kimia 0.001153 -0.037252 -0.946017 0.001106 0.020895 0.530361 TLKM Telekomunikasi 0.000438 0.027686 0.739047 0.000475 -0.000463 -0.012342 UNTR United Tractor 0.000903 -0.070811 -1.902188 ** 0.000811 0.017055 0.457067 UNVR Unilever 0.000424 -0.200373 -5.380112 *** 0.000345 -0.132242 -3.509577 *** PANEL B: Correlation for Return of Afternoon Trading Session
Individual Securities Var RO2 RO2↔RO2t-1 t-value sig Var RC2 RC2↔RC2t-1 t-value sig
AALI Astra Agro Lestari 0.012852 -0.475129 -14.316846 *** 0.000583 -0.002573 -0.068210 ANTM Aneka Tambang 0.000954 0.040056 1.074192 0.000971 0.090390 2.431991 +++ ASII Astra 0.000517 0.018138 0.485415 0.000546 0.039197 1.051110 BBCA Bank Central Asia 0.001055 -0.012622 -0.336814 0.001025 0.008598 0.229419 BDMN Bank Danamon 0.000693 0.067853 1.796800 ++ 0.000617 0.108084 2.872366 +++ BNII Bank Internasional Indonesia 0.000695 -0.186308 -5.045685 *** 0.001765 -0.356169 -10.142145 *** BRPT Barito Pacific Timber 0.008146 -0.341321 -9.200839 *** 0.005978 -0.304392 -8.096814 *** BUMI Bumi Resources 0.001481 -0.274646 -7.535435 *** 0.000905 -0.072243 -1.910907 ** GGRM Gudang Garam 0.000490 -0.105305 -2.809687 *** 0.000383 0.082297 2.191014 +++ GJTL Gajah Tunggal 0.004047 -0.386770 -11.104481 *** 0.001752 -0.276662 -7.622533 *** INCO International Nickel 0.003903 -0.354859 -9.934060 *** 0.000874 0.113894 3.000403 +++ INDF Indofood Sukses 0.000679 -0.106214 -2.854263 *** 0.000697 -0.119491 -3.215922 *** INKP Indah Kiat Pulp 0.002417 -0.316860 -8.914210 *** 0.000942 0.003041 0.081138 INTP Indocement 0.001283 -0.151624 -4.070100 *** 0.000811 0.101526 2.707770 +++ KIJA Kawasan Industri Jababeka 0.003250 -0.238307 -6.450178 *** 0.002114 -0.153909 -4.094587 *** KLBF Kalbe Farma 0.000622 -0.064567 -1.724044 ** 0.000710 -0.063068 -1.683842 ** PNBN Bank Pan 0.000859 -0.126879 -3.410740 *** 0.000681 0.013913 0.371019 PTBA Tambang Batubara 0.001087 -0.184809 -4.996556 *** 0.000984 -0.153930 -4.139369 *** RALS Ramayana Lestari 0.000516 -0.100023 -2.509165 *** 0.000534 -0.103955 -2.608860 *** SMCB Semen Cibinong 0.001165 -0.204189 -5.573506 *** 0.000940 -0.072905 -1.953275 ** SMRA Summarecon Agung 0.001350 -0.110039 -2.807366 *** 0.001121 -0.007004 -0.177609 TKIM Pabrik Kertas Tjiwi Kimia 0.003080 -0.313427 -8.375936 *** 0.001451 -0.108815 -2.777914 *** TLKM Telekomunikasi 0.000521 -0.042521 -1.135639 0.000462 0.030289 0.808572 UNTR United Tractor 0.001017 -0.099932 -2.691205 *** 0.000953 -0.055565 -1.491190 * UNVR Unilever 0.002649 -0.462249 -13.722748 *** 0.000392 -0.139517 -3.709041 ***
Remarks: “*” noise occurrence sign; “+” as the sign of information
* Significant negative at the level of (0,10); ** significant negative at the level (0,05); *** significant negative at the level (0,01);
+ Significant positive at the level (0,10); ++ significant positive at the level (0,05); +++ significant positive at the level (0,01);
Var ROi is return variance opening price, where i indicates trading session period; t for days;
Price reversion for almost of all individual shares means that share price departs from its fundamental value. Another interpretation is that numerous fake signals have been responded by the market. As soon as the dispersion or the fake signals detected the share, the prices then set back to the limit price which is close to its fundamental price. The price reversion in such condition is due to pricing errors’ decision or called as a transitory price or momentary price. It inferred that these pricing errors were influenced by momentary event. Noise is demonstrated significantly by negative price adjustment shifted into normal value. It is due to trading interval mechanism. It is consistence with the findings of Roll (1984), Amihud & Mendelson (1991), and Chelley & Steeley (2001).
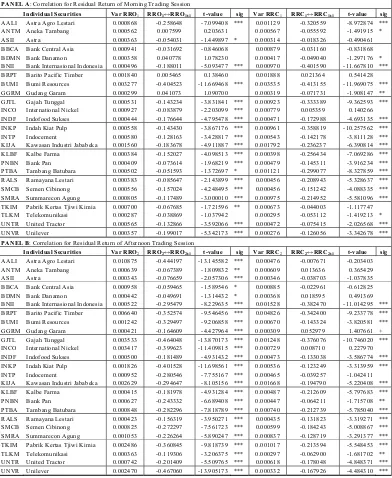
Noise Tests of Opening and Closing Residual Return
There has been negative autocorrelation (potential noise sign”*, **, ***”) between the residual returns of opening price (RROi,t) and
residual return of the opening price of the preceding day (RROi,t-1). Table 4 illustrates
detailed test results of noise of 25 firms’ individual shares. Some negative correlations demonstrated are, residual return for opening price of morning session (RRO1t ↔RRO1t-1),
residual return for closing price of morning session (RRC1t↔RRC1t-1), residual return for
opening price of afternoon session (RRO2t ↔RRO2t-1), and residual return for closing
price of afternoon session (RRC2t↔RRC2t-1).
Those 25 individual securities have departed their market stock value in comparison with their fundamental values. In panel A, there are 19 individual stocks have noise for return residual correlation for opening price of morning session (RRO1t ↔ RRO1t-1) or it
equals to the level of 76%. This figure is dominant enough compared to the same finding of empirical studies. There is also noise that correlated to return residual for closing price of morning session (RRC1t ↔ RRC1t-1). The figure is about 80% or 12 stock
companies registered. The percentage is
relatively the same with the noise return of opening return residual and closing return residual. There are only 16 companies out of 19 (84.21%) possess a consistence noise correlation for their opening and closing returns residual. Therefore, hypotheses Ha5
and Ha6 are supported.
Panel B reports more individual securities have noise for the return residual correlation than those of panel A. There are 25 firms have noise of their return residual during opening price of afternoon session (RRO2t↔ RRO2t-1)
or it equals to the level of 100%. This figure is very dominant compared to other research findings. There is also noise that correlated to return residual for closing price of afternoon session (RRC2t ↔ RRC2t-1). There are 20
individual shares or approximately 80%. The decreasing figure is very extreme for individual stocks with noise return residual of opening price compared to closing price. There do only 20 companies (80%) possess a consistence noise correlation for their opening and closing returns residual during afternoon sessions. Therefore, hypotheses Ha7 and Ha8
are also supported.
Tabel 4. Return Residual Correlation Between Trading Sessions and Their Preceding Sessions
PANEL A: Correlation for Residual Return of Morning Trading Session
Individual Securities Var RRO1 RRO1↔RRO1t-1 t-value sig Var RRC1 RRC1↔RRC1t-1 t-value sig
AALI Astra Agro Lestari 0.000868 -0.258648 -7.099408 *** 0.001129 -0.320559 -8.972874 *** ANTM Aneka Tambang 0.000562 0.007599 0.203631 0.000567 -0.055592 -1.491915 * ASII Astra 0.000363 -0.054031 -1.449897 * 0.000314 -0.018326 -0.490461 BBCA Bank Central Asia 0.000941 -0.031692 -0.846068 0.000879 -0.031160 -0.831868 BDMN Bank Danamon 0.000358 0.040778 1.078230 0.000417 -0.049040 -1.297176 * BNII Bank Internasional Indonesia 0.000496 -0.188011 -5.093477 *** 0.000970 -0.401590 -11.667810 *** BRPT Barito Pacific Timber 0.001840 0.005465 0.138460 0.001888 0.021364 0.541428 BUMI Bumi Resources 0.003277 -0.404523 -11.669468 *** 0.003535 -0.413155 -11.969075 *** GGRM Gudang Garam 0.000299 0.041073 1.090700 0.000319 -0.071731 -1.908147 ** GJTL Gajah Tunggal 0.000531 -0.143234 -3.831841 *** 0.000923 -0.333389 -9.362593 *** INCO International Nickel 0.000927 -0.083879 -2.203099 *** 0.000779 0.005359 0.140266 INDF Indofood Sukses 0.000444 -0.176644 -4.795478 *** 0.000471 -0.172988 -4.693135 *** INKP Indah Kiat Pulp 0.000558 -0.143430 -3.867176 *** 0.000961 -0.358819 -10.257562 *** INTP Indocement 0.000580 -0.128163 -3.428817 *** 0.000543 -0.142178 -3.811128 *** KIJA Kawasan Industri Jababeka 0.001560 -0.183678 -4.911887 *** 0.001792 -0.236237 -6.390814 *** KLBF Kalbe Farma 0.000384 -0.152027 -4.098513 *** 0.000398 -0.256434 -7.069286 *** PNBN Bank Pan 0.000409 -0.073614 -1.968219 *** 0.000479 -0.145311 -3.916234 *** PTBA Tambang Batubara 0.000502 -0.051593 -1.372697 * 0.001121 -0.299077 -8.327859 *** RALS Ramayana Lestari 0.000383 -0.085647 -2.143899 *** 0.000456 -0.208943 -5.328637 *** SMCB Semen Cibinong 0.000556 -0.157024 -4.248495 *** 0.000456 -0.151242 -4.088335 *** SMRA Summarecon Agung 0.000805 -0.117489 -3.000010 *** 0.000975 -0.214952 -5.581096 *** TKIM Pabrik Kertas Tjiwi Kimia 0.000700 -0.067685 -1.721596 ** 0.000673 -0.044003 -1.117747 TLKM Telekomunikasi 0.000287 -0.038869 -1.037942 0.000295 -0.053112 -1.419213 * UNTR United Tractor 0.000565 -0.132866 -3.592066 *** 0.000472 -0.075415 -2.026568 *** UNVR Unilever 0.000357 -0.199017 -5.342173 *** 0.000276 -0.126056 -3.342678 *** PANEL B: Correlation for Residual Return of Afternoon Trading Session
Individual Securities Var RRO2 RRO2↔RRO2t-1 t-value sig Var RRC2 RRC2↔RRC2t-1 t-value sig
AALI Astra Agro Lestari 0.010875 -0.444197 -13.145582 *** 0.000476 -0.007671 -0.203403 ANTM Aneka Tambang 0.000639 -0.067389 -1.809832 ** 0.000609 0.013636 0.365429 ASII Astra 0.000343 -0.076659 -2.057306 *** 0.000346 -0.038703 -1.037835 BBCA Bank Central Asia 0.000958 -0.059465 -1.589546 * 0.000885 -0.022961 -0.612825 BDMN Bank Danamon 0.000442 -0.049691 -1.314432 * 0.000368 0.018595 0.491369 BNII Bank Internasional Indonesia 0.000522 -0.295479 -8.229635 *** 0.001528 -0.382470 -11.014295 *** BRPT Barito Pacific Timber 0.006640 -0.352574 -9.546456 *** 0.004826 -0.342400 -9.233778 *** BUMI Bumi Resources 0.001242 -0.329497 -9.206858 *** 0.000670 -0.143324 -3.820581 *** GGRM Gudang Garam 0.000421 -0.164609 -4.427964 *** 0.000309 0.052979 1.407661 + GJTL Gajah Tunggal 0.003533 -0.464048 -13.870173 *** 0.001248 -0.376076 -10.746020 *** INCO International Nickel 0.003417 -0.399623 -11.409815 *** 0.000729 0.008710 0.227970 INDF Indofood Sukses 0.000500 -0.181489 -4.931432 *** 0.000473 -0.133038 -3.586774 *** INKP Indah Kiat Pulp 0.001826 -0.401528 -11.698561 *** 0.000536 -0.123249 -3.313959 *** INTP Indocement 0.000952 -0.280546 -7.755167 *** 0.000465 -0.039257 -1.042411 KIJA Kawasan Industri Jababeka 0.002629 -0.294647 -8.105156 *** 0.001668 -0.194790 -5.220408 *** KLBF Kalbe Farma 0.000415 -0.181978 -4.931284 *** 0.000487 -0.212609 -5.797683 *** PNBN Bank Pan 0.000627 -0.243332 -6.689408 *** 0.000447 -0.064211 -1.715708 ** PTBA Tambang Batubara 0.000848 -0.282296 -7.818789 *** 0.000740 -0.212739 -5.785040 *** RALS Ramayana Lestari 0.000423 -0.156319 -3.950271 *** 0.000435 -0.131823 -3.319271 *** SMCB Semen Cibinong 0.000825 -0.272297 -7.561723 *** 0.000599 -0.184243 -5.008867 *** SMRA Summarecon Agung 0.001053 -0.226264 -5.890247 *** 0.000837 -0.128719 -3.291377 *** TKIM Pabrik Kertas Tjiwi Kimia 0.002486 -0.360845 -9.818739 *** 0.001017 -0.213594 -5.548453 *** TLKM Telekomunikasi 0.000363 -0.119306 -3.206375 *** 0.000297 -0.062900 -1.681702 ** UNTR United Tractor 0.000742 -0.201409 -5.509765 *** 0.000618 -0.178048 -4.848371 *** UNVR Unilever 0.002470 -0.467060 -13.905173 *** 0.000332 -0.167926 -4.484310 ***
Remarks: “*” noise signal; “+” sign for the coming of information;
* negative significant at the level of (0,10); ** negative significant at the level of (0,05); *** negative significant at the level of (0,01);
+ positive significant at the level of (0,10); ++ positive significant at the level of (0,05); +++ positive significant at the level of (0,01);
Var RROi represents residual return variance opening price, where i indicates trading session; t for day;
The inference can be explained implicitly through logic of trading mechanism. The stock traders gain the profit by holding short-moment share inventories as they want to anticipate the decreasing share price in the next day. Then, the stock holders do the same for a long-moment during the proceeding period as the strategy to anticipate future high price. The condition like this has awful implications, because many traders will hold their share inventories to gain profit for short duration. (Amihud & Mendelson, 1987b; 1991; Chelley & Steeley, 2001). As the result, the market becomes inefficient. Therefore, this study supports the noise concept that the periodic clearing transaction is not efficient.
Furthermore, Amihud & Mendelson (1987b; 1991), and Chelley & Steeley (2001) analyze that the more reversion price detected by negative partial-adjustment, the more inefficient the trading mechanism. The higher the noise for return residual correlation, the bigger the profit each transaction will be. The empirical studies on the trading mechanism proved that negative coefficient correlation value lies in residual return correlation for opening and closing prices of morning trading session, or for that of afternoon trading session. Therefore, this condition is expected as indicator of good opportunities for getting profit with the assumption that price is reported price
The Research Findings
This study finds several factors that force noise occurrences at the IDX. Those factors are correlated with trading mechanism system and periodical clearing transaction procedures. The analysis done to the trading system and clearing transaction procedure at the IDX demonstrated that clearing transaction procedure is responsible for a high return variance at every initial trading session. The share price at the beginning of morning trading session was the effect of long-overnight non-trading period. It also takes
place to the beginning of the afternoon trading session which has a lunch break non-trading. These two break times has made the traders as well as the stock brokers unable to observe continuously the stock pricing. Finally, they do make some error predictions at the beginning of trading session. Their predictions sometimes tend to be above from their fundamental stock value. The share prices then are corrected at the proceeding trading session (Amihud & Mendelson, 1991; Chelley & Steeley, 2001; Sumiyana, 2007a; 2007b).
The research investigates the return residual behaviour. It is measured by using residual market model. From this investigation, several findings have been forward. The first one is that the periodic trading mechanism used for transaction process can trigger the noise occurrences. It is demonstrated that negative autocorrelation between return residual of a particular trading period and its preceding period. The noise return residual of opening price is much higher than noise return residual of closing period. By paying attention to the noise occurrences for return of trading period, and noise for residual return, it is possible that this study finds the inefficiencies of the periodic clearing transaction procedure. The ineffi-ciency is detected through a high figure of noise for return and noise for residual return. It makes the profit at each transaction increase. It could be inferred that there are stock mispricing at the beginning of trading session. These mispricings are due to trading mechanism and periodic clearing transaction procedures (Amihud & Mendelson, 1991; Chelley & Steeley, 2001).
also it finds price reversion among the subsequent trading periods. The set back or price reversion is an indicator that there is something wrong with share pricing at the beginning of trading period. This condition has negative implication that the stock traders will try to gain a lot of profit in each transaction in a short duration. Thus, such condition is better to be called inefficient.
Last implication of this study was that periodic trading mechanism is also inefficient because it creates noise occurrences. It means that the periodic trading mechanism is responsible for noise occurrences of this trading system. Discontinued trading system is a symptom for the stock trader not to observe the prices continuously. They are motivated to gain a lot for short-duration profit. Higher return volatility occurs at the beginning of every trading session. This condition creates inefficiencies in the process of clearing transaction. As the result, there will support to noise occurrences. Meanwhile, periodic clearing transaction systems are an inferior method (Amihud & Mendelson, 1991)..
CONCLUSION, WEAKNESS, AND SUGGESTION OF THE RESEARCH
There are many conclusion can be derived from the discussion above. First, there is strong evident of noise occurrences or nega-tive partial-adjustment of return. The neganega-tive autocorrelation test of the return has revealed a reversed price which caused by trading mechanism. It is known that Indonesia Stock Exchange is still applying periodic mechanism for morning and afternoon trading sessions together with its lunch break and overnight breaks non-trading sessions. Such mechanism causes return variance to increase at the beginning of each trading session. The high price variances should be corrected at the next trading session in order to have a proper limit of its fundamental value.
Second, the negative partial-adjustment for residual return also occurs at the highest
level of 100% on every firm’s individual share. Such noise is due to transaction mechanism including clearing transaction procedures at the end of each trading session. The clearing transaction procedure affects high return variances at the beginning of trading session. High return variances are caused by stock trader that are not able to observe the prices behaviour continuously. The high return variances, therefore, are corrected in the next subsequent trading session. It forms negative partial-adjustment between particular residual returns and their preceding residual returns.
Third, the first and the second conclusions above give a good prospect to this study to interpret that noise for return and noise for residual return automatically occur simultaneously. It means that periodic trading mechanism is inefficient. Consequently, this mechanism is responsible for noise mecha-nism of this trading system. Discontinued trading system is a symptom for the stock traders to observe the prices continuously. In addition, they are motivated to gain a lot of short-moment profit. Finally, discontinued trading system causes high return variances at the next beginning trading session. This condition creates inefficiencies in the process of clearing transaction. Therefore there will support noise occurrences. This study, moreover, concludes that periodic mechanism is an inferior method.
bid-ask spreads may determine the type of negative partial-adjustment. At least, the bid-ask spreads could be used as a sensitivity analysis to rank the noise occurrences.
The third weakness lies on the use of rough residual return which does not pass the requirement of the influencing factor in trading or overreaction of investor behaviour (Chelley & Steeley, 2001). The future research on the same field could use Kalman Filter methodology which enables the researcher to separate the influence of trading mechanism or overreaction of investor behaviour.
REFERENCES
Amihud, Y., and H. Mendelson, 1987a. “Trading Mechanism and Stock Return: An Empirical Investigations.” Journal of Finance. Vol. 42: 533-53.
Amihud, Y., and H. Mendelson, 1987b. “Are Trading Rule Profits Feasible?” Journal of Portfolio Management, Fall, 77-78.
Amihud, Y., and H. Mendelson, 1991. “Volatility, Efficiency and Trading: Evidence from the Japanese Stock Market.” Journal of Finance. Vol. 46: 369-89.
Amihud, Y., H. Mendelson, and M. Murgia, 1990. “Stock Market Microstructure and Return Volatility: Evidence from Italy.”
Journal of Banking and Finance. Vol. 14: 423-440.
Bery, T. D., and K. M. Howe, 1994. “Public Information Arrival.” Journal of Finance.
Vol. 49: 1331-1347.
Black, F., 1986. “Noise.” Journal of Finance. Vol. 41: 529-43.
Blume, L., D. Easley, and O’Hara, 1994. “Market Statistics and Technical Analysis: the Role of Volume.” Journal of Finance. Vol. 49 (1): 153-181.
Chang, R. P., T. H. Hsu, N. K. Huang, and S. G. Rhe, 1999. “The Effect of Trading Methods on Volatility and Liquidity: Evidence from Taiwan Stock Exchange.”
Journal of Business Finance and Accounting. Vol. 26 (1): 137-170.
Chelley, P., and Steeley, 2001. “Opening Returns, Noise and Overreaction.”
Journal of Financial Resesarch. Vol. 24 (4): 513-521.
French, K. R., and R. Roll, 1986. “Stock Price Variances: The Arrival of Information and the Reaction Traders.” Journal of Financial Economics. Vol. 17: 5-26.
Frino, A., and A. Hill, 2001. “Intraday Futures Market Behaviour around Major Scheduled Macroeconomics Announ-cements: Australian Evidence.” Journal of Banking & Finance. Vol. 25: 1319-1337.
Guner, N., and Z. Onder, 2002. “Information and Volatility: Evidence from an Emerging Market.” Emerging Markets Finance and Trade. Vol. 36 (6): 26-46.
Harsono, R.D.B., 2003. “Trading Based on Information Arrivals and Noise: Foreign and Domestic Trading Volume and Market Return Volatility at IDX Since Market Liberalisation.” Unpublished Thesis, Universitas Gadjah Mada.
Hartono, Jogiyanto M., 2001. Portfolio Theory and Investment Analysis. 3rd Ed., Jogyakarta: BPFE Jogyakarta.
Hartono, Jogiyanto M., 2005. Decisionally Efficient Market Hypotheses. Jakarta: Gramedia Pustaka Utama, Co.
Hartono, T., 2004. ”The Association between Firm Tick Size and IDXs’ Market Quality: Intraday Data Investigation based 30 Minute Interval.” Unpublished Thesis, Universitas Gadjah Mada.
Huang, Y. S., D. Y. Liu, and T. W. Fu, 2000. “Stock Price Behaviour over Trading and Non-Trading Periods: Evidence from the Taiwan Stock Exchange.” Journal Business and Financial Accounting. pp. 575-602.
Business Finance and Accounting. 26(7): 1013-1036.
Nofsinger, J. R., 2001. “The Impact of Public Information on Investors.” Journal of Banking & Finance. Vol. 25: 1339-1366. Roll, Richard, 1994. “A Simple Implicit
Measure of The Bid-Ask Spread in An Efficient Market.” Journal of Finance. Vol. 39: 1127-1139.
Stoll, H., and R. Whaley, 1990. “Stock Market Structure and Volatility.” Review of Financial Journal. Vol. 5: 231-58.
Suhaibani, M.A., and L. Kryzanowski, 2000. “The Information Content of Orders on
the Saudi Stock Market.” Journal of Financial Research. Vol. 23 (2): 145-156. Sumiyana, 2007a. “Stock Price Behaviour
over Trading and Non Trading Periods, Daily Return Volatility, and Noise Occurrences Detection (IDX for the Year of 1999-2006).” Unpublished Thesis,
Universitas Gadjah Mada.