.
e
.
?.
.
.
.
.
.
.
.
.
.
.
Heavy Metals Distribution in the Artisanal Gold Mining Area in
Wonogiri
M
.
Nurcholis, D.F. Yudiantoro, and D. Haryanto, and A.
Mirzam
Received: October 2016 / Accepted: February 2016 / Published online: December 2017 © 2017 Faculty of Geography UGM and he Indonesian Geographers Association
Abstract Artisanal and small gold mining activity in Wonogiri Regency has long been done and gives the beneit of the people’s economic support, but this activity has the potential to decrease the quality of the environment. his study was aimed to analyze the levels and spatial distribution of heavy metals in the mining area. Survey of mining and amalgamation sites, sampling the soil and tailings had been conducted. here were 66 samples of soil and tailing were collected, analysis of heavy Fe, Mn, Pb, Hg, As and Co, using X-ray luorescence (XRF). Normal distribution test of data was conducted using the Kolmogorov-Smirnov and Shapiro Wilk. he spatial distribution of heavy metals was described using Krigging method. Contents of most heavy metals in the area studied were high, except for Co. According to the distribution pattern of heavy metals indicated that the contamination caused by the mining.
Key words: Artisanal mining, gold, heavy metals
Abstrak Pertambangan rakyat dengan skala kecil di Kabupaten Wonogiri telah lama dilakukan dan memberikan kemanfaatan dukungan ekonomi masyarakat, namun aktivitas ini berpotensi menurunnya kualitas lingkungan. Penelitian ini bertujuan untuk menganalisis kandungan dan distribusi spasial logam berat di daerah pertambangan. Survei dilakukan di areal pertambangan dan amalgamasi, sampel tanah dan tailing telah dilakukan. Ada 66 sampel tanah dan tailing dikumpulkan, analisis logam berat Fe, Mn, Pb, Hg, As dan Co, menggunakan X-ray luorescence (XRF). Uji distribusi normal data dilakukan dengan menggunakan Kolmogorov-Smirnov dan Shapiro Wilk. Distribusi spasial dari logam berat digambarkan menggunakan metode krigging. kadar logam-logam berat di lingkungan pertambangan rakyat adalah tinggi, kecuali Co. Menurut pola distribusi logam berat menunjukkan bahwa pencemaran akibat pertambangan.
Kata kunci : emas, logam berat, tambang rakyat
1. Introduction
he problem of heavy metal contamination in soil is already understood to be harmful to the environment. he existence of contaminants in the soil may be caused by natural processes, but mostly due to human activities. Natural process that led to the emergence of contamination in the soil include: in volcanic activity and andesitic minerals alteration. As caused by human activities may include mining, industry, households, agriculture, etc. [Bless et al.,, 2016; Hu et al., 2013; Iorfa, et al., 2011]. Gold mining activities consisting of material mining and processing to separate the gold from the tailings, both of which can potentially lead to the emergence and heavy metal contamination in the soil. he spread of contaminants in the soil and in the area around the source of the contaminant is determined
by the basic characteristics of the soil [Iorfa et al., 2011] landform and land use. While the amount of Fe and Mn in soil is naturally at abundant levels [Hu et al., 2013]. Artisanal mining activity in Wonogiri Regency Central Java Province has been going on since about a century ago. Mining activities they do to increase revenue from the main work as a farmer. Mining community does not understand very well the characteristics of the soil and the water low which can lead to the spreading of heavy metal contamination. he main environmental efects of artisanal mining are soil erosion, sedimentation of water bodies, mercury pollution, and a total lack of land reclamation ater closure [McMahon et al., 2000]. Of these, the most common problem causing cationic metals (metallic elements whose forms in soil are positively charged cations e.g., Pb2+) are mercury, cadmium, lead, nickel, copper, zinc, chromium, and manganese [NCRS, 2000].
Heavy metals (HM) are considered to be metals with a density/speciic mass above 5 g.cm-3 [Nies, 1999; Hooda, 2010], and include: copper (Cu), zinc (Zn), cadmium (Cd), lead (Pd), iron (Fe), nickel (Ni), silver (Ag), thorium (h), uranium (U), mercury (Hg) and arsenic (As).
IJG Vol. 49, No.2, December 2017 (133 - 144) © 2017 Faculty of Geography UGM and he Indonesian Geographers Association
M. Nurcholis, D.F. Yudiantoro and D. Haryanto
Universitas Pembangunan Nasional “Veteran” Yogyakarta, Indonesia
A.Mirzam
Bandung Institute of Technology, Bandung Indonesia Correspondent email: [email protected]
M Nurcholis, dkk
Untill now, there is no suicient in the studied area about the spread of heavy metals in the soil in the mining and processing of gold in the mine area of the people at this location, while artisanal gold mining was already done from about one century ago.
Based on the problems that exist in this area, then the purpose of this study was to analyze the distribution of heavy metals as contaminants in the soil associated with alteration minerals, gold mining activities and processing in artisanal mining village of Boto village Wonogiri Regency.
2. he Methods
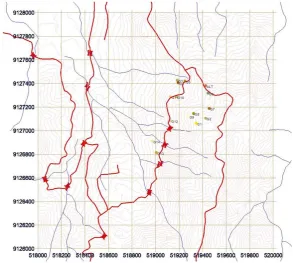
he study was conducted in the area of artisanal mining, as artisanal and small scale mining, which is located in the village of Boto, Jatiroto, Wonogiri. he location is part of mountainous region known as Gunung Mas. Mining is done by open pit mining that is in Tapel site, which is located at the peak of Gunung Mas Mountains. Mineral processing was performed by the amalgamation using mercury (Hg) which is locally termed as “gelondong”, that there were more than iteen units located in the village. Sampling was carried out in the area, and there were for 66 samples that were distributed from: 1) alteration of rocks from open pit mines, 2) the tailings and the soil surrounding the amalgamation site, 3) soil on the rice ield that were potentially received contaminant from the liquid
waste result in amalgamation processing. Analysis of heavy metals includes Fe, Mn, Hg, Pb, Co, As from soil and tailing samples that were conducted using X-ray Fluoresence (XRF). Statistical analysis included: mean, median, mode, standard deviation, testing for normality, skewness, kurtosis number and frequency distribution curve along with the normal expectation. Spatial distribution of heavy metals Fe, Mn, Hg, Pb, Co, As presented in the form of a contour map metal levels in the soil with the slope correction factor to determine the pattern of spread of contaminants.
A normality test is generally used to determine whether sample data has been drawn from a normally distributed population (within some tolerance). A number of statistical tests, such as the Kolmogorov-Smirnov and Shaphiro Wilk can be perform to the normality of data distribution. In this research, normality test of the data distribution for the contents of heavy metals was done to identify spatial changes of these metals. In an environment of relatively uniform, the concentration of heavy metals will tend to be normally distributed indicated by the low value of skewness. hen the mode is small or even conveniently indicates the mode not found metal content is not worth striking. Besides, the shape of the normal distribution curve which has a peak that is not too high or low value of kurtosis which shows the distribution of content value is relatively uniform.
3. Result and Discussion Land Characteristics
he research location was land that is mountainous in nature and with very steep slope. According to the regional geology, lithology of this area is composed by old volcanic breccia and that have undergone alteration by hydrothermal process. Land surface was characterized by dissected slopes surface by runof that form the rill and gully erosion and landslides in several locations. Source water low comes from rain water or spring water that appeared from the top of the mountains and on the slopes of the mountains. Land surface was covered by abundant of rocks and stone with varies size that from small to very large. he existence of these rocks is potentially very dangerous in case of falling rocks (rock fall). In the classiication of land capability and space utilization, research sites should be protected areas with land use constraints of the form factor of the slope. But according to the history of land use since prolong time as the use of land for cultivation. Existing land use on the research area is as a natural forest, mixed farming, and village settlements with the pattern of spread. In the middle altitude of the mountains there were some agricultural activity for rice cultivation in paddy ields, and it is done in the ield with a steep slope with a terrace system. So that rice ield as paddy ield is made up as bench terraces that the pattern is in direction of the contour lines. For irrigation of paddy ields farmers use various sources of water that comes from the top lows as creeks, and also a source of water that comes out on the slopes. Livestock are commonly found in communities consisting of cattle, goats and poultry (mainly chickens). Local people raise cattle and goats by impound their animals, while the chicken which they raise are allowed to roam outside during the day, and at night the chicken are back and entered their house.
Mining location
Gold mine site is located in a mountainous complex of Gunung Mas located in Wonogiri Regency, which is referred to as Tapel rural community. here were thre types of mining that were operated by artisanal miner, i.e. open-pit gold mines, underground mining, and combination of open pit mine followed by underground mining. he existence of mineral prospects of the gold content is only about one meter below the soil as overburden that it may facilitates local communities easy to open land cover. Artisanal mining operations are generally deined as those using little or no mechanization or heavy equipment [McMahon et al., 2000].
Operational of gold mining is generally done by open pit with activity using manual simple equipments, and it is classiied as artisanal and small scale gold mining [Ariin et al., 2015; McMahon et al., 2000]. Sorting material containing gold prospect is conducted by using the lowing water that coming from the water spring. With the provision of mining technique
that has been owned by the locals they do mining collectively and interchangeably. To reduce sediment transported by surface runof and allow it to do sorting of returned materials prospects, a mini settling pond was constructed to facilitate suspended solid settling.
Ater mining was done by artisanal miners there was appearance of land surface that forming an irregular excavated land. his is because the miners only did quarrying activities and the post mining land was let without any reclamation process. Even the post open pit mining land was then followed by digging up if there was a prediction of the prospect ore present in the deep site from surface, as it was then used the underground mining technique.
he open pit gold mines are developed at the surface, because of that these mines are also called surface gold mines. he overburden, i.e.: the rock or soil overlaid the gold ore, are removed before extraction of gold ore. his overburden is dumped on surface, preferably on mined-out area. herefore, this type of mining requires quite large area on surface. Many a times, large forest areas are transferred for gold mining purpose. he land degradation is the result of creation and expansion of open pit gold mines. he environmental aspect of land degradation in underground gold mines is due to subsidence over the underground cavities resulted from underground caving.
here are times during mining when hazardous materials can afect the environment by becoming bioavailable to downstream ecosystems. he most common pathway is from mine wastes, ore stockpiles and mine operations into surface water or groundwater. Spills during the mineral processing circuit are another potential pathway, but are less common [Australian Government 2016].
In addition to the mining was done in open pit, they also conduct underground mining by making holes in the points that the prospect for gold is obtained. he location is at the point of making the holes is estimated the presence of alteration in the form of mineral veins containing gold. So many holes underground mining might be found in Boto village, either still active or who are not mined anymore as abandoned mine.
Amalgamation Process
M Nurcholis, dkk
would be proceed for second step of amalgamation. he amalgamation process in general as much as 2 times, and it resulted the waste is in the form of tailling included in tubs or stacked. Ater the teilling had been drying then it was stored in sacks. An important consideration is the chemistry of the waste rock material being disposed of. Potential long-term impacts of weathering and subsequent release of deleterious liquors and dissolved metals determine how waste is handled and stored [Hitch et al. 2010]. he present study showed that there was businessman from outside the area that collects tailings then collect and process to be able to recover the gold taken mercury so that it can be retrieved. Most of the old mines have dumps and tailings containing appreciable amount of gold, and this may be due to the primitive technologies existed at that time or due to sudden shut down of mines [Abouzeid & Khalid, 2011]. Total absence of environmental management, health efects from mercury pollution [Hitch et al., 2010; McMahon et al., 2000]. Also the most probable source of the elevated mercury level in inhabitants of the ASGM site is the mercury vapor from smelting processes, which mainly occurs outside, in gold shops and sometimes inside houses [Ariin et al., 2015]. If hazardous materials used in the mining industry are mismanaged, they can poison humans, animals, plants and aquatic ecosystems, disrupt their reproductive processes or their habitat, and it will be very costly to remedy [Australian Government 2016].
Heavy metals the soil
Heavy metals contamination in the soil on the gold mining might be resulted from the process of minerals alteration, mining and amalgamation processing include Fe, Mn, Pb, Hg, As and Co. he results of the analysis of all types of metals using XRF presented are in the Table 1. Metals found in water
draining from mine sites. Metal concentrations increase in waters at lower pH. Once released, metals will persist in the environment. heir concentration in water can be reduced through physical removal such as sorption, precipitation, biological uptake [Smith, 2007]. Metals as ions or complexes may be derived from metal- sludge or metal-solutions. Recovery of the metal is usually the object of the mining project, but hazards may arise from the presence of toxic by-products (for example, arsenic and cadmium) or metals released as a result of developing acidiication, as described in Managing acid and metalliferous drainage [Australian Government 2016].
Iron (Fe)
he result of the present research shows that Fe content in the soil was the highest levels among the other metal elements. In general this element is the dominant element in weathered rocks and also it evolved into the soil. In the early development of soil process Fe element is still dominant in the soil parent material and it occupy as series of primary mineral compounds. Along the process of rock weathering the elements Fe and others liberated into a soluble form, particularly on the environment with acidic reaction and oxidation state. In this condition Fe can react to form oxides, hydroxides or salts depending on the environmental elements of Fe. In environments mineral alteration in the location studied is characterized by a high degree of oxidation resulted by a very fast internal drainage of soil as it is supported by the surface land with a steep to very steep slopes.
By ield observation to the soil proile that had been conducted at surveying period, it was identiied that Fe in soil as iron oxides. Fe content of all samples analyzed showed in the range that is not too sharp, a minimum value of 1.65% and a maximum of 7.04%.
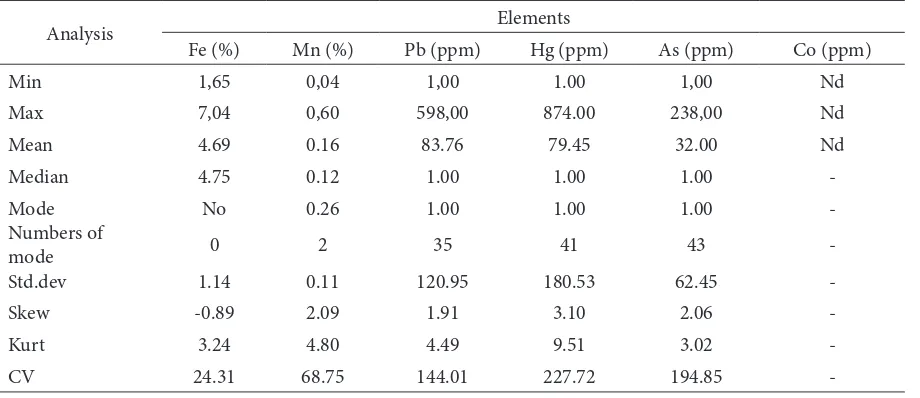
Table 1. Basic statistical analysis
Analysis Elements
Fe (%) Mn (%) Pb (ppm) Hg (ppm) As (ppm) Co (ppm)
Min 1,65 0,04 1,00 1.00 1,00 Nd
Max 7,04 0,60 598,00 874.00 238,00 Nd
Mean 4.69 0.16 83.76 79.45 32.00 Nd
Median 4.75 0.12 1.00 1.00 1.00
-Mode No 0.26 1.00 1.00 1.00
-Numbers of
mode 0 2 35 41 43
-Std.dev 1.14 0.11 120.95 180.53 62.45
-Skew -0.89 2.09 1.91 3.10 2.06
-Kurt 3.24 4.80 4.49 9.51 3.02
-Table 1 shows that he average value of Fe content in all samples is 4.69%, or it is approximately in the middle between the minimum and maximum values. High content of Fe in the soil and it form of iron oxide and it may role as coloring of the soil, which is generally red in color. Fe and Mn are major elements and they
occur naturally at abundant levels [Hu et al., 2013]. he median value of the Fe content in the present study is 4.75%, but of the data distribution did not show any mode. he standard deviation of the distribution of the data content of Fe is 1.14 and the coeicient of variance (CV) value was 24.31%.
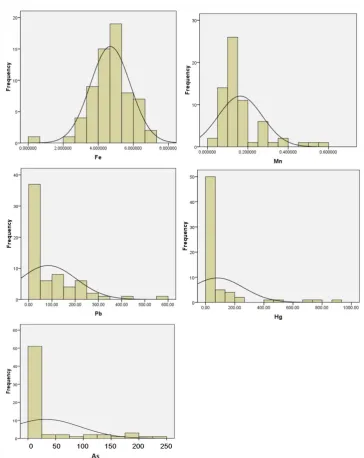
Figure 2. Distribution frequencies, kurtosis and skewness of normaldistribution of heavy metals contamination in soil
Manganese (Mn)
he results of the present analysis of 66 samples that were examined showed the minimum value was 0.04% and the maximum value was 0.60%, while the average levels of manganese in the soil was 0.16%. he median and mode values of the data were 0.12% and 0.26%, respectively. According to the value of the mode that higher than of the average and median, it can be
M Nurcholis, dkk
it is oten found as mottle of dark-colored soil. he development of mottle of manganese in the soil and then crystallized to form nodules Mn oxides. In the Mn oxide minerals of some soils developed in Java many elements of heavy metal such as Co, Ba, Sr, Cu, Cr, Zn, were found and they were ixed in the crystal structure of the mineral nodules Mn-oxides [Nurcholis et al., 1997].
Lead (Pb)
In the studied soil, minimum content of Pb was 1.00 ppm and the maximum was 589.00 ppm with an average of 83.76 ppm. According to this result, it can be said that Pb concentration increase sharply in the alteration materials comparing with the original igneous rocks as parent materals of the developing soil. However the median and the mode values of distribution of the frequency distribution of the data to 1.00 ppm, respectively. According to the result there was high variability of the Pb content in the area of gold mining environment. Some of the studied sites might be lowering the Pb, and the value was around 1.00 ppm, but on the other site was 598.00 ppm as the maximum value. he high value of maximum concentration in the soil studied expressed that there were high contamination of Pb in soils as Pb was obsorbed in clay minerals. Study on the Pb retention was conducted in Michigan US, by spiking the clay materials using solution containing metal, and the result showed that Pb was immobilized by clay materials [Salim et al., 1996]. he average value of Pb in soils was 83.76 ppm, then the median and mode were respectively 1.00 ppm. Based on the mean, median and the mode of data frequency distribution curves of Pb is likely to be skewed to the let. Occurrences mode values (1.00 ppm) was the 35 of the total of data is 66, then more than 50% of the data shows the value of Pb is 1.00 ppm (Table 1).
Presence of lead in soils is generally derived from the product of weathering of rocks. he source of Pb content in the igneous rocks is in the range of 2-30 ppm [Bradl, 2004]. heir weathering causing elements, including Pb, and the content of this element may be distributed soil body depending on the environment of the soil genesis and development. Accumulation of Pb element in the environment in gold mining area is generally occured on rocks mineralization, and it can be formed as galena (PbS), cerussite (PbCO3) and
also some in anglesite (PbSO4), so the content of Pb in
environment may increase.
Mercury (Hg)
he existence of mercury in the mine environment is very important to be analyzed. he main sources of Hg are from the natural process of alteration of rocks and from human activity or anthropogenic processes [Malm, 1998], namely the addition of mercury in the
amalgamation to separate gold from rock. he existence of Hg in the soil unstable since Hg has a very high volatility. Mercury has three forms of oxidation number is zero (element), one (mercuro) and two (mercury). In soil, sediment, water and organisms, mercury forms as salt or complex of an organic compound, currently in atmospheric mercury as an element of Hg.
Hg content in the soil studied show varies between 1.00 and 874.00 ppm (Table 1). he high diference in minimum and maximum values of Hg content in the soil at the site of artisanal mining has demonstrated their enormous addition of mercury into the soil as a contaminant. In the amalgamation process, mercury is necessary added to separate and bond the gold from the rock for gold properties that reacts with Hg to form amalgams. Amalgamation technique in the present study was simple and waste handling systems in this process was not good cause potential contamination of the soil in the vicinity of the amalgamation site. Mercury in tailing as solid residual containing Hg might potentially contaminated soil by water runof ater rainfall. he worst handling technique to liquid waste from amalgamation process may also cause Hg contaminated the soil in the vicinity of the amalgamation site. he average value of Hg content in the soil studied is 79.45 ppm, while the median and mode are respectively 1.00 ppm (Table 1). Based on the mean value greater than the value of the median and mode, it shows the frequency distribution curve is skewed to the let. Kurtosis value of the frequency distribution of soil Hg content in the highest compared with values for Fe, Mn, Pb, As and Co. Mode value of the present result was 1.00 ppm with the numbers of mode value was 41 from 66 data, the maximum value of Hg level was 874.00 ppm, and the mean value was 79.45 ppm (Table 1). Accordingly, it can be considered that Hg contamination of the soil surrounding the gold mining activities in location studied is very high. he presence of mercury in soils is highly afected by the nature of clay minerals that is the ability of these constituents to absorb Hg [Sarkar et al., 1999]. Very much area of soil that contaminated by Hg in the present study is thought as a role of clay fraction in ability to absorp Hg. Indeed, very long period of mining and amalgamation processes in this area may cause accumulation of this element in soil.
Arsenic (As)
median value was 1.00 ppm and mode value was 1.00 ppm with the appearence of the mode was 43 data and maximum level of As content in soil was 238 ppm. Analysis of the normal distribution of the 66 values of As data using Kosmogolov Smirnov and Shapiro-Wilk tests (Table 1) shows that the curve of the spread of arsenic levels is not normal value. It is also presented in this table that average value was 32.00 ppm with a median and mode are respectively 1.00 ppm, so that it is not normal distribution curve with skewed to the right and the value of skewness is 2.06. Based on these results it can be said that the environmental gold mining and processing locations has been already showing contamination with arsenic. In the nature, arsenic can be in the form of arsenate of salt Pb, Cu, Ca or other cations. In the gold mine that also marked the mineral galena (PbS), the presence of As at this location is quite signiicant.
Retention of arsenic in soils is related to the content of oxides of Fe and Al, exchangeable Ca, and type and content of clay fraction in soils, and kaolinite absorbed more As from solution than vermiculite and montmorillonite [Onken & Adriano, 1997]. Study on Multivariate analysis of soil heavy metal pollution and landscape pattern in Changhua county in Taiwan showed that variables together explained 34.5% of the variation in the concentration of the soil heavy metals and landscape indices the data of this study area [Lin et al., 2002].
Normality Test
he distribution of the value of Fe content in the soil tends to lead normal (Figure 2.), although based on the data normality test results showed that the Fe content distribution did not normal (Table 2). As for the metals Mn, Pb, Hg and As did not show a
normal distribution. his suggests that heavy metal contamination were examined, except Fe, derived from the alteration of rocks. In addition, Hg levels increase in the soil was also caused by the addition of Hg in the amalgamation process. Similar results were also obtained on heavy metal distribution maps that were made in the USA, which indicates that the sample populations that have very high levels of heavy metals only slightly compared moved at a relatively low level [White et al., 1997]. Accordingly it can be said that the gold mine environments might cause increased levels of heavy metals sharply compared with the levels of heavy metals in a common environment.
In Romania already created a classiication for potential heavy metal pollution in the soil [Suciu et al., 2008] sequentially from very tight to very loose, as follows: RSV (Reference value in the sensitive area), ALS (Alert level in the sensitive area), RVLS (Reference value in the less sensitive area), ALLS (Alert level in the less sensitive area) and AIT (Area intervention threshold).
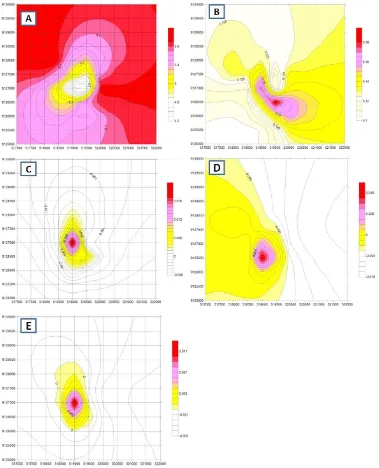
Spatial analysis
Spatial analysis was conducted to determine the spatial distribution of metals in the environment of the gold mines, the mine site, the amalgamation process and environment. Application of geostatistics and geographic information system was successfully describe the level of zinc in soil as map for characterizing the spatial variability of heavy metals [Li et al., 2004; Liu et al., 2006; White et al., 1997; Xie et al., 2011]. Signiicant amounts of metals, singly or in combination, are introduced into the environment from both natural and anthropogenic sources [Duruibe et al., 2007]. In this study, the spatial analysis is performed to ind out distribution of heavy metals content in soils around the environment of the sites of alteration and the amalgamation process.
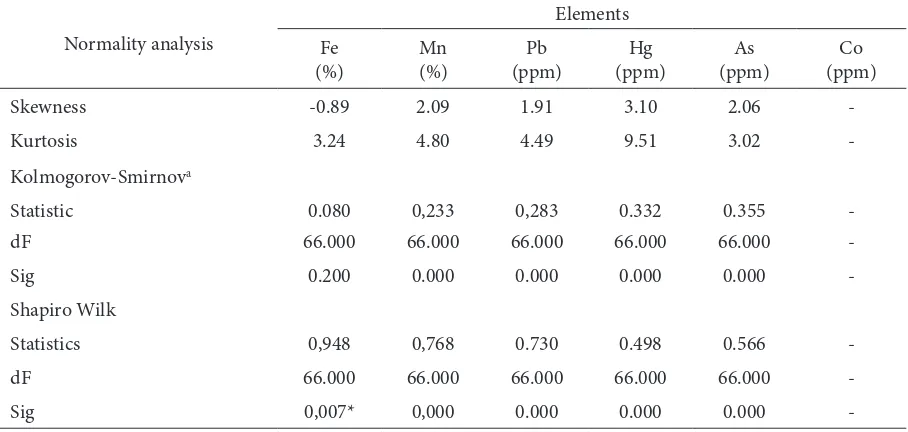
Table 2. Normality analysis of the heavy metal distribution in the soil studied
Normality analysis
Skewness -0.89 2.09 1.91 3.10 2.06
-Kurtosis 3.24 4.80 4.49 9.51 3.02
-Kolmogorov-Smirnova
Statistic 0.080 0,233 0,283 0.332 0.355
-dF 66.000 66.000 66.000 66.000 66.000
-Sig 0.200 0.000 0.000 0.000 0.000
-Shapiro Wilk
Statistics 0,948 0,768 0.730 0.498 0.566
-dF 66.000 66.000 66.000 66.000 66.000
-M Nurcholis, dkk
a. Lilliefors Signiicance Correction
*. his is a lower bound of the true signiicance a. Lilliefors Signiicance Correction
*. his is a lower bound of the true signiicance
he Figure 3 shows that the distribution of Fe content in the studied soil in artisanal mining environment is relatively evenly distributed, i.e. minimum value with a maximum diference is not too great. Based on this igure, total Fe content at the mine activities and amalgamation process of Fe content is relatively low. Fe content in the soil increases with decreasing altitude of location. It is in accordance with the behavior of Fe in minerals of igneous rocks and ater weathering processes so that it becomes the soil constituents. Iron is an element that occupies in igneous
rocks in large quantities, and it is usually in the ferrous
(Fe2+) form. Weathering of the rocks results in the release
of Fe and then this element may changes oxidation to
Fe3+ as the reaction is generally in oxidation state. Iron
oxide in the soil can form various types of oxides that are visually diferent in color, that are: goethite, limonite, or hematite, each of which is brown, yellow, or red. In general, the iron in the soil may role as a soil coloring. Under conditions of oxidative may result in soil with red color, but instead of reductive condition result in soil with gray color. In the mature soil, Fe oxide levels in the soil increased if soil development occurs in neutral to alkaline environment. In this environment many Si is soluble and it is then leached out from soil, while Fe will be in the soil body as a residue so that the Fe content will increase.
Manganese (Mn)
he distribution of Mn in the surface soil is slightly
diferent from Fe (Figure 3). Minerals which had been shown alteration due to weathering release elements, include heavy metal elements, which then become constituents forming soils. With this process, the Mn also like Fe that may role as the coloring soil which is black-colored of soil is expressed by Mn-oxides. Presence of Mn-oxides in the soil proile is initially shaped as mottle-colored black. On soils that have been developed advanced resulting Mn-oxide concretions formation together with Fe-oxides. he presence of Mn oxide in soils can also ix to heavy metals such as Co, Pb, As, Ba [Nurcholis et al., 1997]. In the present study showed that these oxides in gold mine area that using open pit techniques would be exposed to the surface of the soil. he material is then drawn into the material to be processed gold separation.
Mn levels in soil of the amalgamation sites, located in the upper site of mountainous area, show greater than in the lower location (Figure 3). his is because in the amalgamation process the extracted material containing heavy metal elements of the extracted metals, including Mn. Manganese that is an undesirable element in the amalgamation process that is to be a waste material or tailings, so that the tailings were then dispersed around the site of amalgamation process. Activities of amalgamation process in the present study has been going on for many decades, so the tailings that had been produced and spread on the soil surface can increase metal contents in the soil environment.
Lead (Pb)
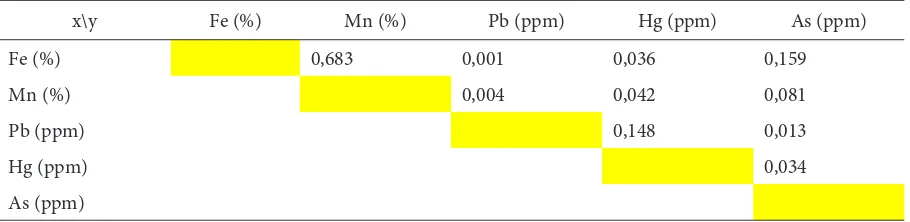
Distribution pattern of the Pb content in soils studied showed of which also centered on a speciic location, which is around the amalgamation process (Figure 3). Pb in the environment in general resulted from alteration of galena (PbS) minerals. In the process of mining this element are also carried in the material being processed, so the element of Pb which is in the waste can increase the content of Pb in the soil surface. Pb can also be ixed in Mn oxide minerals with three kinds of processes, namely: absorbed, special ainity, or forming minerals with Mn [Han et al., 2006;
Nurcholis et al., 1997]. In addition, the presence of Pb is also associated with other types of minerals so that Pb is also spread in the mine environment. Based on the analysis of the correlation between elements that were examined (Table 3), Pb had no correlation with Mn, this is because the current research was conducted on the waste material that had undergone a process of extraction on the amalgamation and then it was spread to the surface soil. Accordingly, these results also give the same result of the distribution of Mn element on the general soil surface.
Mercury (Hg)
he Hg distribution in the mine site and in the amalgamation process is presented in Figure 3. Hg in this area was originated from two diferent sources, namely the alteration of minerals in rocks and the addition of mercury in for the amalgamation process. Gold ore of rocks that was taken from the mine site by miners then it would be crushed manually using hummer, and following process of gold separation from ore by addition with mercury to bind gold as amalgam. he amalgamation process produced two types materials are solids and liquids in the form of colloids. Gold-bound in the mercury was then separated by heating, being the remainder in the form of colloidal and solid materials is processed to reduce the content of the materials and elements that are dangerous to the environment. But if the process of waste management has not been better for the amalgamation process, the environment is still has the potential to be contaminated with mercury (Figure 3). Based on the properties of Hg which is not solid, volatile and easily transported by lowing water, the contaminants Hg in nearby amalgamation can be easily reduced because transported by water low. [Arbestain et al., 2008] reported that extent of contamination of soils and vegetation close to an abandoned Hg-fulminate production plant. A highly contaminated area was identiied close to the former discharge zone for the wastewater produced during the washing procedures at the plant, where the concentrations of Hg in the surface horizons were higher than 1 g kg−1. he same result was also reported by Ariin [Ariin et al., 2015] that higher mercury concentration was close to the artisanal
Table 3. Correlation values among heavy metals
x\y Fe (%) Mn (%) Pb (ppm) Hg (ppm) As (ppm)
Fe (%) 0,683 0,001 0,036 0,159
Mn (%) 0,004 0,042 0,081
Pb (ppm) 0,148 0,013
Hg (ppm) 0,034
M Nurcholis, dkk
processing units, and the levels gradually decrease downstream. he lowering concentration of mercury in water occurs as it is diluted by river system. In this research it was found that the waste spill in the form of colloidal tailings, resulting from amalgamation process,
lows and enter into surface water bodies in the form of water course. Water lows on the soil surface as small stream or gravity low that accumulated to be a small river. he joining of small rivers becoming larger stream, and river water is used as a source of irrigation water for paddy rice crops that located in the middle and bottom of the mountains. So that the source of irrigation water is also potentially containing heavy metals contaminants.
Arsenic (As)
he problem of arsenic in gold mining is crucial because the element is abundant, mobile in acidic reactions, and this element is very dangerous for human life. Arsenic concentration in the luvial water storage ponds (265 μg L-1), soil (in the range of 19–17
384 mg kg-1 ) and dry sediment (in the range of 29–28
600 mg kg-1 ) was identiied in the area of the historical
and recent mining site of Villa de la Paz-Matehuala in Mexico [Razo et al., 2004]. Adsorption by Fe- and Al- oxides and also sulide minerals the soil around the mining areas have led to reduced levels of As in the water. It is widely accepted that surface area, pore volume, pore volume distribution, and pore network of clay can be altered by the acid activation. Acid activated laterites or AAL with concentration of 0.2 N shows higher arsenite/arsenate adsorption with respect to raw laterites or RL [Maiti et al., 2010].
5. Conclusions
Gold mining in Gunung Mas area, Boto village, Wonogiri regioncy have an impact on exposure of heavy metals of the rock into the environment. Soils around the mining area have been contaminated by heavy metals of Mn, Fe, Pb, Hg and As. he amalgamation process that by adding Hg also increase the levels of Hg in the soil, besides that it also extracted ore rocks containing heavy metals as elements that were dissolved in liquid waste. Taillings of the amalgamation process as solid wastes that were exposed on the soil surface gave a role on increase the levels of these metals in the soil. he land is located at the bottom of the mountains of Gunung Mas potentially gaining heavy metals contamination, especially for rice ield which always receives irrigation water from the river that carries with it heavy metals.
he indings of this study show that the soil in the community gold mining area contains the metals of Fe, Mn, Hg, Pb, As. Levels of Fe and Mn in the soil studied with content of 4.69%, and 0.16% are prevalent as dominant elements in the soil, and do not have the potential to negatively impact the environment. he
levels of Hg, Pb, and As which respectively are 83.76 ppm, 79.45 ppm, and 32.00 ppm has the potential to have a negative impact as a pollutant in the soil.
Spatial distribution determined by krigging method indicates that Fe content is increasing with increasing distance from mining location and amalgamation activity, as source of contaminant. In contrast, the spatial distribution of metals Hg, Pb, and As decreases further and further from the source of contaminants.
Mercury is not biodegradable and, if inappropriately discarded, oten combines with other elements in more toxic forms. River dumping can result in dramatic loss of plant and wildlife for considerable distances downstream. To overcome these problems is necessary to design appropriate technology in an efort to mitigate contamination of heavy metals in soil and water.
It is required the study on the characteristics of the waste, the topography, and the climatic conditions are so variable that may role on the environmental impact of artisanal and small gold mining in this area. Accordingly, it is impossible to make a design guide to cover all situations. Each tailings embankment should be designed to suit the conditions as they exist. Indeed, it is needed deep thinking to tailings disposal methods and design the appropriate technology for its storage.
Acknowledgement
his research was granted by the Ministry of Research Technology and Higher Education, Indonesia, for the scheme of Higer Education Excelent Research in the Year Fiscal of 2016.
References
Abouzeid, A.-Z. M., Khalid, A.-A. M., & others. (2011). Mineral Industry in Egypt-Part I: Metallic Mineral Commodities. Natural Resources, 2(01), 35. Adriano, D. C. (2001). Introduction. In Trace elements
in terrestrial environments (pp. 1–27). Springer. Retrieved from http://link.springer.com/ chapter/10.1007/978-0-387-21510-5_1.
Arbestain, M. C., Rodriguez-Lado, L., Bao, M., & Macías, F. (2008). Assessment of mercury-polluted soils adjacent to an old mercury-fulminate production plant. Applied and Environmental Soil Science,
2009. Retrieved from https://www.hindawi.com/ journals/aess/2009/387419/abs/.
.
.
Australian Government. (2016). Hazardous Materials Management - HazardousMaterialsManagmentHandbook_web. pdf. Retrieved June 15, 2017, from https:// industry.gov.au/resource/Documents/LPSDP/ HazardousMaterialsManagmentHandbook_web. pdf.
Bless, A. E. S., Darmawan, Y., & Baan, S. (2016). Spatial Distribution of Trace Elements in Rice Field at Prai District Manokwari. he Indonesian Journal of Geography, 48(1), 1.
Bradl, H. B. (2004). Adsorption of heavy metal ions on
soils and soils constituents. Journal of Colloid and
Interface Science, 277(1), 1–18.
Duruibe, J. O., Ogwuegbu, M. O. C., & Egwurugwu, J. N. (2007). Heavy metal pollution and human biotoxic efects. Journal of Physical Sciences, 2(5), 112–118. Retrieved from http://www. academicjournals.org/article/article1380209337_ Duruibe et al.pdf.
Han, R., Zou, W., Li, H., Li, Y., & Shi, J. (2006). Copper (II) and lead (II) removal from aqueous solution in ixed-bed columns by manganese oxide coated zeolite. Journal of Hazardous Materials, 137(2), 934-942. http://www.sciencedirect.com/science/ article/pii/S0304389406002548.
Hitch, M., Ballantyne, S. M., & Hindle, S. R. (2010). Revaluing mine waste rock for carbon capture
and storage. International Journal of Mining,
Reclamation and Environment, 24(1), 64–79. Hooda, P. S. (Ed.). (2010). Trace elements in soils (pp.
1-596). Chichester: Wiley.
Hu, Y., Liu, X., Bai, J., Shih, K., Zeng, E. Y., & Cheng, H. (2013). Assessing heavy metal pollution in the surface soils of a region that had undergone three decades of intense industrialization and
urbanization. Environmental Science and Pollution
Research, 20(9), 6150–6159.
Iorfa, A. C., Ntonzi, N., Ukwang, E. E., Abara, I. K., & Neji, P. (2011). A study of the distribution pattern of heavy metals in surface soils around Arufu Pb-Zn mine, Northeastern Nigeria, using factor
analysis. Res J Chem Sci, 1(2), 70–80.
Li, X., Lee, S., Wong, S., Shi, W., & hornton, I. (2004).
he study of metal contamination in urban soils of Hong Kong using a GIS-based approach.
Environmental Pollution, 129(1), 113–124.
Lin, Y.-P., Teng, T.-P., & Chang, T.-K. (2002). Multivariate analysis of soil heavy metal pollution and landscape pattern in Changhua county in Taiwan. Landscape and Urban Planning, 62(1), 19–35.
Liu, X., Wu, J., & Xu, J. (2006). Characterizing the risk assessment of heavy metals and sampling uncertainty analysis in paddy ield by geostatistics
and GIS. Environmental Pollution, 141(2), 257– 264.
Maiti, A., Basu, J. K., & De, S. (2010). Removal of arsenic from synthetic and natural groundwater using acid-activated laterite. Environmental Progress & Sustainable Energy, 29(4), 457–470.
Malm, O. (1998). Gold mining as a source of mercury exposure in the Brazilian Amazon. Environmental Research, 77(2), 73–78.
McMahon, G., Subdibjo, E. R., Aden, J., Bouzaher, A., Dore, G., & Kunanayagam, R. (2000). Mining and the environment in Indonesia: Long-term trends and repercussions of the Asian economic crisis.
East Asia Environment and Social Development Unit, he World Bank, Washington DC. Http:// Commdev. Org/Useriles/Files/877_ile_mining_ and_the_environment. Pdf. Retrieved from http:// www.commdev.org/userfiles/files/877_file_
mining_and_the_environment.pdf.
Nies, D.H. (1999). Microbial resistant heavy metals. Appl Microbiol Biotechnol. 51:730-750.
NRCS. (2000). Heavy Metal Soil Contamination. Retrieved June 30, 2017, from http://www. nrcs.usda.gov/Internet/FSE_DOCUMENTS/
nrcs142p2_053279.pdf.
Nurcholis, M., Kinjo, T., & Tokashiki, Y. (1997). Mineralogical and chemical properties of manganese nodules in Java soils developed from diferent parent materials. Clay Science, 10(3), 241–257.
Onken, B. M., & Adriano, D. C. (1997). Arsenic availability in soil with time under saturated and subsaturated conditions. Soil Science Society of America Journal, 61(3), 746–752.
Razo, I., Carrizales, L., Castro, J., Díaz-Barriga, F., & Monroy, M. (2004). Arsenic and heavy metal pollution of soil, water and sediments in a semi-arid climate mining area in Mexico. Water, Air, & Soil Pollution, 152(1), 129-152. https://link. springer.com/article/10.1023%2FB%3AWATE.00 00015350.14520.c1?LI=true
Salim, I. A., Miller, C. J., & Howard, J. L. (1996). Sorption isotherm-sequential extraction analysis of heavy metal retention in landill liners. Soil Science Society of America Journal, 60(1), 107-114. Sarkar, D., Essington, M. E., & Misra, K. C. (1999).
Adsorption of mercury (II) by variable charge surfaces of quartz and gibbsite. Soil Science Society of America Journal, 63(6), 1626–1636.
Smith, K. S. (2007). Strategies to predict metal mobility
in suricial mining environments. Reviews in
Engineering Geology, 17, 25–45.
M Nurcholis, dkk
International journal of molecular sciences, 9(4), 434-453.
White, J. G., Welch, R. M., & Norvell, W. A. (1997). Soil zinc map of the USA using geostatistics and geographic information systems. Soil Science Society of America Journal, 61(1), 185–194.