Phonotactics, Parsing and Productivity
1Jennifer Hay and Harald Baayen
University of Canterbury, New Zealand; University of Nijmegen, The Netherlands.
1
Introduction and Background
Affixes display massive variability in morphological productivity. Some affixes (such as English-ness) are highly productive, and regularly used to create new words. Other af-fixes are completely non-productive (e.g-th). Individual affixes can be differently produc-tive with different kinds of bases (see, e.g. Baayen and Lieber 1991), and even across dif-ferent registers (Plag et al. 1999). This type of variable behavior makes the phenomenon very complex to model, and has even lead some linguists to dismiss it as linguistically uninteresting.
In short, productivity is a continuum and belongs to a theory of performance which answers questions about how linguistic knowledge is used rather than a theory of competence which answers questions about the nature of linguistic knowledge. (Mohanen 1986: 57)
However, members of a speech community display remarkable agreement about which affixes can be used in which contexts to create new words (Aronoff 1980). It is not the case, for example, that-this fully productive for some speakers, and nonproductive for others. Surely knowledge of possible words in one’s language, then, is an aspect of the “nature of linguistic knowledge”. The question of where this knowledge comes from is an impor-tant one, and answers have proved elusive. Aronoff (1976:35) dubs productivity “one of the central mysteries of derivational morphology”.
This paper argues that morphological productivity is (at least partially) emergent from the lexicon. The more morphologically complex forms containing an affix are in the lexi-con, the more productive that affix will be. Of course, it has often been argued that there
1Thanks are due to Janet Pierrehumbert, Ingo Plag, two anonymous reviewers, and our audience at ESSE 6 for their helpful
is no way of predicting the degree of productivity of an affix given its lexical properties. Type and token frequency – the most likely predictors, cannot straightforwardly be re-lated to productivity (see, e.g. Bauer 2001). The lack of such relationships appears to cast considerable doubt on an emergent view of productivity.
However Hay (2000) and Hay and Baayen (2002) have argued that, while type and token frequency cannot be straightforwardly related to productivity, frequency counts of decomposed forms in the lexicon can predict the degree to which an affix is likely to be productive. The problem with doing a frequency count of all forms containing an affix, is that not all affixed forms contain the affix to the same degree. Some affixed words are highly affixed, and are highly decomposable (e.g. tasteless). Other affixed words appear more opaque, and tend to be characterised by whole word access, rather than parsing (e.g. listless). In Hay and Baayen (2002) we demonstrate that the former set facilitate productivity much more strongly than the latter set.
We now extend this work to investigate the role of junctural phonotactics. There is evidence that low probability junctural phonotactics facilitate morphological decompo-sition. We investigate whether the results reported by Hay and Baayen (2002) can be extended to the domain of phonotactics. If parsing and productivity are truly linked, we predict a correlation between the type of junctural phonotactics created by an affix, and the productivity of that affix.
Sections 2 and 3 briefly outline our assumptions regarding productivity and parsability respectively. Section 4 introduces phonotactics, and demonstrates that junctural phono-tactics are, as predicted, highly correlated with measures of parsing and productivity.
2
Productivity
Baayen and his colleagues (Baayen 1992, 1993, 1994, Baayen and Lieber 1991, Baayen and Renouf 1996, and elsewhere), have discussed a number of possible metrics for measuring various aspects of affix productivity. Perhaps the most widely used and cited metric arising from this body of work is the metricP – which measures the category-conditioned
degree of productivity, or “productivity in the narrow sense”. P is calculated as shown
in (1).
(1) P =V1/N
For any given affix, V1 is the number of forms containing that affix occurring exactly
once in a large corpus – the so called hapax legomena. N is the total number of tokens observed in the corpus containing that affix. Baayen assumes that the number of hapaxes observed for a given affix should be highly related to the number of true neologisms. For a non-productive affix, there will be no true neologisms, and so, as the corpus size increases, the number of words encountered just once should be minimal. For a productive affix, however, we expect to find neologisms, even in a large corpus. Large numbers of hapaxes, then, are “a sure sign that an affix is productive” (Baayen and Renouf 1996:74).
P ∗is the hapax-conditioned degree of productivity. It is measured by calculating what
proportion of all hapaxes in the corpus are associated with the particular affix of interest.
P ∗expresses the probability that, if we are encountering a newly coined word, that word
will contain the affix in question. Whenever one is working with a uniform corpus size (as we will be here), the total number of hapaxes in the corpus is a constant, and soP ∗
can be simply represented byV1 – the number of hapaxes associated with the affix (see Baayen 1994).
Baayen (1994) argues that in addition to P andP ∗, productivity is also reflected inV
– the type frequency of the affix, i.e. how many different words it has been observed in. TogetherV,P andP ∗assess the overall productivity of an affix.
are interested. By investigating the degree to which factors relating to decomposition line up with measures of productivity, then, we can assess the degree to which the two are related.
3
Parsability
We work under the assumption that both parsing and non-parsing are possible strategies for speech perception. Some complex words are extremely likely to be parsed, and others are more likely to be accessed whole. It is important to note that we don’t regard parsing as an absolute. We assume that decomposition is a continuum, and can occur to different degrees (Hay 2000). Both parsing and whole-word access are likely to play some role in the access of most affixed words – and may interactively converge on the appropriate meaning representation (Baayen and Schreuder 2000). Thus, when we search for factors related to the decomposition of complex words, we are interested in identifying factors which affect the relative contribution of parsing and whole-word access.
A large range of factors are likely to influence the probability and degree of parsing on any given occasion. One of these factors is the frequency of the derived word, relative to the frequency of the base word (Hay 2001). Hay and Baayen (2002) demonstrate that this is related to productivity.
3.1 Relative Frequency
Hay (2001) distinguishes between derived forms which are more frequent than the bases they contain (e.g. illegibleis more frequent thanlegible), and derived forms which are less frequent than their bases (e.g. illiberalis less frequent thanliberal.) Derived forms which are more frequent than their bases (e.g. illegible) are more prone to whole-word access (i.e. non-parsing), regardless of the absolute frequency of the derived form (Hay 2000, 2001). Thus, low frequency forms may be accessed directly if their base is of even lower frequency. And high frequency forms may be parsed if the base is higher frequency still.
which are highly prone to parsing and those which are not. While the relative frequency of the derived form and the base is clearly important, where is the exact location of the relevant threshold for parsing? Exactly how frequent does the base need to be, relative to the derived form, in order to facilitate parsing?
Hay and Baayen (2002) set out to refine the notion, investigating exactly how frequent the base form needs to be, relative to the derived form, in order to facilitate parsing. Based on relative frequency, they motivate a threshold, the so-called parsing line, above which an affixed form is likely to be decomposed, and below which the affixed form is not likely to be decomposed. This parsing line enables us to estimate, for any given affix, which words containing that affix are likely to be highly decomposable (those falling well above the line), and those which are likely to be non-decomposable and characterised by whole word access (those falling well below the line). Thisparsing lineis somewhat higher than proposed in Hay (2001), where it was assumed that all forms would be parsed for which the base frequency is higher than the derived frequency. In fact, there is a whole-word bias, such that if a base is just marginally more frequent than the word containing it, it is unlikely to be parsed. If a derived word and its base are of equal frequency, the direct route is likely to have an advantage in terms of access time over the parsing route. The distributional properties of words (both types and tokens) with respect to the parsing line is predictive of various aspects of an affix’s productivity.
3.1.1 Parsing Ratios
productivity – P. P tells us, given we are encountering a word containing a particular
affix, the probability that that word has been productively coined.
3.1.2 The Intercept
Hay and Baayen demonstrate that when base frequency is regressed on derived fre-quency, there is a fair amount of variation across affixes. In particular the location of the intercept of this line on the y axis (base frequency) varies considerably. From a pro-duction perspective, the intercept can be considered a measure of how frequent a base word needs to be before it is likely to spawn an affixed word. Affixes with high inter-cepts are affixes for which the base words are fairly high frequency relative to the derived forms.
From a perception perspective, then, a high intercept reflects a distribution in which bases tend to be frequent, relative to derived forms, and so many forms are prone to pars-ing. The intercept, like the parsing ratios, is a measure which is calculated with reference to specific affixes (i.e. it is category-conditioned), and it correlates positively withP.
3.1.3 Parsing Levels
While the calculation of parsing ratios is effective for estimating the category-conditioned degree of productivity, Hay and Baayen argue that is is not the most appropriate measure of the overall activation level of an affix. Rather, a more accurate comparison of the overall activation level of affixes can be achieved by considering the actual number of forms for each affix that are parsed.
In terms of perception, there is a sense in which the forms which are not parsed do little or nothing to contribute to the activation level of the affix. Rather, the degree to which the affix is activated can be assessed by calculating the total number of forms containing that affix which are characterized by decomposi-tion. (Hay and Baayen 2002:224)
overall productivity of encountering a new word containing that affix (the number of hapaxes – V1), and the degree of generalisability (the number of different types associated with it – V).
In sum, Hay and Baayen set out to investigate the relationship between parsing in perception, and productivity in production. They concentrated on frequency-based es-timates of parsing, and this provided strong evidence for a perception-production link. Given any particular affix, the likelihood that it will be parsed during access is predictive of the likelihood of a word containing that affix having been productively coined. And the likelihood, given all productively coined words, that a coined word will contain the affix of interest, is a function of the frequency of that affix – as measured by the number of forms containing the affix which tend to be accessed via parsing.
That these findings are so robust is a testament to the importance of frequency in speech perception. However frequency is certainly not the only factor which is likely to affect the likelihood of a complex word being decomposed. In fact, we would predict that any factor which is involved in the segmentation of words from running speech also plays some role in affecting morphological decomposition. Such cues include the stress pattern (Cutler and Norris 1988, Juszcyk, Cutler and Redanz 1993), acoustic-phonetic cues (Lehiste 1972), prosody (Gleitman, Gleitman, Laundau and Wanner 1988), knowing a sub-string (Dahan and Brent 1999) and attention to patterns at utterance boundaries (Brent and Cartwright 1996). In this paper we concentrate on one factor which has received considerable attention in the recent literacture – the role of phonotactics. Phonotactics are exploited for the segmentation of speech, and so therefore must affect morphological decomposition in perception. If parsing and productivity are linked, then, we shoud hy-pothesize a relationship between the nature of the junctural phonotactics created by an affix and that affix’s productivity.
4
Phonotactics
at low probability phoneme transitions (see, e.g. Saffran et al. 1996a, 1996b, McQueen 1998). This can be modelled by a processor which operates prelexically – positing bound-aries inside phoneme transitions which are unlikely to occur word-internally. Neural net-work models have also been used to demonstrate that distributional information related to phonotactics can inform the word segmentation task in language acquisition (Elman 1990, Christiansen et al. 1998, Allen and Christiansen 1996).
This has important implications for complex words. If the phonology across a mor-pheme boundary is unlikely to occur mormor-pheme internally, then the preprocessor will posit a boundary, and so facilitate decomposition. For example, the /pf/ transition in
pipefulis unlikely to occur within a simple word in English. The presence of a phonotac-tically marked juncture will therefore strongly facilitate decomposition in speech percep-tion.
Hay (2000) and Hay et al. (in press) present experimental evidence that English speak-ers do, indeed, use phonotactic information to segment words into component mor-phemes. Words with high probability junctural phonotactics across the morphological boundary (e.g. insincere) are less prone to decomposition in speech perception than words with low probability junctural phonotactics (e.g. inhumane). Decomposition in speech perception leads to decomposed forms in the lexicon. If decomposed forms in the lexicon lead to productivity, we therefore predict there to be a relationship between the junctural phonotactics associated with an affix, and that affix’s productivity.
As a first step towards a quantitative investigation of the relationship between phono-tactics and productivity, Hay (2000) reported a correlation between the phonophono-tactics of a set of 12 English consonant-final prefixes and consonant-initial suffixes, and their degree of morphological productivity. For any given affix, the proportion of words creating an illegal phonotactic juncture was a significant predictor of that affix’s productivity. This pilot result encouraged us to design a study to investigate whether such a relationship proves robust over a large number of affixes.
Plag (2002) has argued against Hay (2000)’s hypothesised link between phonotactics and productivity. He does this by taking 12 suffixes, five of which begin with consonants, and demonstrating that the consonant-initial suffixes are not on average more productive than the vowel-initial suffixes. The segmental make-up of suffixes alone, then “is not a good predictor for the productivity and parsability of suffixes and can be easily over-ruled by other mechanisms” (Plag 2002:299). We would agree with Plag that phonotactics alone cannot predict productivity or parsability. As will be demonstrated below, phonotactics works together with a large number of other factors which together facilitate parsability and productivity in the lexicon.
4.1 Measuring phonotactics
Our calculations are based on a set of words extracted from the CELEX Lexical Database (Baayen, Piepenbrock, and Gulikers, 1995), which is based on an early version of the Cobuild corpus (Renouf, 1987) that contained some 18 million words. The English database in CELEX provides the morphological segmentation for a great many complex words: all the words in the LDOCE machine-readable dictionary, as well as all words in the Cobuild corpus down to a frequency threshold of 15 occurrences per 18 million – we refer to this as the segmentation list. It also provides a separate, unanalysed list of all character strings occurring in the Cobuild corpus, together with their frequency of occurrence in the corpus (the string list).
contained the resultant affixes, and their corresponding monomorphemic base word were then extracted from the segmentation list together with their frequency of occurrence. Any affix which was not represented by at least ten such words was then discarded. This process resulted in a list of 80 affixes (54 suffixes and 26 prefixes).
Because our investigation involved the measurement of productivity, we were anxious that our materials contained representative frequency counts. It was especially important that this was true of the lower frequency range – the part of the word frequency distribu-tion which dominates the calculadistribu-tion ofP (the category conditioned degree of
productiv-ity – see Baayen 1989, 1992). The segmentation list is problematic in this respect, because it omits any complex word which appears in Cobuild with a frequency below 15 per 18 million, and which is not listed in the LDOCE dictionary. A consequence of this is that, especially for the more productive affixes, the segmentation list is missing at least half of the word types that actually occur in the Cobuild corpus.
To minimise this problem, we worked with the CELEX string list, which includes all of the word-forms present in the Cobuild corpus, including a great many misspelled words, hyphenated forms, numbers, and combinations of numbers and letter sequences, and attempted to automatically extract all affixed words from this list which did not appear in the segmentation list (see Hay and Baayen 2002 for details).
Thus, the statistics reported here are based on the affixed forms with monomorphemic bases as available in the segmentation list, supplemented with the forms extracted from the string list. In cases in which CELEX includes multiple entries for the same word (e.g. for different meanings, or different parts of speech), the frequency counts of these entries were summed together2.
For each of the 80 affixes we calculated the probability of the phonotactic transition between the base and affix for all bimorphemic words listed in CELEX as containing that affix. We used the transcription provided by CELEX as our data. For example the word
businessappears with the transcription [bIz][nIs], and the wordbusynessappears with the transcription [bI][zI][nIs]. For the former, we takez.nas the transition, and for the latter
2Note that this process was not sensitive to distinctions between homonymous affixes. For example nominal-fuland adjectival-ful
I.n.
Probabilities were calculated on the basis of the transcriptions provided for a corpus of 11383 monomorphemic words from CELEX (see Hay et al. in press). Transitions which don’t occur at all in English monomorphemes can be considered to be illegal phonotactics in English, and would receive a probability of zero. Such transitions would provide an excellent cue to the presence of a boundary during speech perception. On the other hand, transitions which occur with high probability in English monomorphemes are phonotac-tically well-formed, and are unlikely to facilitate parsing.
We chose to calculate probabilities in a syllable-position-sensitive manner, in keeping with patterns of English phonotactics. The transition /mb/, for example, exists in coda-onset transitions (e.g. timber, symbol), but the phoneme transition is illegal inside English codas. So it is necessary to calculate probabilities in a syllable-position-sensitive man-ner, in order to take into account variation in wellformedness across different syllable positions. For each affixed word in our corpus, phonemic transcriptions and syllable seg-mentations from CELEX were used to calculate the probability of the transition across the morpheme boundary occurring in the relevant syllabic position in a monomorphemic word. Codas, onsets and nuclei were all treated as atomic units for the purpose of this calculation (e.g. /st/ and /t/ were treated as completely separate onsets, and /st/ onsets did not contribute to the probability of /t/ onsets at all).
For example, the probability of the junctural phonotactics in investment was calcu-lated as the joint probability of encountering a coda-onset transition, and of encountering /st.m/. And the probability forsqueamishwas calculated as the probability of encounter-ing an onset-nucleus transition, and of that transition beencounter-ing /mI/.
(2) investmentjuncture probability:
p(coda-onset transition)∗p(/st.m/ given a coda-onset transition)
(3) squeamishjuncture probability:
p(onset-nucleus transition)∗p(/mI/ given an onset-nucleus transition)
transi-tion is onset-internal, and-th, e.g. warmthwhere it is coda-internal). These affixes were excluded, to maintain ease of calculation.
Our hypothesis was that there would be a relationship between the nature of the phonotactics, and morphological productivity. As with the frequency-based measures, there are two aspects of an affix’s phonotactics that could potentially play a role.
The first is the degree to which the phonotactics of each affix facilitates parsing (mea-sured as a proportion, or a category-conditioned probability), and the second is the over-all number of forms containing the affix for which the phonotactics facilitates parsing. Based on the results described above, we could expect the former measure to correlate with the category conditioned degree of productivity –P, and the latter to correlate with
the overall number of hapaxes (V1), and the type frequency of the affix (V).
Of course there is no objective basis on which to establish a phonotactics-based parsing threshold (where transitions below a certain probability are parsed, and above it are not). Indeed there is no reason to think that such a threshold exists – we are clearly dealing with a probabilistic effect – the more likely the phoneme transition is, the less likely the form is to be decomposed.
We attempted to approximate the degree to which the affix tends to create well-formed junctures in two ways. The first was simply to calculate the proportion of derivatives containing completely illegal transitions(combinations of phonemes which never occur inside monomorphemic words). While such forms are likely not the only ones for which the phonotactics facilitates decomposition, they are the subset where we can be relatively confident that decomposition is likely to take place. Twenty-three affixes formed consis-tently legal phonotactics – that is, the proportion of illegal phonotactics created was 0. Only one affix created consistently illegal phonotactics (self-).
more probabilistic measure, then, helps to establish whattypeof phonotactics is most re-lated to measures of productivity, and enables us to distinguish the degree to which any phonotactic effects observed are truly probabilistic.
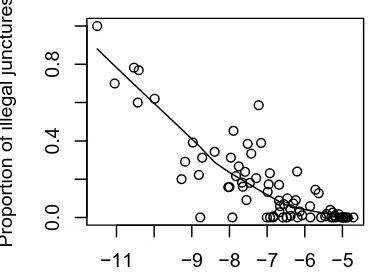
In order to make such a comparison, we also calculated theaverage probability of the juncturescreated by each affix. This, we predicted, contains more information, and so is likely to provide a more accurate assessment of the degree to which the phonotactics of each individual affix facilitates decomposition. The average junctural probability ranged from 0 (forself-) to .009004 (for-ive). self-was the only affix for which all words contained illegal junctures. The lowest non-zero average was .000016 (for-hood).
Finally, we adopted as a heuristic to gauge the overall number of forms for which the phonotactics facilitate parsing simply thenumber of words containing that affix which contain an illegal transition. This ranged from zero (for twenty-three affixes) to 267 (for
-ly).
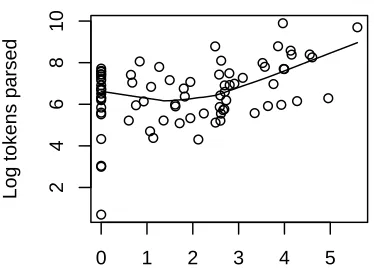
The three measures calculated were all highly correlated with one another. These rela-tionships are shown in figure 1.
In the following section we investigate the degree to which phonotactics correlates with a variety of measures associated with affix behaviour.
4.2 Phonotactics and Productivity
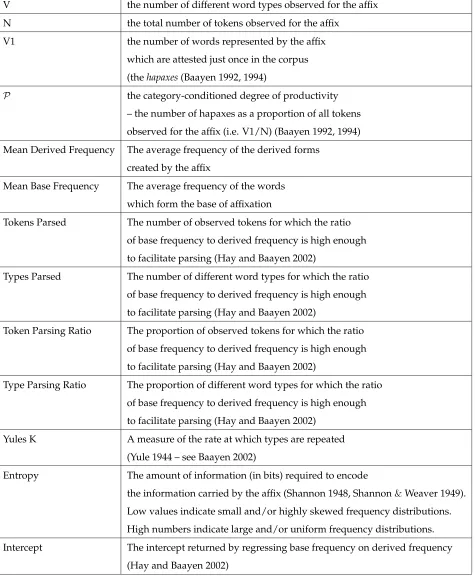
We conducted an exploratory investigation into the relationship of the three phonotactics-based measures with 13 characteristics of the affixes. These characteristics are all associ-ated with aspects of the affixes’ decomposability, productivity or degree of use. They are listed in table 1. All of the measures were calculated automatically on the basis of information in the CELEX lexical database, supplemented as described in section 4.1
−11 −9 −8 −7 −6 −5
0.0
0.4
0.8
Log(average probability of juncture)
Proportion of illegal junctures
−11 −9 −8 −7 −6 −5
012345
Log(average probability of juncture)
Log(number of illegal junctures+1)
0 1 2 3 4 5
0.0
0.4
0.8
Log(Number of illegal junctures+1)
Proportion of illegal junctures
V the number of different word types observed for the affix N the total number of tokens observed for the affix
V1 the number of words represented by the affix which are attested just once in the corpus
(thehapaxes(Baayen 1992, 1994)
P the category-conditioned degree of productivity – the number of hapaxes as a proportion of all tokens observed for the affix (i.e. V1/N) (Baayen 1992, 1994) Mean Derived Frequency The average frequency of the derived forms
created by the affix
Mean Base Frequency The average frequency of the words which form the base of affixation
Tokens Parsed The number of observed tokens for which the ratio of base frequency to derived frequency is high enough to facilitate parsing (Hay and Baayen 2002)
Types Parsed The number of different word types for which the ratio of base frequency to derived frequency is high enough to facilitate parsing (Hay and Baayen 2002)
Token Parsing Ratio The proportion of observed tokens for which the ratio of base frequency to derived frequency is high enough to facilitate parsing (Hay and Baayen 2002)
Type Parsing Ratio The proportion of different word types for which the ratio of base frequency to derived frequency is high enough to facilitate parsing (Hay and Baayen 2002)
Yules K A measure of the rate at which types are repeated (Yule 1944 – see Baayen 2002)
Entropy The amount of information (in bits) required to encode
the information carried by the affix (Shannon 1948, Shannon&Weaver 1949).
Low values indicate small and/or highly skewed frequency distributions. High numbers indicate large and/or uniform frequency distributions. Intercept The intercept returned by regressing base frequency on derived frequency
(Hay and Baayen 2002)
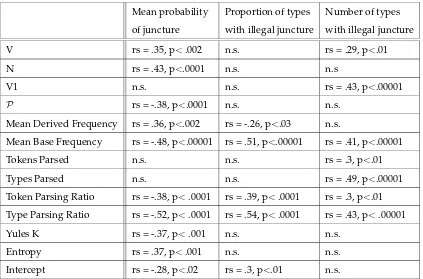
Mean probability Proportion of types Number of types of juncture with illegal juncture with illegal juncture V rs = .35, p<.002 n.s. rs = .29, p<.01
N rs = .43, p<.0001 n.s. n.s
V1 n.s. n.s. rs = .43, p<.00001
P rs = -.38, p<.0001 n.s. n.s.
Mean Derived Frequency rs = .36, p<.002 rs = -.26, p<.03 n.s.
Mean Base Frequency rs = -.48, p<.00001 rs = .51, p<.00001 rs = .41, p<.00001
Tokens Parsed n.s. n.s. rs = .3, p<.01
Types Parsed n.s. n.s. rs = .49, p<.00001 Token Parsing Ratio rs = -.38, p<.0001 rs = .39, p<.0001 rs = .3, p<.01 Type Parsing Ratio rs = -.52, p<.0001 rs = .54, p<.0001 rs = .43, p<.00001 Yules K rs = -.37, p<.001 n.s. n.s.
Entropy rs = .37, p<.001 n.s. n.s. Intercept rs = -.28, p<.02 rs = .3, p<.01 n.s.
Table 2: Spearman’s correlations for the three phonotactic measures, and various aspects of affix behaviour
of that set tend to facilitate parsing? The rightmost column shows correlations with the absolute number of types for which the affix creates illegal juncture. Thus, for the first two measures, a very frequently used affix which tends to create illegal junctures could score similarly to an infrequent affix which tends to create illegal junctures. However on the last measure, the former affix would score more highly than the latter.
There are several things of note about table 2. First, phonotactics are clearly related to decomposition and productivity. Measures associated with phonotactics correlate well with a surprisingly large proportion of the factors we investigated.
statistically predicted by the proportion of illegal junctures that cannot also be predicted by the average probability of the juncture. In cases which both measures prove statisti-cally significant, the amount of variance explained is roughly the same. Similar profiles emerge when prefixes and suffixes are considered separately. We therefore disregard the proportion of types with illegal juncture for the rest of the paper – it has no explanatory power over and above the mean probability of juncture created by the affix. It also cor-relates very highly with the other two phonotactic measures (and more highly than the remaining two correlate with one another – see figure 1).
Third, as predicted, the number of types with illegal junctures appears to be associated with different characteristics than the mean probability. In fact, for all three variables for which the mean juncture probability is not statistically predictive, the number of types with illegal junctures does correlate significantly. These two measures, between them, are statistically predictive of all thirteen aspects of an affix’s behaviour that we have consid-ered.
Also as predicted, the mean probability is more closely connected with aspects to do with category-internal behaviour of the affix, and the mean number of types with illegal junctures is more associated with global aspects to do with the extent of use of the affix, such as the number of hapaxes encountered.
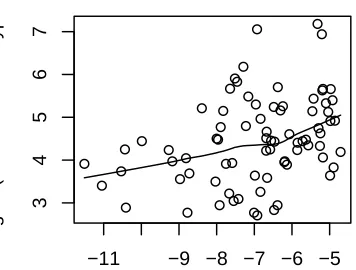
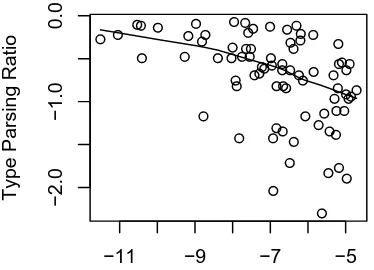
Figures 2 and 3 show how the mean probability of juncture correlates with a variety of measures. The three measures which the mean probability of juncture is not associated with are shown in figure 4, as they related to the number of forms with illegal junctures.
−11 −9 −8 −7 −6 −5
1.6
2.0
2.4
Log(average probability of juncture)
Log N (total number of tokens)
−11 −9 −8 −7 −6 −5
34567
Log(average probability of juncture)
Log V (total number of types)
−11 −9 −8 −7 −6 −5
0.5
1.5
2.5
3.5
Log(average probability of juncture)
Mean Derived Frequency
−11 −9 −8 −7 −6 −5
45678
Log(average probability of juncture)
Mean Base Frequency
−11 −9 −7 −5
Intercept between base and derived frequen
cy
0 1 2 3 4 5
012345
Log(number of types with illegal juncture)
Log V1
0 1 2 3 4 5
123456
Log(number of types with illegal juncture)
Log types parsed
0 1 2 3 4 5
2468
1
0
Log(number of types with illegal juncture)
Log tokens parsed
Is the phonotactics really so all-powerful? Does it have such a pervasive effect in the lexicon, that almost any aspect of an affix is directly related to the phonotactics of the affix? The numbers in table 1 seem to suggest that this may be the case.
Of course, not all of the factors investigated here are independent of one another. The number of types and the number of tokens represented by an affix, for example, are likely to be highly correlated. So if the phonotactics is correlated with one of these measures, we should predict that is is also related to the other.
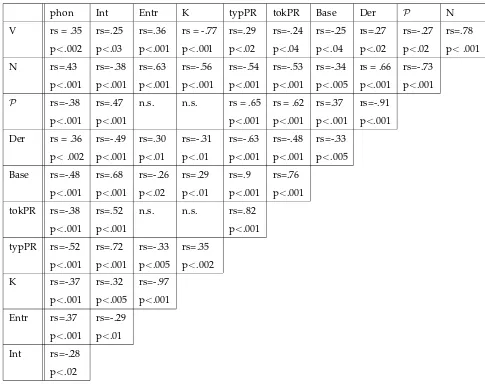
In order to try and disentangle the effects of the phonotactics somewhat more closely, we investigated the 10 factors which correlated well with mean probability of an affix’s phonotactics, to establish the degree to which these aspects of an affix’s behaviour also correlated with one another. What we found was surprising: almost everything is corre-lated with everything. The spearman’s correlation coefficients are shown in table 3.
It is quite clear that many of these elements are highly inter-related. As soon as you know one thing about an affix (e.g. the type of phonotactics it tends to create, the average frequency of the derived words, or the level of productivity) – then many other things can be predicted.
On the other hand, not everything is correlated. The token parsing ratio and category conditioned degree of productivity, for example, do not seem to correlate with Entropy, nor with K. And recall that table 3 only includes factors which themselves correlate signif-icantly with mean phonotactic probability. The hapaxes, types parsed, and tokens parsed, are therefore not included (although we know from table 2 that they correlate with a dif-ferent aspect of an affix’s phonotactics). In order to try and extract the relevant patterns from this rather overwhelming set of correlations, we subjected the data-set to a Principal Components Analysis.
5
Principal Components Analysis
phon Int Entr K typPR tokPR Base Der P N V rs = .35 rs=.25 rs=.36 rs = -.77 rs=.29 rs=-.24 rs=-.25 rs=.27 rs=-.27 rs=.78
p<.002 p<.03 p<.001 p<.001 p<.02 p<.04 p<.04 p<.02 p<.02 p<.001 N rs=.43 rs=-.38 rs=.63 rs=-.56 rs=-.54 rs=-.53 rs=-.34 rs = .66 rs=-.73
p<.001 p<.001 p<.001 p<.001 p<.001 p<.001 p<.005 p<.001 p<.001 P rs=-.38 rs=.47 n.s. n.s. rs = .65 rs = .62 rs=.37 rs=-.91
p<.001 p<.001 p<.001 p<.001 p<.001 p<.001 Der rs = .36 rs=-.49 rs=.30 rs=-.31 rs=-.63 rs=-.48 rs=-.33
p<.002 p<.001 p<.01 p<.01 p<.001 p<.001 p<.005 Base rs=-.48 rs=.68 rs=-.26 rs=.29 rs=.9 rs=.76
p<.001 p<.001 p<.02 p<.01 p<.001 p<.001 tokPR rs=-.38 rs=.52 n.s. n.s. rs=.82
p<.001 p<.001 p<.001 typPR rs=-.52 rs=.72 rs=-.33 rs=.35
p<.001 p<.001 p<.005 p<.002 K rs=-.37 rs=.32 rs=-.97
p<.001 p<.005 p<.001 Entr rs=.37 rs=-.29
p<.001 p<.01 Int rs=-.28
p<.02
Table 3: Pairwise spearmans correlations for 10 variables:phon= mean junctural probability;int= intercept of regressing base frequency on derived frequency; Entr = entropy; K= Yule’s K (repeat rate measure);
typPR= type parsing ratio;tokPR= token parsing ratio;Base= average log base frequency;Der= average
one or two crucial dimensions? Principal Components Anaylsis is a useful technique for exploring data with many dimensions – it attempts to reduce the dimensionality of the data. Everitt (1996:217) describes Principal Components Analysis as “a multivariate tech-nique in which a number of related (correlated) variables are transformed into a smaller set of unrelated (uncorrelated) variables .... The new variables derived by a Principal Components Analysis are linear combinations of the original variables.”
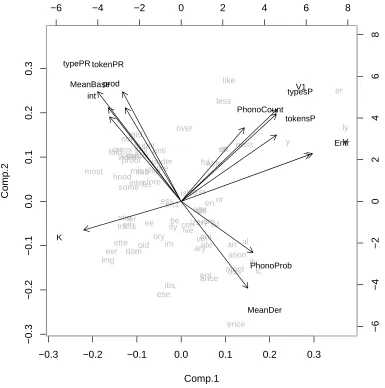
Two principal components emerged. These are shown in figure 5. The values for the first component are plotted on the x axis, and values for the second component appear on the y axis.
The variables underlying the x and y axes are plotted in the space as black arrows. The arrows indicate how the directionality of the variable lines up with the two compo-nents. For example, affixes with high mean derived frequency values have high values for components one and low values for component two, and so appear at the bottom right of the graph. Affixes with high values for K have low values for component 1, and near-zero values for component 2, and appear toward the center/lower left of the graph. V and Entropy appear superimposed on one another at the top right. The affixes them-selves appear on the graph in light grey, to indicate how they are positioned with respect to the two components (and so their relationship to the various variables shown). Af-fixes which appear close to one another show similar characteristics with respect to the variables shown.
One cluster of variables appears on the left-sloping diagonal. This clustering of vari-ables reveals that high token and type-parsing ratios, high mean base frequency, high productivity (P), low mean derived frequency, and low-probability junctural
phonotac-tics tend to co-occur. Affixes toward the top left of figure 5 possess these characterisphonotac-tics (e.g. non-, self-, -proof, -ship). Affixes toward the bottom right have low proportions of both types and tokens that are parsed, and tend to create phonotactically-legal high fre-quency forms, which have low frefre-quency base forms. These affixes have low values ofP
and include-ence, -ity, -ic, -ation.
parsed co-occurs with a high number of hapaxes coined, a large number of different types (V), high entropy (large and/or uniform frequency distributions), and low K (low prob-ability of sampling the same word twice running). Affixes with this set of characteristics include-er, -ly, -ness, -likeand-ly. Conversely, affixes at the bottom left, such as-eer, -ling, -ette and trans- tend to have a very small number of different types, a small number of both types and tokens parsed, a small number of hapaxes coined, a low entropy (small distribution, likely with a few very high frequency words), and a high K (repeat rate). This dimension appears to encapsulate aspects to do with degree of use, or “usefulness”. Table 4 lists the affixes appearing in figure 5, broken down by the quadrant of the graph in which they appear. For convenience, we label the top left quadrant of the graph the “parsable” quadrant, and the top right the “useful” quadrant. In general the affixes ap-pearing toward the top of the graph can be considered the more robust affixes of English. They should be predicted to have relatively robust representations, either through brute force of frequency – being represented by very many words, or through possessing char-acteristics (phonotactics, frequency distributions) which facilitate parsing. Obviously we are dealing here not with four discrete classes, but rather a continuous multidimensional space. We list the four classes here only for convenience of reference. And some affixes are much more prototypical representatives of their “classes” than others.
5.1 “Parsability”
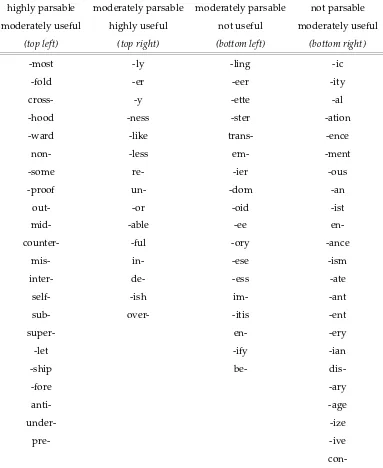
−0.3 −0.2 −0.1 0.0 0.1 0.2 0.3
highly parsable moderately parsable moderately parsable not parsable moderately useful highly useful not useful moderately useful
(top left) (top right) (bottom left) (bottom right)
-most -ly -ling -ic
-fold -er -eer -ity
cross- -y -ette -al
-hood -ness -ster -ation
-ward -like trans- -ence
non- -less em- -ment
-some re- -ier -ous
-proof un- -dom -an
out- -or -oid -ist
mid- -able -ee
en-counter- -ful -ory -ance
mis- in- -ese -ism
inter- de- -ess -ate
self- -ish im- -ant
sub- over- -itis -ent
super- en- -ery
-let -ify -ian
-ship be-
dis--fore -ary
anti- -age
under- -ize
pre- -ive
relative frequency ratios andP cluster so tightly together in figure 5 lends strong support
to the hypothesis that parsing and productivity are causally linked. These figures are all normalised for the number of words in the affix category. Thus there would be no reason (apart from a link between perception and production) to expect a correlation between phonological factors, and the rate of new word formation.
Similarly, the clustering of the mean phonotactic probability and variables relating to relative frequency is also not trivial. The less probable the junctural phonotactics are, the more frequent the base words tend to be (relative to their derived words). It is words with frequent junctural phonotactics (i.e. monomorpheme-like) which have the highest potential for whole-word bias, and the meaning proliferation and semantic drift which can result. Words which are prone to whole word access can proliferate meaning, and thereby also increase in frequency3. Words with monomorpheme-like phonotactics are
therefore much more likely to overtake their bases in frequency than words with low probability or illegal junctural phonotactics.
5.2 “Usefulness”
The cluster of right-sloping arrows groups together a number of measures which relate to the overall degree of use (or usefulness) of the affix. This dimension will tend to separate frequently occurring affixes from less frequently occurring affixes. Affixes which are rep-resented by a large number of types also tend to be reprep-resented by many hapaxes, and a large number of both types and tokens which are prone to parsing, as assessed both on the basis of relative frequency, and the number of forms with illegal phonotactics. These af-fixes tend to have high entropy - symptomatic of a large distribution with many hapaxes. And they tend to have a low K (repeat rate) – if you encounter two words containing the affix, the chances of them being the same word are quite low.
3A reviewer questions the link between decomposition and polysemy, pointing out that decomposed words can still display
poly-semy, and that affixes themselves can be polysemous. This is certainly true. We assume that all derived words can display polysemy.
For fully decomposed words, this polysemy may came from base-word polysemy and/or affixal polysemy. However we assume
that, if there is no robust whole word representation, the word itself is unlikely to acquire additional meanings above and beyond the
polysemy displayed by its parts. For words which tend to be accessed directly, we assume the representation of the whole-form may
In short, the category expressed by these affixes is a very useful one. We frequently encounter words containing these affixes - and at least some of the time these words are relatively parsable. The affix has already combined with a large number of words, and the frequency with which speakers feel the need to create new words containing the affix is quite high.
5.3 Parsability and Usefulness
It is interesting to note that parsability and usefulness are orthogonal to one another. It is not the case that the most parsable affixes are also the most useful. The second component (the top-bottom dimension) appears to capture productivity, in the broadest sense of the term. Affixes toward the top of figure 5 are relatively robust, either because they tend to be quite parsable and a relatively high proportion of words containing them are new,
or because they are particularly useful, and so remain robust through frequency of use. What is required is both a moderate degree of parsability and at least a moderate degree of usefulness. Affixes on the bottom half of the graph have tenuous status in terms of productivity, either because they are too infrequent (bottom left), or not parsable enough (bottom right).
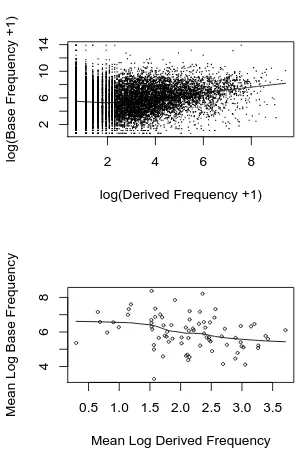
5.4 Mean Derived Frequency and Mean Base Frequency
The relationship between mean derived frequency and mean base frequency depicted in figure 5 may seem particularly counter-intuitive. The arrows associated with mean de-rived frequency and mean base frequency point in opposite directions. That is, while the two factors do pattern together, they are negatively correlated. High mean base frequency is associated with low mean derived frequency.
It has previously been demonstrated that the frequency of derived forms is positively correlated with the frequency of the bases on which they are formed (Hay 2001, Hay and Baayen 2002). This makes good intuitive sense, at least for affixes which tend to be relatively productive and/or tend to form semantically transparent words. The more useful a base form is, the more useful a form derived from that base is likely to be (relative to other derivatives from the same category). When we consider the relationship between the frequency of derived words and their bases, then, we get a positive correlation. Hay and Baayen (2002) compute this correlation separately for each affix discussed here, across individual words containing that affix. However, we have verified that it also holds when the words from all the affixes are pooled together (just under 12900 derived words). The top panel of figure 6 shows the frequency of all of these individual words plotted against the frequency of their corresponding bases. The correlation is not as robust as can be seen when we plot individual affixes separately, but it is nonetheless clearly positive – high frequency derived forms tend to also have high frequency bases.
This positive correlation between the frequency of derived words and the frequency of their bases would seem to lead to a straightforward prediction regarding the average derived form frequency of words containing a particular affix and average base frequency of those forms – they should be positively correlated.
when we take the mean frequencies for each affix represented in this data set, mean de-rived frequency and mean base frequency correlate negatively.
We expect mean base frequency to vary across affixes, because affixes combine with different subclasses of bases. Some (semantic or syntactic) classes are highly frequent (e.g. prepositions) and some are much less frequent (e.g names for countries, or medical terms). For example, the average base frequency of the suffix -ward is very high, as it takes prepositions, directions and very frequent nouns (e.g.inward, northward, homeward). Affixes like-ward appear toward the top of the lower panel of figure 6. In contrast, the average base frequency of the suffix-itisis very low, as it tends to combine with medical terms for body parts (e.g. tonsilitis, sinusitis, laryngitis). The average base frequency for
-ese and -ic are similarly low – they tend to occur with place names (cantonese, togalese, icelandic, arabic) and -ic also occurs with many low frequency technical terms (aphasic, tataric, dyslexic). These affixes occur toward the bottom of the lower panel of figure 6.
Such restrictions relating to the syntactic and semantic requirements of the affix will obviously have a strong effect on the average base frequency. And when words contain-ing these affixes are produced, the base frequency will affect the likelihood of decom-position. In particular, high frequency base words will tend to facilitate decomdecom-position. Affixes which tend to have particularly high frequency bases, then, will be particularly parsable. This should prevent semantic drift and lexicalisation, that is, it should prevent the establishment of a large number of high frequency opaque words containing that af-fix. This will keep the averagederived frequency relatively low. In addition, if an affix is more parsable it is also likely to be more productive. This will lead to a large number of coinages (i.e. very low frequency words) which will also serve to reduce the average surface frequency of the affix.
derived frequency.
6
Consonant-initial and Vowel-initial suffixes
It is interesting to note the distribution of C-initial vs V-initial suffixes in figure 5. This can be most clearly seen by reading across the four columns in table 4 from “highly parsable” through to “not parsable”. The proportion of C-initial suffixes systematically reduces from 100%to 50%, then from 23%to 5%. That is, C-initial suffixes tend to be more
parsable than V-initial affixes. Hay (2000) argues that, because consonant-initial suffixes tend to create more illegal phonotactic junctures than vowel-initial suffixes, we should expect them to be more separable and more productive. The arguments put forward by Raffelsiefen (1999) are certainly consistent with this prediction - she argues that there is an important distinction between vowel-initial and consonant-initial suffixes.
In this data-set the C-initial suffixes are in general more parsable than the V-initial suffixes. That isall of the “highly parsable, moderately useful” suffixes begin with con-sonants, whereas only 5% of the “not parsable, moderately useful” suffixes begin with
consonants. There is clearly a difference between C-initial and V-initial suffixes, and this difference is clearly probabilistic.
Plag (2002) has argued that the prediction that C-initial suffixes should be more pro-ductive than V-initial affixes does not hold up. He calculates a range of productivity measures for five initial affixes and seven V-initial affixes, and demonstrates that the C-initial affixes are, on average, no more productive than the V-C-initial affixes. He concludes that “it is clear that, contra to the prediction of complexity-based ordering[Hay 2000], C-initial suffixes cannot be said to be generally more productive than V-C-initial ones.” (Plag 2002: 299).
2
4
6
8
2
6
10
14
log(Derived Frequency +1)
log(Base Frequency +1)
0.5 1.0 1.5 2.0 2.5 3.0 3.5
468
Mean Log Derived Frequency
Mean Log Base Frequency
the only thing which facilitates parsability - relative lexical frequency, for example, is also involved. And “usefulness” plays an important additional role in the determination of productivity, such that, while -most might be more “parsable” than -y, -y is more “use-ful” than-most. Phonotactics alone cannot completely predict parsability, and parsability alone cannot predict productivity.
A categorical distinction between C-initial and V-initial suffixes (such as proposed by Raffelsiefen) will capture a good amount of variance that we, with more probabilistic measures, can also capture. However our approach can also capture the gradient nature of this effect. In the approach advocated here, troublesome exceptions (such as those raised by Plag (2002)) do not falsify the theory, because the theory is intrinsically proba-bilistic.
7
Conclusion
We set out to demonstrate that there is a link between the phonotactics an affix tends to create, and aspects of that affix’s behaviour. Namely, we predicted that affixes which tended to create phonotactic junctures which facilitated parsing, would be more prone to decomposition in speech perception, and so therefore show more productivity. We found this to be true. We also found a remarkable degree of interrelatedness between various as-pects of an affix’s behaviour. These factors work together on two separate dimensions. On the one hand, factors relating to decomposition and parsing cluster together with the rate at which new words are formed with that affix. On the other hand, factors relating to affix generalisability and usefulness cluster together with the likelihood that new coinages will contain that affix. Junctural phonotactics is related to both of these dimensions.
In addition, the set of correlations we have uncovered provide strong evidence for the robustness of the system as a whole. Readers may have qualms about the validity of the
P measure, about the reality of parsing ratios, or the true relevance of phonotactics.
mutually reinforcing one another’s effects.
References:
Allen, J. and Christiansen, M. (1996). Integrating multiple cues in word segmentation: A connectionist model using hints. InProceedings of the 18th annual Cognitive Science Society conference, pages 370–375, Mahwah, NJ. Lawrence Erlbaum Associates Inc.
Aronoff, M. (1976)Word-formation in generative grammar. MIT Press, Cambridge, MA.
Aronoff, M. (1980) The relevance of productivity in a synchronic description of word formation. In Fisiak, J., editor,Historical Morphology. Mouton, The Hague.
Baayen, R. H. (1989)A corpus-based approach to morphological productivity: Statistical analysis and psycholinguistic interpretation, PhD thesis, Vrije Universiteit, Amsterdam.
Baayen, R. H. (1992) Quantitative aspects of morphological productivity. in G.E. Booij and J. v. Marle (eds),Yearbook of Morphology 1991, Kluwer Academic Publishers, Dordrecht, pp. 109-150.
Baayen, R. H. (1994) Productivity in language production. Language and Cognitive Pro-cesses9, pp 447-469.
Baayen, R. H. (2002) Word Frequency Distributions. Kluwer Academic Publishers.
Baayen, R. H. and R. Lieber (1991). Productivity and English Derivation: A Corpus Based Study. Linguistics, 29:801–843.
Baayen, R. H. and Renouf, A. (1996). Chronicling the Times: productive innovations in an English newspaper. Language, 72(1):69–96.
Baayen, R. H. and Schreuder, R. (2000). Towards a psycholinguistic computational model for morphological parsing,Philosophical Transactions of the Royal Society (Series A): Mathe-matical, Physical and Engineering Sciences358, 1-13.
Bauer, L. (2001)Morphological Productivity. Cambridge University Press, Cambridge.
Brent, M. R. and Cartwright, T. A. (1996). Distributional regularity and phonotactic con-straints are useful for segmentation. Cognition, 61:93–125.
Cleveland, W. S. (1979) Robust locally weighted regression and smoothing scatterplots.
Journal of the American Statistical Association74, 829-36.
Christiansen, M. H., Allen, J. and Seidenberg, M. S. (1998). Learning to segment speech using multiple cues: A connectionist model. Language and Cognitive Processes, 13:221–268.
Cutler, A. and Norris, D. (1988). The role of strong syllables in segmentation for lexical access. Journal of Experimental Psychology: Human Perception and Performance, 14:113–121.
Dahan, D. and Brent, M. R. (1999). On the discovery of novel word-like units from ut-terances: An artificial-language study with implications for native-language acquisition.
Journal of Experimental Psychology: General. 128 (2), pp 165-185.
Elman, J. L. (1990). Finding structure in time. Cognitive Science, 14:179–211.
Gleitman, L.R., Gleitman, H., Landau, B. and Wanner, E. (1988). Where learning begins: Initial representations for language learning. In Newmeyer, F., editor, Linguistics: The
Cambridge Survey, volume 3, pages 150–193. Cambridge University Press, Cambridge,
U.K.
Hay, J. (2000)Causes and Consequences of Word Structure. Ph.D. Dissertation. Northwestern University.
Hay, J. (2001) Lexical Frequency in Morphology: Is Everything Relative? Linguistics 39 (6), pp 1041-1070.
Hay, J. (2002) From Speech Perception to Morphology: Affix-ordering revisited. Language 78 (3), pp 527-555.
Hay, J. and Baayen, R. H. (2002) Parsing and Productivity. In Booij, G. E. and J. v. Marle (eds)Yearbook of Morphology 2001, Kluwer Academic Publishers, Dordrecht. pp 203-235.
Hay, J., J. Pierrehumbert and M. Beckman (in press). Speech Perception, Well-formedness and the Statisitics of the Lexicon. To appear in Papers in Laboratory Phonology VI. Cam-bridge University Press, CamCam-bridge.
Jusczyk, P.W., Cutler, A. and Redanz, N. (1993). Preference for the predominant stress patterns of English words. Child Development, 64:675–687.
Kiparsky, P. (1982). Lexical Morphology and Phonology. In I.S.Yang, editor,Linguistics in the Morniing Calm. Hanshin, Seoul.
McQueen, J. M. (1998). Segmentation of Continuous Speech using Phonotactics. Journal of Memory and Language, 39:21–46.
Mohanen, K. (1986). The Theory of Lexical Phonology. D.Reidel Publishing Company, Dordrecht, Holland.
Plag, I, C. Dalton-Puffer, and H. Baayen (1999) Morphological productivity across speech and writing. English Language and Linguistics3, 209-228.
Plag, I. (2002) The role of selectional restrictions, phonotactics and parsing in constraining affix-ordering in English. In Booij, G. E. and J. v. Marle (eds)Yearbook of Morphology 2001, Kluwer Academic Publishers, Dordrecht. pp 285-314.
Raffelsiefen, R. (1999). Phonological constraints on English word formation. In Booij, G. and van Marle, J. (eds). Yearbook of Morphology 1998, pages 225-287. Kluwer Academic Publishers, Dordrecht.
Renouf, A. (1987) Corpus Development. In J. Sinclair (ed.) Looking up: An account of the COBUILD Project in lexical computing and the development of the Collins COBUILD English
Language Dictionary, Collins, pp. 1-40.
Saffran, J.R., E.L. Newport and R.N. Aslin (1996a) Statistical learning by 8-month old infants. Science274, 1926-1928.
Saffran, J.R., E.L. Newport and R.N. Aslin (1996b) Word segmentation: The role of distri-butional cues. Journal of Memory and Language35, 606-621.
Shannon, C. E. and Weaver, W. (1949). The Mathematical Theory of Communication. Univer-sity of Illinois Press, Urbana.
Selkirk, E. O. (1982). The syntax of words. Number 7 in Linguistic Inquiry Monograph Series. MIT Press, Cambridge, Mass.
Siegel, D. (1974). Topics in English Morphology. Garland, New York.
(Jennifer Hay)
Department of Linguistics
University of Canterbury
Private Bag 4800
Christchurch
New Zealand
email: [email protected]
(Harald Baayen)
Max-Planck-Institut f ¨ur Psycholinguistik
Wundtlaan 1
6525 XD Nijmegen
The Netherlands