Image-based Analysis for Characterization of
Chicken Nugget Quality
Chumpol Yuangyai1*, Piyaphorn Matvises1, Udom Janjarassuk1
Abstract: Appearance, colors and adhesion characteristics of chicken nugget are important to customer satisfaction and buying decision. These characteristics are generally inspected by hu-man, thus, the inspectors might incorrectly judge. In addition, the results are not quantitatively recorded for further analysis and improvement. Therefore, this study focuses on constructing a measurement instrument for detecting the qualities of chicken nugget, then gage repeatability and reproducibility (GR&R) study is used to ensure that the instrument is capable of dis-tinguishing nugget differences. Since, there are eleven characteristics of chicken nugget are analyzed. The principal component analysis is applied to reduce the number of characteristics from eleven dimensions to only four dimensions. The experiments and data analysis show that the dimension reduction is useful to rapidly detect the abnormality of nuggets and finally help practitioners to improve the process.
Keywords: Chicken nugget quality, Gage repeatability and reproducibility, Image-based analysis, Principal component analysis.
Introduction
Food appearance is one of the most important characteristics of customers buying decision. The need for fast and accurate food inspection is crucial. In this paper, a chicken nugget product is selected as a case study. Chicken nugget production is a semi-frozen food process which includes grinding chicken meat, pressing into bars or desired shapes, coating and deep frying in a short period in order to be stabilized and semi-cooked, then freezing and packing for sale to consumers. Then, consumers will rapidly cook before eating.
The characteristics of chicken nuggets not only affect the customer’s buying decision and satisfaction, but also are product indicators for process improvement. However, the current inspections are performed by human. The inspection is considered as a tedious, laborious, costly, time-consuming and inconsistent task. Researchers have used image processing in food quality inspection to alleviate these problems (Du and Sun, [6]; Brosnan and Sun, [5]). Therefore, there is a need of automate instrument associated imagement processing for collecting data and the data will be used for further analysis and process improvement. In our study, we built a prototype of measurement device using image processing and analysis to characterize the nuggets quality.
1, Faculty of Engineering, Department of Industrial Engineering,
King Mongkut’s Institute of Technology, Chalongkrung Road, Ladkrabang, Bangkok 10520, Thailand.
Email: [email protected], piyaphorn.mat@hotmail. com, [email protected]
*Corresponding author
However, the device is not fully automated, images are taken manually. Since images provide several characteristics simultaneously, it is difficult to ana-lyze these data; principal component analysis (PCA) is used to determine the relationship between varia-bles and to reduce the number of variavaria-bles by bining the variables within the same factors or com-ponents and introduce new variables that are useful for further analysis.
The objective of this study is to propose image processing and statistical techniques: Gage repeat-ability and reproducibility (GR&R), Design of experi-ment and PCA for the analysis and the evaluation of chicken nugget quality. We use image processing-based techniques to collect eleven characteristics of chicken nugget which include chicken meat colors, flour colors, porosity colors, and section areas. Then GR&R is used to ensure that the instrument is capable of distinguishing nugget differences by using only represented colors characteristics in L*a*b* system.
The organization of the paper is begun with method and related topics. Then results and discussion is presented, followed by conclusion at the end.
Methods
In this section, we introduce image processing and analysis, design of experiments, GR&R, PCA, and a proposed framework as follows:
Image Processing and Analysis
Sun, [5]) for a wide range of products including meat (Barni, et al., [3]; Borggaard, et al., [4]; Fortin et al., [7]), fruits (Li et al. [10]), and fish (Karplus, et al., [9]). Image processing analysis generally consists of 5 steps: (1) image acquisition; (2) pre-processing; (3) image segmentation; (4) object measurement and (5) classification.
For chicken nugget inspection, the image processing is implemented to measure the color of chicken meat and battered flour, flour porosity, section-area. The algorithms for color analysis and section-area proces-sing and porosity analysis are coded uproces-sing MATLAB.
Color Measurement
We measure the color in the L*a*b* system which is an international standard for color measurements, and adopted by the Commission Internationaled’ Éclairage (CIE) in 1976. This color model creates a consistent color regardless of devices used to gene-rate the image (e.g., monitor, printer or scanner). L* is the luminance or lightness component, which ranges from 0 to 100, and a* (from green to red) and b* (from blue to yellow) are the two chromatic com-ponents, which range from –128 to +127 (256 levels) (Baldevbhai and Anand, [2]).
Section-area and Porosity Measurement
Section-area (the whole cross-section area of nugget) and porosity are indicated by differences of two colors (black and gray) using threshold-based method. This technique is particularly effective for scenes containing solid objects resting upon a con-trasting background, which distinguishes the object from the remaining part of the image with an optimal value. (Du and Sun, [6])
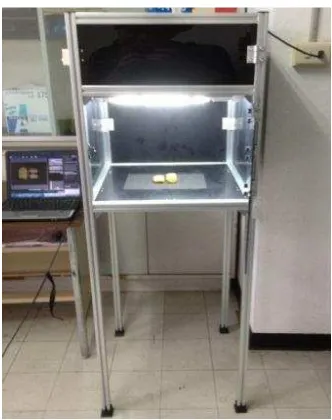
Figure 1 is the inspection equipment. The chamber itself consists of three following main elements (Image processing is based on Pedreschi et al. [12] and Yuangyai et al. []): (1) Four florescence lamps are attached at square 30 cm. above the sample and set at an angle of 45º to nugget location. (2) A Canon EOS 550D camera is located vertically above the sample. The angle between the camera lens axis and the lighting sources is at 45º, the image format is JPEG with resolution 3456 × 2304 and connected to a computer with the USB port. (3) Illuminators and the CDC place inside a mat acrylic box to prevent light and reflection from outside sources, the box size is 50 × 50 × 50 cm. The frame is made of aluminum and is located above the ground 100 cm.
Design of Experimental to Reduce the Measu-rement Variability
Design of experiments (DOE) is the process of planning an experiment to obtain the information concerning factors affecting to experiment responses (Montgomery, D.C. and Runger, G.C., [11]). This
study uses a fractional factorial design for six factors ( to reduce measurement error from possible factors. Then we select only ones providing high contributions to response variability. We use a simulated color paper with ten chicken nuggets-like colors (Figure 2) for the experiments. MINITAB is used for the analysis.
Gage Repeatability and Reproducibility Study
Gage repeatability and reproducibility (GR&R) is a statistical technique used to assess the measurement system whether or not it is capable of distinguishing part differences. In this study, we use a color paper with ten chicken-nugget-like colors as samples (shown in Figure 2) and the factors that no effect on the measurement system. They are analyzed with full factorial design. The computations were carried out by using a balanced ANOVA module in MINITAB.
In the simple statistical model of GR&R, supposed that there are a randomly selected parts and b randomly selected operators in which each operator measures every part n times. The measurement results are represented by where i = 1, 2, …, a, j = 1, 2, …, b, and k = 1, 2, …, n. The effect model is described as
(1)
where , , and are all independent random variables that represent the effect of parts, operators, the interaction of part and operator, and random error, respectively and is the overall mean.
Figure 1. Image processing equipment for nugget inspection
Principal Component Analysis
Principal component analysis (PCA) is a variable reduction procedure. It is useful when there is a large number of data sets on a number of variables and it is believed that some redundancy exists in the data sets. In this study, redundancy means that some of the variables are correlated with one another, possibly because they are measuring similar structure. PCA consists of four main steps: study of correlation among the variables, initial extraction of the components, rotation to a final solution, and interpretation of the rotated solution (Jonhson and Wichern, [8]). The new factors obtained from the analysis, are then called principal components.
Results and Discussion
In this section, we present results and discussion of DOE, GR&R, nugget measurement, and PCA as the following.
Design of Experiments to Reduce the Measu-rement Variability
Once the equipment is completely built, we considered six factors in the measurement system: (A) background color, (B) operator, (C) position (ob-ject), (D) number of lamps, (E) outside light, (F) dis-tance (between camera and object). Fractional facto-rial design ( ) was used to screen out these factors. Then images are converted to L, a*, b* va-lues. The experimental results indicate factors that are 5% significance level using general linear model in MINITAB.
Table1, Table 2 and Table 3 display the analysis of variance for L*, a*, and b*, respectively. The results indicate that four factors except operator and outside light are significant at 5% significance level. There-fore, we choose background (B) as black, position (C) as central, number of lamps (D) as two and distances (F) is 22.5 cm. The camera setting is set to manual mode with ISO400, shutter speed 1/60, aperture 5.6, no zoom and no flash, to reduce the variability.
Gage Repeatability and Reproducibility Study
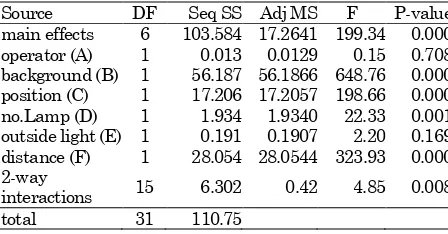
Once the variability of the measurement system is reduced, the different colored papers are measured by two operators with two methods (with or without outside light). Then images are converted to L, a*, b* values for GR&R using ANOVA with MINITAB 16. Due to the space limitation, an example of L* value analysis is shown in Table 4. Based on the p-values, it can be concluded that the effect of parts, operators and outside light, and their interaction effects are significant.
Table 1. Analysis of variance for L*
Source DF Seq SS Adj MS F P-value
Table 2. Analysis of variance for a*
Source DF Seq SS Adj MS F P-value
Table 3. Analysis of variance for b*
Source DF Seq SS Adj MS F P-value
where is the random experimental error, is the variance component for parts, is the variance component for operators and is the variance component of outside light.
Table 5. Comparison variances of the L * a* and b* values
To analyze the characteristics of chicken nugget, 80 chicken nuggets are randomly selected from a local market.
Color Inspection
The background was removed from the digital image as shown in Figure 3. Then selection-area of chicken meat, batter and porosity of an example to present the neighbors or similar pixel are shown in Figure 4.
The images are analyzed in the L*a*b* system for the color of chicken meat, batter, and porosity.
Figure 3. Removing image background
Section-Area and Porosity Inspection
Image background was removed from the pre-processed gray scale image using a threshold of 0.6 to determine porosity and combined with an edge detection technique based on the Laplacian-of Gauss (LoG) operator to determine section-area, shown in Figure 5. Therefore, there are totally 11 characte-ristics of chicken nugget are analyzed.
Figure 4. Color-based image segmentation
Figure 5. Image segmentation with threshold and edge detection technique
Table 4. Analysis of variance for L*
ANOVA: L versus Part, Operator, Outside light Factor Analysis of Variance for L*
Principal Component Analysis
There are 11 characteristics of chicken nugget characterized by our measurement instrument. These characteristics are as follows: The colors of chicken meat representations which are 1L*, 1a* and 1b*. The colors of batter representation are 2L*, 2a* and 2b* and the colors of porosity representation are 3L*, 3a* and 3b*. Section-area is represented by the area. Porosity is represented by pore. Then they are analyzed using principal component analysis to reduce the number of characteristics.
Table 6 shows the correlation matrix between varia-bles which is used to indicate the grouping variable. Eigenvalue of each principal component (PC) is con-sidered and shown in Table 7. Four main Eigen-values (PC1 to PC4) are considered because they have accounted for 69.4% or it can explain the total variation of the 11 variables for 69.4%. The PC1, PC2, PC3, and PC4 are composed of original variables and they are shown in Eq. 2 to Eq 5. These equations are the relationship in the linear form of variables in each principal component.
PC1 = (-0.227)2L* + (0.437)2a* + (0.423)2b* (2) PC2 = (0.460)3L*+(-0.201)3a*+(0.443)3b* (3)
PC3 = (-0.468)1L* + (0.462)1a* (4) PC4 = (-0.447)1b* + (0.315)2L* + (-0.392) area +
(0.375) pore (5)
It is important when interpreting the underlying relationships of the variables in each component. We interpret each PC as follows: (a) The PC1 is asso-ciated with the color of the batter, thus PC1 is named “the component of batter quality”. (b) The PC2 is associated with the color of the porosity, thus PC2 is named “the component of depth-porosity quality”.
(c) The PC3 is associated with the color of the chicken meat, thus PC3 is named “the component of
chicken meat quality”, and (d) The PC4 consists of a
variety of variables that is related to the overall appearance of chicken nuggets are associated, thus PC4 is named “the component of appearance quality”.
Conclusion
In this study, we proposed a framework for using image processing for characterization of chicken nug-get quality. Design of experiment is used to consider the factor associated with the system in order to reduce the measurement variability. Then gage repeatability and reproducibility is used to assess the measurement system variation of the color-based image processing equipment. Since there are 11 characteristics of chicken nugget are analyzed with image processing which include chicken meat color, battered flour color, section-area, and porosity. The principal component analysis is applied to reduce the number of characteristics from eleven to only four characteristics are followed PC1 for the component of batterquality, PC2 for the component of depth-porosity quality, PC3 for the component of chicken meat quality and PC4 for the component of appearance quality.
Acknowledgement
This research is financially supported by the Faculty of Engineering, King Mungkut’s Institute of Techno-logy Ladkrabang. In addition, this paper was presen-ted at LSCM2013, Bali 26-28 June 2013 and is selected for further review for the journal public-cation.
Table 6. Correlation matrix of 11 characteristics
variable 1L* 1a* 1b* 2L* 2a* 2b* 3L* 3a* 3b* area pore
1L* 1
1a* -0.813 1
1b* -0.507 0.040 1
2L* -0.85 0.166 -0.207 1
2a* 0.159 -0.217 0.107 -0.637 1
2b* 0.080 -0.106 0.074 -0.180 0.694 1
3L* 0.243 -0.242 -0.134 -0.125 0.058 -0.017 1
3a* 0.114 -0.023 -0.105 0.233 0.013 0.094 -0.136 1
3b* 0.277 -0.246 -0.159 -0.040 0.107 0.075 0.868 0.012 1
Area 0.046 -0.061 0.199 -0.190 0.196 0.001 -0.127 0.137 -0.169 1 pore 0.183 -0.057 -0.226 -0.031 0.286 0.183 -0.096 0.055 -0.114 -0.036 1
Table 7. Results of principal component analysis
PC1 PC2 PC3 PC4 PC5 PC6 PC7 PC8 PC9 PC10 PC11 Eigenvalue 2.6483 2.1194 1.6305 1.2405 1.0842 0.8089 0.636 0.5501 0.1351 0.1011 0.0459
References
1. AIAG, Automative Industry Action Group, Mea-surement System Analysis (MSA), 3rd edition, Michigan, 2002.
2. Baldevbhai, P. J. and Anand, R. S., Color Image Segmentation for Medical Images using L*a*b* Color Space, Journal of Electronics and Commu-nication Engineering, 1(2), 2012, pp. 24-45. 3. Barni, M., Cappellini, V., and Mecocci, A.,
Colour-based Detection of Defects on Chicken Meat, Image and Vision Computing, 15, 1997, pp. 549–556.
4. Borggaard, C., Madsen, N.T. and Thodberg, H.H., In-line Image Analysis in the Slaughter Industry, Illustrated by Beef Carcass Classifica-tion, Meat Science, 43(1), 1996, pp. 151-163. 5. Brosnan, T. and Sun, D.W., Improving Quality
Inspection of Food Products by Computer Vision-a Review. Journal of Food Engineering, 61(1), 2004, pp. 3-16.
6. Du, C.J and Sun, D.W., Recent Developments in the Applications of Image Processing Techni-ques for Food Quality Evaluation, Trends in Food Science & Technology, 15, 2004, pp. 230– 249.
7. Fortin, A., Tong, A. K. W., Robertson, W. M., Zawadski, S. M., Landry, S. J., Robinson, D. J.,
Liu, T., and Mockford, R. J., A Novel Approach to Grading Pork Carcasses: Computer Vision and Ultrasound. Meat Science, 63, 2003, pp. 451–462.
8. Johnson, A. and Wichern D. W., Applied Mult-ivariate Statistical Analysis, 6th, Pearson, 2007.
9. Karplus, I., Alchanatis, V., Zion, B., Guidance of Groups of Guppies (Poeciliareticulata) to Allow Sorting by Computer Vision, Aquacultural Engineering, 32(3–4), 2005, pp. 509-520. 10. Li, Q. Z., Wang, M. H., and Gu, W. K., Computer
Vision Based System for Apple Surface Defect Detection, Computers and Electronics in Agri-culture, 36 (2–3), 2002, pp. 215–223.
11. Montgomery, D.C. and Runger, G.C., Applied Statistics and Probability for Engineers, 4th, New
York: John Wiley and Sons, 2007.
12. Pedreschi, F., LeÓn, J., Mery, D. and Moyano, P., Development of a Computer Vision System to Measure the Color of Potato Chips, Food Research International, 39(10), 2006, pp. 1092– 1098.