60
PERFORMANCE EVALUATION AND RISK AVERSION RATE FOR
SEVERAL STOCK INDICES IN INDONESIA STOCK EXCHANGE
Robiyanto
Faculty of Economics and Business, Satya Wacana Christian University, Salatiga, Indonesia Email: [email protected]
Abstract
There are numerous stock indices in Indonesia Stock Exchange. Several of them are LQ-45, MBX, DBX, JII, SRI-KEHATI, PEFINDO-25, BISNIS-27, IDX-30 and KOMPAS-100. Unfortunately there are limited researches which have been done to measure those indices performance specifically. The same condition also occurs on risk aversion level usage in Indonesia Stock Exchange, only few numbers of researches use this measurement in the portfolio valuation. Based on that, this research measured the performance and risk aversion rate of those indices in Indonesia Stock Exchange. The results of this study were SRI-KEHATI becomes the best performer with the highest risk aversion rate, while Jakarta Islamic Index (JII) produces the lowest positive performance with the lowest risk aversion rate. This finding shows that sharia stocks’ characters (i.e. usury free) could give relieveness and convenience regardless its per -formance.
Keywords: Portfolio performance evaluation; sharpe ratio; treynor ratio; risk aversion rate.
Introduction
The capital market has had a strategic role for companies (enterprises) in Indonesia, both private companies and State-Owned Enterprises (SOEs). For these companies, the stock market can become an al-ternative source of funding to finance their activities. Meanwhile, for people with some excess of funds and are interested in investing them, the capital market institution in Indonesia (here is the Indonesia Stock Exchange) has added a row of alternatives for inves-tors in investing their funds.
Several types of securities are traded in the capital market and one of which is stock or shares that proves an ownership of a company. Compared to savings or deposits, shares of public companies are classified into high risk investment instruments for their sensitiveness to the changes occur influenced by either external or domestic issues such as changes in the political, economic, monetary, laws or regulations or changes in the industry and the company that issue shares (issuers) itself.
Uncertainties occur in the stock investment has been widely acknowledged by many. These uncerta-inties arise because of variabilities. These variabilities have also caused stock return in different periods contains volatility and is difficult to predict (Panait & Slavescu, 2012). Husnan (2005) argues that risk of stock investment can be divided into two, systematic and unsystematic risks. In line with it, Arfinto (2006) suggests that unsystematic risk is a risk that can be diversified, while the systematic risk is the risk that
cannot be diversified. Risk of stock that can be diversified is usually associated with specific factors of a company as the issuer of the stock. This risk can be minimalized by conducting diversification through the establishment of stock portfolio. Conversely, stock that cannot be diversified is related to factors that can affect all shares listed on a capital market. This risk is often also referred to market risk.
How to minimalize the unsystematic risk is by conducting diversification through the establishment of portfolio. The portfolio is able to eliminate the risk if the stock returns have no correlation (Markowitz, 1952). If the correlation among stock returns is perfect, then the returns of all the stock will move in tandem as a perfect unity and the establishment of the portfolio will not be able to eliminate the risk. Thus, to reduce the risk, the establishment of portfolio con-sisting of effects with high correlation among one and another must be evaded.
board; Kompas introduces Kompas-100 Index which is established from 100 stocks selected with certain criteria; Institution of Biodiversity Foundation which comes up with SRI-Kehati Index (Sustainable Res-ponsible Investment) which covers 25 stocks con-sidered to meet the criteria of environmental responsi-bility along with some other criteria; PEFINDO-25 Index which is established by PEFINDO; and also Bisnis 27 Index introduced by Harian Bisnis Indone-sia. These stock price indices are expected to become references in establishing a portfolio. These stock price indices can be viewed as portfolio return of shares that are included in those stock price indices.
Although all the stock price indices mentioned previously have been long enough in Indonesia Ca-pital Market, a study which specifically analyzes the performance of those stock price indices as a stock portfolio is still difficult to find. Hence, this study will conduct a study on the performance of those stock indices. In addition to the commonly used portfolio performance measurements such as Sharpe Ratio and Treynor Ratio, this study will also employ a still rarely used measurement which is risk aversion rate measured by conditional variance. The score of conditional variance representing risk aversion rate is derived from coefficient of GARCH-M portofolio (Nyberg, 2010).
The Risk aversion rate measures attitudes and behaviors of investors in making investment choices with the expected return rate. Each investor will tend to expect that their investment to give maximum profit by minimalizing potential risks appear. The higher level of this risk aversion will indicate that in-vestors will tend to view a portfolio as relatively risky. Unlike with standard deviation or variance which is relatively static, this risk aversion rate is measured by using a dynamic approach.
Modern Portfolio Theory
Stock diversification often refers to the Modern Portfolio Theory proposed by Markowitz (1952) and revised again by Markowitz (1959).
Markowitz (1959) outlines the purposes of portfolio analysis as follows:
1. Investors always expect to get high return. The definition of this high return fully depends on the
investors’ subjectivity that are relative for one investor to the other. Basically, investors wish for more results.
2. Investors expect reliable return, stable, and uncertainty free. No doubt that there are buyers of securities who prefer for uncertainties like a gam-bler on a horse racing that pays for an opportunity.
Techniques in the work of Markowitz (1959) is not intended for those types of people. The techniques are intended for investors who choose certainty rather than the opposite and other things are deemed to be equal.
A portfolio that generates the highest return is not necessarily the one with the lowest uncertainties (risks). In reality, a reliable portfolio with high return rate can be unacceptable for it has high uncertainties (risks). On the contrary, a portfolio with the lowest uncertainties rate (risks) may have the lowest return rate as well.
Portfolio analysis is begun with information related to the stocks individually and then ended with conclusions related to the portfolio in overall. The sources of information which can be used for this portfolio analysis include past performance of a stock individually and the other source is the availability of stock analysis with positive outlook on the future performance of a stock. When the past performance of a company’s stock is used as an input, the output of this analysis is the portfolio has performed well in the past. When the trust of stock analysts is used as an input, the analysis output is the implications of stock analysis beliefs for the portfolio better and poorer.
Portfolio Performance Measurement
There are various tools for measuring the port-folio performance. These tools of portport-folio perfor-mance measurement assist investors in evaluating their portfolio performance. A commonly tool of portfolio performance measurement used and has become a standard for industry is Sharpe Ratio which is introduced by Sharpe (1966). Bednarek, Patel, and Ramezani (2014) and Low and Chin (2013) suggest that Sharpe Ratio is a measurement tool that has been widely recognized by academicians and practitioners in the measurement of portfolio for its simplicity. Besides Sharpe Ratio, Treynor Ratio is another tool that is often employed by investors. Sharpe Ratio and Treynor Ratio can implement to rank the performance of portfolio and to test if a portfolio is well diversified. (Scholz & Wilkens, 2006).
Treynor Ratio
determine their investment policy. This method also refers to the notion that there is more than one risk in a diversified portfolio, a risk created by market fluctua-tions and a special risk inherent in a certain security. Both bring consequences that the return rate of in-vestment usually also depend on the market condition in general and the average measurement of return does not prevent investors from risks. Under these conditions, Treynor (1965) formulates a relative mea-surement that considers the stock volatility rate. This method is well known as Treynor Ratio with the for-mula (Treynor, 1965):
Treynor Ratio =
Portfolio Beta
Rate Interest RiskFree Average
Return
Portfolio
Sharpe Ratio
Besides Treynor Ratio, portfolio performance can also be measured with Sharpe Ratio as formulated by Sharpe (1966). Sharpe Ratio is a method that has been widely accepted and implemented by both aca-demicians and practitioners in finance to measure the performance of a portfolio (Low & Chin, 2013). Sharpe (1966) formulated Sharpe Ratio based on the framework of modern portfolio theory developed by Markowitz (1959). The Sharpe Ratio/Reward to Variability is as follows:
Reward to Variability Ratio (RVAR) =
Portfolio of
Deviation Standard
Average Return
Portfolio
Risk Aversion Rate
Every investor in the capital market naturally has an expectation that their investment can give maxi-mum benefit by minimalizing the potential risks arise. There are several attitudes of investors towards the potential risks, they are risk seeker, risk neutral and risk averter. From those three types of investors, those who prefer to avoid the risks (risk averter) are inves-tors with natural human attitude.
Meanwhile, the risk aversion level can be measured quantitatively with GARCH-M method. Nyberg (2010) suggests that the main idea of GARCH-M model is that the coefficient of conditio-nal variance in conditioconditio-nal mean equation can be used to measure the risk aversion rate. The implementation of GARCH-M model in measuring risk aversion rate
has also been done by Alfi and Mishra (2014) in the capital market of Saudi Arabia.
Research Method
Data
Data used in this study were secondary data in the form of daily closing of stock price indices for CPSI, LQ-45, MBX, DBX, JII, SRI-KEHATI, PEFINDO-25, BISNIS-27, IDX-30 and KOMPAS-100 during 3 January 2013 to 11 April 2016 period (797 days of observation) which were obtained via www.google.com/finance. Data of SBI interest rate was gathered from Indonesia Economy and Finance Statistics (Statistik Ekonomi dan Keuangan Indo-nesia) issued by Bank Indonesia.
Variable Operational Definitions and Analysis Techniques
Here are the variable operational definitions used. 1. Portfolio Return is the results obtained investment
in a portfolio, in the form of appreciation / depreci-ation of set of assets that fits into the portfolio in one day of observation compared to one precee-ded observation. Portfolio Return is calculated with the following formula:
Portfolio Return = (Portfolio score periodt– Port-folio score period-1)/ PortPort-folio score in period-1. In this study, the score of the portfolio was represented by assessed equity indices as LQ-45, MBX, DBX, JII, SRI-KEHATI, PEFINDO-25, BISNIS-27, IDX-30 and KOMPAS-100. 2. Stock market Return is market profit rate
calcu-lated with the following formula:
Stock Market Return = (Stock Price Index periodt–Stock Price Index period-1)/Stock Price Index periodt-1. Here, the stock market return was represented by Composite Stock Price Index (CSPI) return.
3. A beta share is popular size in measuring the level of risk of a stock in its relation to the stock market itself. Beta also shows the sensitivity of stock return to the changes in market return. Beta shares are acquired through the regression between market return on stock return, the regression coefficient of the market return that is often referred to as beta shares.
5. GARCH-M analysis was employed to figure out conditional variance used as a measure of risk aversion level as proposed Nyberg (2010). The GARCH-M model used here is as follows: Returnt = α+ βReturnt-1 + λσ2t + εt
And εt is independent and distributed identically N (0.1) and independent to the past condition ηt-p. Returnt = Portfolio return period t.
6. Measurement of risk adjusted return for portfolio performance formed was carried out with Sharpe Ratio (Sharpe, 1966):
and Treynor Ratio (Treynor, 1965):
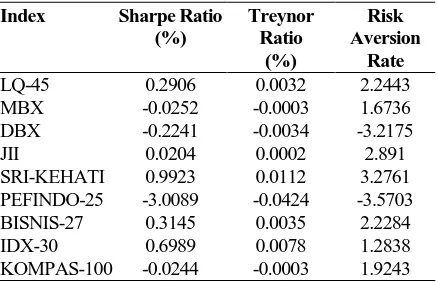
Treynor Ratio = surement of index measurement (representing stock portfolio) was done with Sharpe Ratio and Treynor Ratio and Risk Aversion Rate as can be seen in Table 1.The higher Sharpe Ratio will lead to the increase of its reward to variability or the return rate which is adjusted with the variability. Whereas the high Treynor Ratio will result in the high reward to vo-latility or return which is adjusted with the vovo-latility, Table 1 has illustrated that SRI-KEHATI index has generated the highest Sharpe Ratio with 0.9923% and is followed by IDX-30 (0.6989%), BISNIS-27 (0.3145%), LQ45 (0.2906%), JII (0.0204%), KOMPAS-100 (-0.0244%), MBX (-0.0252%), DBX (-0.2241%) and PEFINDO-25 (-3.0089%). It sug-gests that the portfolio made up of SRI-KEHATI shares is the best-performing index seen from Sharpe Ratio or is able to produce return that tailored with the best variability.
The similar result was also found when doing the rating based on Treynor Ratio. SRI-KEHATI index is the one with the highest Treynor Ratio score with 0.0112% and is followed by IDX-30 (0.0 078%), BISNIS-27 (0.0035%), LQ-45 (0.0002%), JII (0.0002%), KOMPAS-100 (-0.0003%), MBX (-0.0 003%), DBX 0.0034%) and PEFINDO-25 (-0.0424%). By employing Treynor Ratio, it is found
that portfolio formed from SRI-KEHATI shares is the portfolio that is capable in generating the best return adjusted volatility among all portfolios under this study. Conversely, KOMPAS-100, MBX, and PE-FINDO-25 are indexed with the worst performance seen from their scores of Treynor Ratio and Sharpe Ratio. These indexes produce Treynor Ratio and Sharpe Ratio scores with negative mark. It may occur due to the returns of these indexes are smaller when compared to the risk-free rate.
Table 1
Sharpe Ratio, Treynor Ratio and Risk Aversion Rate Index Sharpe Ratio
SRI-KEHATI 0.9923 0.0112 3.2761 PEFINDO-25 -3.0089 -0.0424 -3.5703 BISNIS-27 0.3145 0.0035 2.2284 IDX-30 0.6989 0.0078 1.2838 KOMPAS-100 -0.0244 -0.0003 1.9243 Source: www.google.com/finance and Indonesia Economy and Finance Statistics (Statistik Ekonomi dan Keuangan Indonesia), processed.
Based on risk aversion rate, it can be seen that some indexes have negative risk aversion rate, they are DBX with risk aversion rate at -32.175 and PEFINDO-25 with -35.703. Risk aversion rate with negative mark on a stock or portfolio indicates the absence of tradeoff between the risk and return of a stock or portfolio formed. In other words, the higher risk of a stock or portfolio will lead to the lower rate of return and vice versa. Unfortunately, these indexes show Treynor Ratio and Sharpe Ratio with negative score. The combination of these scores indicates that these indexes a have high-risk level with low return. A rational investor will tend to evade from it.
cautious in investing in stocks listed in SRI-KEHATI index. The score of risk aversion rate with the lowest positive mark was found in JII (Jakarta Islamic In-dex). Although the scores of Treynor Ratio and Sharpe Ratio of JII is the lowest positive mark, investors feel more comfortable in doing investments on stocks listed in JII than to stock indices with better performance. It may happen for the stocks listed in JII calculation are sharia shares which are rigorously selected and do not any element of usury. The stocks which are included in this calculation of JII have firstly listed in List of Islamic Securities (DES/Daftar Efek Syariah) before are rechecked based on their bu-siness performance.
Conclusion and Implication
SRI-KEHATI is the best performer index compared to other indexes analyzed in this study by using either Sharpe Ratio or Treynor Ratio, while the worst performing index based on Sharpe Ratio and Treynor Ratio go to PEFINDO-25 index. Although having the best performance, SRI-KEHATI index has risk aversion rate with the highest positive mark which indicates that investors ten to be cautious in do-ing investment on stock listed in the calculation of SRI-KEHATI index. In general, high-risk high return concept can be applied for this SRI-KEHATI index as like the other indices such as IDX-30, BISNIS-27, LQ-45 and JII. On the contrary, KOMPAS-100, MBX, DBX and PEFINDO-25 indices show the worst performance and own risk aversion rate with negative mark indicating for high-risk low return.
Investors can invest in stocks included in the calculation SRI-KEHATI index for it generates return adjusted variability and the highest volatility. In addition, stocks which are classified into this index have also gone through rigorous selection from their market capitalization, asset value, and even profitabi-lity and also sustainable business. However, investors need to be careful with this index has the highest risk aversion rate among stock price indices listed on Indonesia Stock Exchange.
Investors who are willing to encounter minimum risks and be comfortable to invest in shares in Indone-sia Stock Exchange may invest their funds in stocks
listed in the calculation of JII, besides they are sharia shares, stocks in JII are also able to generate positive return adjusted variability and volatility and also have low-risk aversion rate.
References
Alfi, A. F. & Mishra, T. K. (2014). Dynamics of Investors' Risk Aversion in emerging stock markets: Evidence from Saudi Arabia. SAMA Working Paper.
Arfinto, E. D. (2006). Bias beta di pasar modal indo-nesia dan metode koreksinya. Working Paper. Bednarek, Z., Patel, P., & Ramezani, C. (2014).
Sharpe ratio over investment horizon. Working Paper.
Husnan, S. (2005). Dasar-dasar teori portofolio dan analisis sekuritas (5 ed.). Yogyakarta: UPP STIM YKPN.
Lontoh, A. D. & Anggono, A. H. (2014). The con-struction of optimal balanced fund consisting Indonesian stocks and bonds (case study: LQ45 stocks and government bonds during period July 2009-June 2014). Journal of Business and Management, 3(3), 267–277.
Low, S. W. & Chin, Y. B. (2013). Refinements to the sharpe ratio-evidence from malaysian equity funds. Global Economic Review, 42(1), 72–97. Markowitz, H. M. (1952). Portfolio selection. Journal
of Finance, 7(1), 77–91.
---. (1959). Portfolio selection: efficient diversification of investments. New York: John Wiley & Sons, Inc.
Nyberg, H. (2010). QR-GARCH-M model for risk-return tradeoff in U.S. stock risk-returns and business cycles. Helsinki Center of Economic Research Discussion Papers (294).
Panait, J. & Slavescu, E. O. (2012). Using Garch-in-Mean model to investigate volatility and per-sistence at different frequencies for bucharest stock exchange during 1997-2012. Theoretical and Applied Economics, 19(5 (570)), 55–76. Scholz, H. & Wilkens, M. (2006). Investor-specific
performance measurement: A justification of sharpe ratio and treynor ratio. Working Paper. Sharpe, W. F. (1966). Mutual fund performance.
Journal of Business, 39(1), 119–138.