Estimating the Distribution of Air Voids in Concrete
Beasman, L.E.1) and McCuen, R.H.2)
Abstract: Chord length measurements are used to estimate the volumetric distribution of air voids within hardened concrete samples. The accuracy of the Linear-Traverse method is questionable because chord lengths do not directly represent the actual volumes of the air voids. Using computer simulation, randomly generated concrete samples were analyzed using the Linear-Traverse method to compute the distribution of air voids, the chord length gradation curve, the chord length-to-traverse ratio, and the air void volume gradation curve. The current chord-length approach significantly underestimated the air void content. A method that estimates that air void gradation curve from the chord length gradation curve is presented. The computer simulation results are supported by a conceptual analysis. To obtain the most accurate estimate of the air void content, computer analyses showed that at least 15 traverse lines should be regularly spaced on the concrete sample.
Keywords: Concrete, air voids, gradation curves, simulation, linear-traverse method.
Introduction
In concrete, air voids are empty spaces that are present throughout the dry component of the cement paste. During the mixing phase of the process, before the concrete has hardened, air enters the mass to form variously sized air voids. These air voids may
be microscopic on the scale of ten µm or large
irregular air pockets up to two mm in diameter. The total volume of these air voids within the concrete is known as the air void content.
Air is purposely added to the concrete to create air voids as a means of preventing failure due to fatigue. Repeated cycles of water freezing and then thawing can cause substantial damage to a concrete mass. The presence of air voids relieves some of the stresses caused by these cycles by allowing a space for the water to expand and freeze without imposing significant stress on the concrete system [1]. However, the presence of air voids can compromise the strength of a concrete system as the voids between cement grains reduce the total density and the strength of the system. It is recommended that the total air void content for concrete systems be within the range of four to nine percent volume fraction of air.
1 Research Assistant, Dept. of Civil Engineering, Univ. of Maryland,
College Park, MD 20742
2 Professor, Dept. of Civil Engineering, Univ. of Maryland, College
Park, MD 20742
Email: [email protected]
Note: Discussion is expected before June, 1st 2011, and will be
published in the “Civil Engineering Dimension” volume 13, number 2, September 2011.
Received 9 December 2009; revised 10 September 2010; accepted 22 October 2010
The only problem with this standard is that accurate technology is not currently available to measure the actual three-dimensional arrangement of the air voids within concrete. This has led to the developent of indicators based on length measurements. The Linear-Traverse method is an example of a linear indicator of the air void content in concrete samples [1].
The Linear-Traverse Method, a procedure that has been practiced since its development by Lord and Willis [2], uses a 4.5 x 4.5 x 1.0 in. (11.4 x 11.4 x 2.5 cm) sample of concrete with 20 lines drawn at regular intervals that traverse the width of the sample. These linear traverse lines intersect the volumetric air voids on the face of the concrete sample, and the length of each chord between the sides of an intersected air void is measured. The sum of the chord lengths of the air voids intersected by these traverse lines is then used to estimate the air void content, or total volume fraction of air, by summing the lengths of all the chords and dividing by the total length of the 20 traverse lines, each of which is the width of the sample. This ratio is referred to as the chord length index. The Linear-Traverse method is outlined in greater detail in the American Society for Testing and Materials, Designation C 457-98 [3]. Using the chord length index is one method recommended for estimating the air void content in hardened concrete [3].
index to calculate the air void content under-estimates the actual volume fraction of air by a considerable amount. This occurs for two reasons. First, a randomly located chord length is not a true representation of the volume of an air void. Every chord that would intersect an exposed air void would be shorter than the principal diameter and only the principal diameter can reflect the volume of the void. Second, a chord is a length measurement while an air void is a volume measurement, with the dimensions of length cubed. These two factors contribute to the chord length index underestimating the actual air void content.
Given that the chord length index does not provide an accurate estimate of the air void content, an accurate estimate of the air void gradation curve in concrete specimens is needed.
Additionally, it is important to know the distribution of air voids, not just the mean air void content. The
air void can range in diameter from several µm to
several mm. The cumulative frequency distribution of the air void volumes will be referred to as the air void gradation curve (i.e., similar to the gradation curve of soils, see [4]) If the chord length measurements are to be of value in accurately characterizing the air void gradation curve, it is necessary to know the number of traverse lines needed to provide an accurate summary of the chord length distribution. Based on these needs, the objective was to relate chord length measurements and the gradation characteristics of the air void content. Knowing the gradation distribution of the air voids is important to ensure that a sufficiently large number of air voids stays within the specifications.
Simulating Concrete Samples
Given that a sample is likely to include millions of
air voids, many of which are ten µm or smaller, it
would not be practical to identify the gradation curve or the air void distribution from a large number of actual specimens, therefore, computer simulation was used [5,6]. Instead of physically assessing each concrete sample with the Linear-Traverse device, concrete samples were simulated. Concrete samples based on specified parameters including the volume fraction of air, the number of traverse lines, and the gradation curve of the air voids were generated. To assess the influence of the volume fraction of air on the gradation curves of the total air void content and the chord length index, total volume fractions of air were simulated from 2 to 8%. Between five and 20 traverse lines were used to determine the number of traverse lines needed to produce accurate air void content data. Currently, 20 traverse lines are used to approximate the air void content in concrete samples.
For the selected independent parameters and gradation curve of the air voids, the program generates a virtual concrete sample with randomly dispersed air voids of varying size throughout the sample. The air void gradation curve of each simulated sample matched that of the assumed gradation curve, which suggests that chord length measurements made with each simulated sample will also be accurate. The simulation yielded the total number and distribution of air voids, the gradation curve of chord lengths, the chord length-to-traverse ratio, and the air void volume gradation curve. The gradation curve of chord lengths is the cumulative fraction distribution of the chord lengths measured on the traverse lines. Thus, the gradation curves for both the chord lengths and the air void volumes are known for each virtual sample. These estimates enable the relationship between the chord length index and the air void content to be evaluated.
Effect of Number of Traverse Lines
While 20 traverse lines are generally used in computing the chord length index, research is needed to show the actual number of traverse lines that are necessary to accurately compute the chord length index and subsequent gradation curves. Analyzing a varying number of traverse lines from each simulated sample allowed for the evaluation of the relationship between chord lengths and the air void content. Increasing the number of traverse lines will increase the number of air voids intersected on the face of the concrete sample, but will also increase the effort required to compute the chord length index.
The effect of the number of traverse lines on the accuracy of the chord length gradation curve was evaluated from graphs of the simulated volume of
the air voids (mm3) and the gradation curve of chord
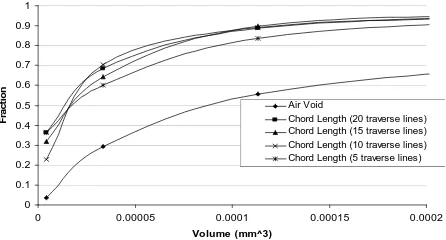
lengths for 5, 10, 15, and 20 traverse lines. Figure 1 shows the chord length gradation curves for an 8% volume fraction of air voids as a function of the number of traverse lines, which were 5, 10, 15, and 20.
0 0.1 0.2 0.3 0.4 0.5 0.6 0.7 0.8 0.9 1
0 0.00005 0.0001 0.00015 0.0002
Volume (mm^3)
Fr
ac
ti
o
n
Air Void
Chord Length (20 traverse lines) Chord Length (15 traverse lines) Chord Length (10 traverse lines) Chord Length (5 traverse lines)
Figure 1. Fraction of Chord Length/Air Voids present at
The number of traverse lines needed to accurately reflect the chord length index can be evaluated by computing the chord-length gradation curve for a varying number of lines. In theory, the line for 20 traverses would be more accurate than for a smaller number of lines. The gradation curve for 15 traverse lines is reasonably close to that for 20 lines (see Fig. 1). The curve based on 10 lines is inaccurate for the low volumes, and the curve based on 5 lines departs significantly from the 20-line curve. Analyses for air void volume fractions of 2%, 4%, and 6% yielded curves similar to those shown in Figure 1. Obviously accuracy increases with an increasing number of traverse lines. From Figure 1 and the other similar figures it was concluded that at least 15 traverse lines are necessary to determine the air void content within concrete samples. However, to provide increased accuracy 20 traverse lines were used for all subsequent analyses.
Air Void Ratio
Incorporating air voids is a necessary process to ensure against failure due to the fatigue of repeated cycles of freezing and thawing of water entrapped in the concrete sample, as previously described. The recommended standard for air void content to maintain the highest quality of concrete is between four and nine percent, depending on the specific application. It is essential that the volume fraction of air believed to be entrained within the concrete sample is an accurate estimation of the actual air void content.
To date, the volume fraction of air infused in the concrete sample, the air void content, is thought to be equal to the chord length index. However, the simulation results indicated that the traverse ratio is inaccurate by nearly 50%. This is illustrated by the differences in the air void and chord length gradation curves of Figure 1. Based on the simulated samples, the air void content was computed using the chord lengths and then compared with the actual content. Simulations were made for a number of gradation curves and air void contents. Figure 2 shows the chord length-traverse ratio at the different volume fractions compared to the actual volume fractions of air present in the simulated samples.
If the chord lengths would yield accurate estimates of air void volumes, then the values would fall on the y = x line, which represents what the chord length-to-traverse ratio should be for the actual volume fraction of air in the concrete samples. For an eight percent volume fraction of entrained air, the currently employed method of determining the actual air void content yields an air volume fraction of only 3.3%. Significant underestimation was true for all volume fractions from two to eight percent.
0
Vo lume Fractio n to Cho rd Length Traverse Ratio (20 traverse lines)
y = x
.06 Vo lume Fractio n(varying number o f traverse lines)
.08 Vo lume Fractio n (varying number o f traverse lines)
.04 Vo lume Fractio n (varying number o f traverse lines)
.02 Vo lume Fractio n (varying number o f traverse lines)
Figure 2. The Chord Length-to-Traverse Ratio at different
volume fractions
The chord length index provides inaccurate estimates of the air void content by at least 50%, implying that the amount of allotted air space for the thawing and freezing cycles of water through the use of air voids is highly underestimated when the chord length index ratio is used. With lower than anticipated air void content, the quality of the concrete is compromised as fatigue progresses through the specimen when otherwise thought to be more resistant to this form of failure.
Effect of Air Void Gradation
About 20 x 109 air voids can be contained within a
single cubic meter of concrete, ranging in size from
ten µm to 0.1 mm in diameter [1]. In addition to the
0
0 0.002 0.004 0.006 0.008 0.01
Volume of Air v oid (mm^3)
Fr
Figure 3. Right skewed gradation curve with air void
volumes for 0.08 volume fraction of air
0
0 0.002 0.004 0.006 0.008 0.01
Volume of Air Void (mm^3)
Fr
Figure 4. Left skewed gradation curve with air void
volumes for 0.08 volume fraction of air.
The curves in each figure show that the chord lengths yield much smaller volumes of air, especially for the left-skewed distribution. This shows the inaccuracy that can result from using the chord length index as a direct measure of the air void content.
In Figure 3, the gradation curve for an 8% volume fraction of air is skewed right, meaning the chord lengths measured from the traversing lines are predominantly of the smaller magnitude, with most
of the air void volumes being less than 0.002 mm3.
The chord length gradation curve is also skewed right because it is based on the right-skewed air void gradation curve. The two volume gradation curves have similar shapes but the curve based on the chord lengths indicates much smaller volumes. This should be expected because the chord length will almost always be smaller than the principal diameter of the air void. The chord-length volume of air voids underestimated the actual volume by a significant amount i.e., more than half.
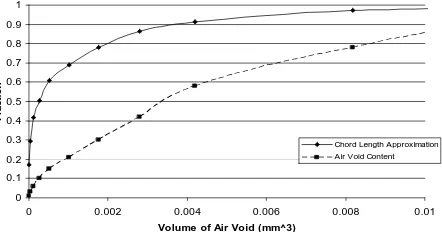
Using the Linear-Traverse method, the chord lengths intersected by the 20 traversing lines were used to calculate the total air void volume. With a left-skewed air void gradation curve (Figure 4), the chord length gradation curve shows a much greater difference than for the right-skewed distribution. The distribution of air void volumes based on chord length is much less accurate for negatively skewed
cases because volumes based on the larger chord length measurements deviate greater from the true volumes. With fewer air voids, the calculated air void volume from the chord lengths caused quite inaccurate results when compared with the true air void volume. When using the chord length approximation, about 80% of total air voids are
smaller than 0.002 mm3, but the actual air void
content showed only that 30% of the air voids were
smaller than 0.002 mm3 and that the majority of the
total volume of air voids is attributed to the larger sized voids. The chord length index was found to be most accurate when traversing 20 lines across a sample of concrete that consisted of a greater number of smaller size air voids as opposed to a sample with larger sized air voids. Understanding the true relationship between the chord length measurements and the air void content is necessary to predict the air void gradation curve for an actual concrete sample.
An Accurate Method of Constructing a Gradation Curve
Recognizing that direct use of the chord lengths provided poor estimates of the air void distribution and volume, a major objective was to develop a method that could accurately estimate the air void gradation curve from the chord length measurements. At this time, it is not practical to directly determine the distribution of air void volumes, so the relationship between the air void and chord length gradation curves must be identified. The relationship can then be used with a measured chord length gradation curve to estimate the air void gradation curve. The estimated air void gradation curve can then be used to estimate the fractions of the voids that fall inside and outside the critical range. The following procedure can be used with a measured chord length distribution to estimate the air void gradation curve: 1. From the sample measurements of the chord
lengths, create a gradation curve which is presented in cumulative form. This gives the fraction of chord lengths smaller than any specified chord length.
2. Standardize the gradation curve of step 1 by
dividing the length axis by the largest measured
chord length, Lx. This produces a dimensionless
length gradation curve with both axes having a 0-to-1 scale.
3. Using the dimensionless chord length gradation
curve of step 2, compute the mean, Lm, standard
deviation Ls, and skew Sl of the length distribution.
Also compute the maximum histogram ordinate of the density function, P.
4. Using the method of moments [7], with Lm and
Ls, compute the parameters vc and wc of the beta
approxi-mation to the dimensionless chord length gradation curve:
vc = Lm{[Lm(1-Lm)/Ls2]-1} (1)
wc = (1-Lm){[Lm(1-Lm)/Ls2]-1} (2)
5. Using the beta parameters for the chord length
gradation curve of step 4, compute the parameters (va and wa) of the beta distribution that will serve
as the dimensionless gradation curve for the air voids using the following relationships:
va = 0.119P-0.795 lne(1.614+22.7SL)
exp[0.667(vc+1.37)] (3)
wa = 5P-0.872 lne(2.21+30.1SL)
exp[-0.095(wc+0.822)] (4)
6. Using the maximum chord length Lx compute the
volume Vm = πLx3/6.
7. Use va and wa of step 5 to compute a beta
distribution to represent the dimensionless air void gradation curve.
8. Scale the abscissa of the dimensionless gradation
curve using the volume Vm computed in step 6.
The coefficients of Equations 3 and 4 were developed by relating the parameters of the beta distribution of the chord length measurements to those of the beta distribution for the air voids in the simulated samples. Equations 3 and 4 had correlation coefficients of 0.930 and 0.967, respectively. The standard error ratios were 0.392 and 0.273, respectively. Therefore, the goodness-of-fit statistics indicate that the two equations provide accurate estimates of the beta parameters.
Conclusions
To analyze the accuracy of the chord length index for characterizing the distribution of air voids, virtual concrete samples with randomly distributed air bubbles were generated. The relationship between the simulated gradation curves of the chord length index and the air void content was then analyzed while varying parameters such as the air void gradation, the number of traverse lines for the Linear-Traverse test method, and the volume fraction of air. The analyzed data indicated that the air void content based on chord lengths is at least 50% smaller than the volume fraction of air indicated by the air void gradation curves of the concrete samples. However, by evaluating the relationship between the distributions of the chord length index and the air void content a new method of accurately estimating the volume fraction of air and the distribution of air voids within concrete samples is presented. Independent virtual samples showed the method to be very accurate.
The simulations appear to provide accurate results as the computed air void gradation curves based on chord lengths closely matched the actual curves from the virtual samples. The results are also conceptually
rational. If a concrete sample is randomly sliced, it is very unlikely that the slice face would intersect each air void through its center. Also, it is very unlikely, almost impossible, for a traverse line to pass through the center of the exposed air void. In fact, analytical integration would show that the expected value of the chord lengths would be exactly 2/3 of the diameter of the air void. Cubing the chord length to compute the air void volume shows that a volume based directly on the chord length would significantly underestimate the true air void volume. These differences are illustrated in Figures 1 and 2. The relationships of Equations 3 and 4 enable a sample chord length gradation curve to be used to estimate the air void gradation curve for the same sample.
To get the greatest accuracy in calculating an air void content, an appropriate number of traverse lines must be used. From the results, at least 15 traverse lines should be used to yield accurate estimates of the volume fraction of air present within a concrete sample. However, overlapping air voids must be prevented. As the number of traverse lines is increased, the spacing decreases and the likelihood of multiple intersections of an air void by adjacent traverse lines increases. If 15 traverse lines are used on a standard concrete sample and delineated at regular intervals, each pair of lines should be separated by 7.62 mm. This implies that the largest
air void cannot exceed 7260 µm in order to prevent
any overlapping measurements of chord length. However, with 20 traverse lines, the interval would be 5.715 mm, and that the largest air void diameter could not exceed 5715 µm.
The detection of inhomogeneity of air voids throughout a specimen is one important implication of the number and spacing of the traverse lines. The geometric distribution of the air voids throughout the concrete specimen would be unknown; however, in the development of the method presented herein, it was assumed that all of the air voids were spherical in shape and displayed gradations with varying skewness. But the homogeneity of the air voids may also need to be considered. Having a greater density of air voids present in one sector of the specimen or having minimal air voids present could compromise the physical properties of the concrete. Under-standing how to randomly disperse the air voids to promote optimum concrete performance is needed.
References
1. Hover, K.C., Air Content and Unit Weight of Hardened Concrete. Chapter 28 of Significance of Tests and Properties of Concrete and Concrete Making Materials (P. Klieger and J.F. Lemond,
eds.), ASTM Special Technical Publication 169c.
2. Lord, G.W. and Willis, T.F., Calculation of Air Bubble Size Distribution from Results of Rosiwal
Traverse of Aerated Concrete, ASTM Bull.,
ASTBA, No. 177:56-61, 1950.
3. ASTM, Standard Test Method for Microscopical
Determination of Parameters of the Air-Void System in Hardened Concrete. ASTM C 457-98, West Conshohocken, PA, 1998.
4. Julien, P., River Mechanics, Cambridge Univ.
Press. New York, 2002.
5. Sobol, I.M., A Primer for the Monte Carlo Method, CRC Press, Boca Raton, FL, 1994
6. McCuen, R.H., Modeling Hydrologic Change, Lewis
Publishers, CRC Press, Boca Raton, FL, 2003.
7. Hastings, N.A.J. and Peacock, J.B., Statistics
Distributions, John Wiley & Sons, Inc., New York, 1975
8. Mendenhall, W. and Sincich, T., Statistics for