©
Copyright by The International Journal of Marine and Aquatic Resources Conservation and Co existence
, -
.
/
$0
% 1
0
2
!
3
-4
#%5
, 1
6
,
'%"7
3
'%0
'%1)
Postgraduate Programe Master of Double Degree Program Planning and Management of Marine Resources Master Coastal Resources Management, Faculty of Fisheries and Marine Sciences,
Diponegoro University – Semarang
Jl. Prof. Soedarto SH. UNDIP, Tembalang, Semarang. 50275
2)
Science Naturel – Lab. Mer, Molécule et Sante L’Université du Maine, Le Mans – France Ave Olivier Messiaen, 72085 Le Mans, Cedex 9, France
Email: [email protected];
Received: February 24, 2014, Accepted: Juni 4, 2014
.18 8
We are well known that the marine pennate diatom (Gaillon) Simonsen produces the blue green pigment called marennine. Marennine was identified as a polyphenolic compound. This compound is capable to inhibit the growth of herpes simplex virus type 1 (HSV 1) and several bacteria, including pathogens as sp. The aim of this study was to determine how strong the allelophatic effect of marennine is generated by and identifying its minimal concentration that inhibits the growth of other microalgae. The experiment consisted of two phases of research activities. The first phase was biovolumecomparaison between
and microalgae suitable for aquaculture tested to take into account the differences in size of the microalgae
tested( and ) in term of
biomass and production of marennine. The second phase was the bioactivity tests, which is include growth kinetics, allelophatic effects and concentration of marennine in the culture medium, measured with spectrophotometer. The results of this study showed that could inhibit several species of microalgae currently used in aquaculture ( and
). The statistical analysis (One way ANOVA) showed that there are significant differences (P < 0, 05) between treatments andwhen co cultured with , these microalgae exhibited a significant growth inhibition. The highest inhibition value was 97.77% (on the treatement + ). In this treatment, the concentration of marennine in the culture was 5.35 mg L1. According to the results, we can conclude that the supernatant of with marennine acts as an allelochemical. The minimal concentration is 0.23 mg L1 and the highest is 5.35 mg L1. The treatments with and did not performed any inhibition.
9 , 2 , marennine, microalgae and Allelopathic effect.
:8 )/; 8 ):
One of the diatom potential to be developed is . This species is known as a diatom that is able to produce a blue green pigment, the so called marennine. This pigment is water soluble, and according to Pouvreau . (2006), it could have a polyphenolic nature.
cells are often found in the cultivation of Oysters ( ) both on the body and in oyster ponds. In addition, the presence of these particular diatoms is causing greening of the oyster’s gills.
Pouvreau .(2006) proposed that the marennine produced by is an allelophaticsubstances from the class of polyphenols. The presence of blue green pigment had an impact on other microalgae, in particular microalgae used as feed of , eg and
. Another study conducted by Gastineau (2012) showed that, is able to inhibit the development of herpes simplex virus type 1 (HSV 1) and several bacterial pathogens.
The existence of in oyster ponds, and the biological activities of marennine, raises the question of a possible allelochemical effect in the ecosystem of oyster ponds. Marennine produced by and released in the seawater, could act as an allelochemical substance, through the competition for space (growth and development).
Allelopathic test of an allelochemical (often in form of terpenoids, alkaloids and phenolic compounds) can be done with the test of growth and competition within the same container. The present study is focused on the assessement of the allelopathic effect of in conditions of microalgal co cultures. In this case, the source of allelopathic substances will be taken throughout the body of
and culture media. Growth kinetics and allelopathic tests are done on several microalgae species commonly used in aquaculture as feed of , or in hatcheries.
©
on the growth of other microalgae and how much is the concentration of marennine in the culture, where these concentrations showed growth inhibition of other microalgae. Thus the aim of this research is to determine how strong the allelophatic effect of marennine generated by is, and identify its minimal concentration that inhibits the growth of other microalgae (through measurement level of inhibition), by way of spectrophotometry (absorbance value)
8- 7 :/ -8<)/
!
The main experimental species used in this study is from on the Atlantic Coast of France, in Marennes Oléron Bay and Bourgneuf Bay. The other species for allelopathy study are CCAP 927"
CCMP 904 UTEX
and .
! #
The study consisted of two phases such as:
The first phase was to measure the biovolume of each microalgal species, and other microalgae relevant for aquaculture. The rationale is to measure and to compare the cell volume of with other microalgae, and to express possible allelopathic effects in function of the volume ratios and on a per cell basis. The second phase was the bioactivity measurement which includes growth kinetics, allelophatic effects and concentration of marennine in the culture medium, measured with a spectrophotometer (Absorbance value)
!
Microalgae were grown in sterilized conical flasks 500 ml (by autoclaving), containing medium of artificial seawater (ASW) (Mouget ., 2009). The flasks were placed in a room with temperature controlled at 16 ± 1 °C, an irradiance of 100 µmol photons m2 s1 (quanta meter), and a photoperiod of 14h / 10h light / dark except " grown at 21 ± 1 °C and a photoperiod of 18h / 6h because originally from Hawaii Institute of Marine Biology. The light was provided by Philips TLD 36 watt/965 Fluorescent tubes.
! $ % !
This method refers to the method of Hillebrand . (1999). Microalgae were grown in ASW, and biovolume were then calculated when the exponential phase was reached. First, number of existing microalga was counted. Microalga was then placed on Nageotte/Neubauer counting slide, depending on the species. Afterwards volume of each microalga was calculated. Observations were made using a light microscope (Axiostar) with magnification of 200, 400 and 1,000 X, directly connected to the camera and computer. ImageJ software was used to diatom growth. In this research, experiments were conducted in a glass tube containing the culture of CCAP data were analyzed by growth curve based on data obtained per unit of time.From these data, we can calculate the generation time (time products/double) and the relative growth of different types of microalgae culture results. The formula for the experiments were performed in a sterile Erlenmeyer containing
culture and
in the filtered ASW (Millipore 0.22 Om). Then, was added into each culture. Furthermore, the sample incubated at 16 °C for 14 days less than 100 Omol photons m2 s1 in the light dark phase of 14/10 hours except
grown at 21 ± 1 °C and photoperiod of 18h/6h.
©
To determine the concentration of extracellular marennine contained in each sample, dose/concentration of marennine in each culture was calculated during the treatment. The dose was measured at the end of the incubation period (t = 10 days). For the target microalgae, the cultures were filtered by using milipore, to obtain the supernatant (extracellular marennine for dose measurements). Then, the absorbance of the supernatant was measured by spectrophotometry (used Spekol 1,100 and wavelength range 350 750 nm), and the concentration determined according to Robert et al. (2002) use the specific extinction coefficient for EMn (Blue Water) (ε
The experimental design used in this study was completely randomized design (CRD) with nine treatments and three replications. Allelophatic test results were analyzed statistically by ANOVA test (one way) using SPSS 16.0 for Windows software. Discrepancy observed was further tested with HSD
post hoc test multicomparaison.
-1;78 :/ / 1 ;11 ):
%
From biovolume calculation, it showed that volume average (mean ± SE, n=35) of is 1,662.52 ± 45.48 µ m3cells1, while for another microalga is (387.37 ± 17.02 µm3 cells1), (93.15 ± 5.63 µm3 cells1),
(58.59 ± 3.59 µm3cells1), (41.89 ± 3.12 µm3 cells1) and (26.06 ± 2.03 µm3 cells1). The volume obtained for each microalga, was then compared to the biovolume of as a reference for the growth kinetics test and test allelopathic. Results of the comparisons are as follows:
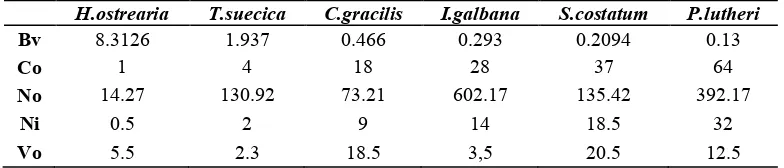
Table 1. Comparison biovolume some microalgae with
. 8.3126 1.937 0.466 0.293 0.2094 0.13 measurements can be comparable with the number of cells that are in the culture. daily growth of some microalgae population is still increasing (Table 2). The growth curves are presented in Figure. 1.
©
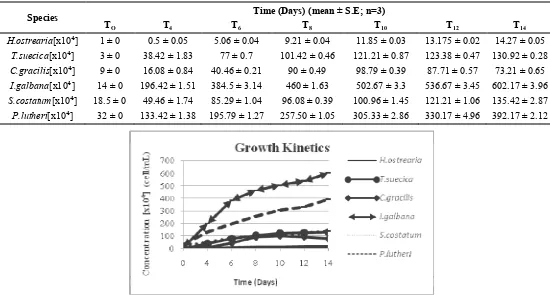
Tabel 2. The microalgae density during culture period
1 8 $/ , % $ > 1 -? @A%
8) 8+ 8( 8B 8#* 8#' 8#+
[x10⁴] 1 ± 0 0.5 ± 0.05 5.06 ± 0.04 9.21 ± 0.04 11.85 ± 0.03 13.175 ± 0.02 14.27 ± 0.05 [x10⁴] 3 ± 0 38.42 ± 1.83 77 ± 0.7 101.42 ± 0.46 121.21 ± 0.87 123.38 ± 0.47 130.92 ± 0.28 [x10⁴] 9 ± 0 16.08 ± 0.84 40.46 ± 0.21 90 ± 0.49 98.79 ± 0.39 87.71 ± 0.57 73.21 ± 0.65 [x10⁴] 14 ± 0 196.42 ± 1.51 384.5 ± 3.14 460 ± 1.63 502.67 ± 3.3 536.67 ± 3.45 602.17 ± 3.96
[x10⁴] 18.5 ± 0 49.46 ± 1.74 85.29 ± 1.04 96.08 ± 0.39 100.96 ± 1.45 121.21 ± 1.06 135.42 ± 2.87 [x10⁴] 32 ± 0 133.42 ± 1.38 195.79 ± 1.27 257.50 ± 1.05 305.33 ± 2.86 330.17 ± 4.96 392.17 ± 2.12
Figure 1. Growth curves for the different microalgae experessed in number of cells per unit volume.
Tabel 3. Generation time, Growth Rate and Equation rate of microalgae population growth
1 0
8 $/ , %
0 2
$ "#%
-!
6 0 2
2.89 0.24 y = 1.1588x – 1.1469 2.32 0.29 y = 9.7532x + 9.8107 4.05 0.17 y = 6.3766x + 10.13 2.58 0.27 y = 42.092x + 60.498 4.87 0.14 y = 8.2929x + 22.729 3.87 0.18 y = 25.63x + 37.483
Observations in the growth curves of populations of the 7 algal species for the experimental period (14 days) can be viewed in Figures 1. For instance, based on the growth curves it is observed for the given experimetal period (14 days), that has exponential phase / log phase with a sharp increase in the growth rate from 0 to 10 days to increase the density from 3,000 cells mL1 to 121.21 x 10⁶ cells mL1. This is indicated by the results from calculation of doubling time (generation time) of the six species population growth of algae, which means generation of the lowest time is the shortest time it takes one (generation) population to grow to 2 fold or the next generation. Growth of . population in this phase showed the shortest doubling time (generation time) as much as 2.32 days as compared to other microalgae. This shows that
needs a short time to grow 2 fold on the next generation.
Differences in the growth rate in some microalgae resulted in differences in the length of the logarithmic phase, and in the biomass producted. Based on these results, cultures with low growth rate will have longer exponential phase. This is caused by the lower growth rate of cultures will reach saturation point microalgae slower than other cultures.
©
for each microalga vary with species from 8 to 10 days and the shortest was for which is on the 8th days, but the biomass (as estimated by the biovolume, see Fig. 2) is low. Based on this result, it can only be inferred that for our culture conditions, the species of microalgae that has the fastest harvesting time is .
The determination of a growth curve can be done in several ways, such as by direct calculation of the number of cells using
Nageotte / Neubauer counting device (it gives the number of cells in cultures using quantitatively limited volumes), dry weight calculation (it needs more biomass), different molecular markers (more or less complicated to measure as routine, chlorophyll , carbon, ATP, etc.), or calculation and measurement by cell volume (Mayer 2007). Based on biovolume measurements cell, the growth curve of microalgae can be seen in Figure 2.
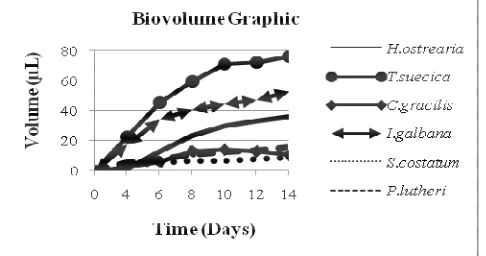
Figure 2. Growth curves based on the cell volume (µL)
Figure 2 shows that the six cultures weren’t through acclimation phase, as explained above (growth conditions unchanged during inoculation, inoculum in log phase. Cells were placed in the same growth medium and the same environment as the medium and the previous environment, thus they do not require adaptation time (Fogg, 1975).
) + ' !
allelopathic test consisted in the co culture of plus one of the following aquaculture relevant
microalgae: ( ),
and . As presented in Table 2, the M0
treatment (monoclonal cultures, controls) showed that the concentration of microalgae growth (mean ± SE) for each species is 11.85 x 10⁴ ± 0.03 cells mL1 at t = 10 for control
; 121.21 x 10⁴ ± 0.87 cells mL1 at t=10 for ; 98.79 x 10⁴ ± 0.39 cells mL1 for , 502.67 x 10⁴ ± 3.3 cells mL1 for ( ); 100.96 x 10⁴ ± 1.45 cells mL1 for at t=10 and 305.33 x 10⁴ ± 2.86 cells mL1 for
.
For treatment M1 ( CCMP 904 +
) concentration of was 31.42 x 10⁴ ± 3.78 cell mL1 and for at 8.08 x 10⁴ ± 0.84 cells mL1. Treatment M2 ( UTEX + ) was
2.69 x 10⁴ ± 0.09 cell mL1 for and 20.33 x 10⁴ ± 0.18 cell mL1 for . In treatment M3 ( & (
) + ) performed 2 times with different temperatures, A is placed on treatment temperature of 16 °C and B placed on the 21 °C, at a temperature of 16 °C the concentration of was 48.2 x 10⁴ ± 5.71 cells mL1 and for at 8.21 x 10⁴ ± 2.11 cell mL1, whereas when placed at a temperature of 21°C concentration of 261.22 x 10⁴ ± 6.35 cell mL1 and 2.64 x 10⁴ ± 0.55 cell mL1 to
.
For treatment M4 ( + ), cells
concentrations were 2.11 x 10⁴ ± 0.59 cell mL1 for
and 18.44 x 10⁴ ± 1.71 cell mL1 for . On treatment M5 ( + ) average concentration
was of 217.78 x 10⁴ ± 3.15 cell mL1, whereas for it was 4.02 x 10⁴ ± 1.25 cells mL1.
Based on the calculation of the biovolume of microalga in the test medium (ASW), treatment Mo (control) showed that the volume of microalgae (mean±SE) on each species is 29.55 ± 0.03 µL at t=10 for control ; 70.43 ± 0.87 µL at t=10 for , 13.8 ± 0.39 µL for 0 44.18 ± 3.3 µL for ( ); 6.29 ± 1.45 for µL at t=10 and 11.93 ± 2.86 µL for .
Allelopathic test with the treatment M1 showed that the
total volume of microalgae grown in test medium was 25.15 ± 0.84 µL for while was 18.26 ± 3.78 µL. Allelopathic test with treatment M2 showed that the microalgae
volume on the culture medium for was 50.7 ± 0.18 µL and 0.39 ± 0.09 µL for , which declined, because of the allelochemical effects generated by .
Allelopathic test in the treatment M3 showed that the
biovolume for the diatoms grown at 16 °C was 20.47 ± 2.1µL for and 4.24 ± 5.71 µL for . When the two species were grown at a temperature of 21 0C, the volume average was 6.88 ± 0.55 µL for and 22.96 ± 6.35 µL for .
Allelopathic test for treatment M4 showed that the average
volume of was 46.16 ± 1.71 µL, while for it was 0.13 ± 0.39 µL. In this treatment, almost the entire culture was dominated by . Treatment M5
showed that the average volume of was 10.025 ± 1.25 µL and 8.51 ± 3.15 µL for .
Based on the results above, it is shown that in terms of biovolume, dominated each culture except for the culture of (at temperature 21 0C) and that seems to be dominant when the two species were co cultured. According to the growth rate and inhibition level, it has been shown that isable to inhibit the growth of other microalgae, when they are co cultured. The overall inhibition level on the microalgae tested, whether it results from the blue water or nutrient competition, was 74.38% ± 3.13; 97.77% ± 0.09; 90.5% ± 1.14; 98.4% ± 0.59 and 28.72% ± 1.03 for
©
, respectively. However, when co cultured with and , no inhibition observed
for .
Table 4. Growth Rate (%) and Inhibitions
8 0 2 $C% >1 - $C% >1
-1 " 25.62 ± 3.13 74.38 ± 3.13
1 " 2.23 ± 0.09 97.77 ± 0.09
23°C 1 " 9.5 ± 1.14 90.5 ± 1.14
42°C 1 " 54.77 ± 2.53 45.23 ± 2.53
1 " 1.6 ± 0.59 98.4 ± 0.59
1 " 71.28 ± 1.03 28.72 ± 1.03
One way ANOVA test showed that the significant value of 0.09 for the test of homogeneity of variances which means the data is homogeneous. Thus, the assumption of homogeneity of variance has been met so that ONE WAY ANOVA test can be continued. Seen from the ANOVA table that the calculated F value = 996.09, which is where the value is greater than the value of F table = 1.84 (based on the F distribution tables) so it can be concluded that we can reject H0. With a significance
value of 5%, we can conclude that the same, ie, reject H0. It can
be seen from the significant value = 0.000. This value is smaller than the significance level = 0.05 level. So, allelopathy treatment ( against other microalgae) influenced the growth of microalgae.
To determine the main factors in growth inhibition of microalgae, further HSD Tukey test was used. HSD Tukey test showed that culture treatment of then
the strongest influence, respectively. For the treatment of and grown at 16°C, results indicated that the effect of treatment gave a moderate level. This result was also confirmed by the inhibition that occurs only about 74.38% and 90.5% (Table 4).
HSD Tukey test showed that the allelopathic effect against and (placed at a temperature of 21 °C) did not show significant differences, but the treatment can inhibit the growth of the microalgae as much as 28.72% and 45.23% for and (at a temperature of 21 °C), respectively. On the other side, statistical analysis showed that the growth of a was also affected by this treatment (when combined with the 5 and ( 21
0
C).
$ ./ ! .! "
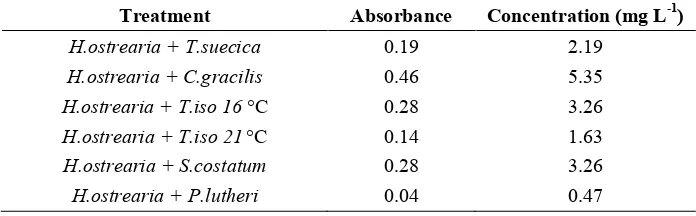
The values of marennine concentration in the blue water at the end of the allelopatthy test varied with the co cultured species. Filtered samples using Miliphore indicates that the highest blue water concentration was observed on M2 (
+ ) is 5.35 mg L1. On the other side, the lowest concentration found at M5 ( + )
which is equal to 0.47 mg L1. Table of marennine concentration on each treatment is provided as follows.
Table 5. Extracellular Marennine Concentration After allelopathic Test
8 $ 3 7#%
1 0.19 2.19
1 0.46 5.35
1 23°C 0.28 3.26
1 42°C 0.14 1.63
1 0.28 3.26
1 0.04 0.47
In Table 5 it is shown that the treatments + and + resulted in concentrations as high as 5.35 mg L1 and 3.26 mg L1, respectively. + (16 °C) indeed have a particularly high concentration value (ie 3.26 mg L1). However, was still present in these cultures, so the results of optical density could be the combination between pigments of and .
The aim of this study was to dertermine the influence of and marennine on the growth of different species of aquaculture relevant microalgae, when they are co cultured with the blue diatom. Our results showed that the influence of
is species dependent. Indeed, the growth of
and was slowered down or inhibited when these species were co cultured with
, whereas 5 , and seemed almost indifferent. There are several hypotheses that may explain this phenomenon. For example, the overall effect of co culturing
©
influence observed could reflect competition relationships for nutrients and energy, which allows algae to respirate and photosynthesis. Although at the beginning of the treatment, the biovolume for each species was equivalent, at the time of its growth, all of four microalgae were hampered by . The influence of extracellular marennine released by
in response to competition for space could thus be a defense strategy. Our results are in accordance with Pouvreau ., (2007) which demonstrated that exerts an allelopathic effect against and other microalgae.
Harper ., (2001) states that marine microalgae are generally able to develop a self defense system by producing a chemical compounds (chemical defense). Chemical compounds produced by marine microalgae is useful to defend themselves against predators, space competition (to grow and feeding) to prevent ultraviolet exposure. In this study, the secretion of extracellular marennine by could possibly be considered as a response to space competition. It seems that all four microalgae are affected by the presence of these secondary metabolites is something that remains largely unknown, but many experts argue that a secondary metabolite is a detoxification product of toxic metabolites and can not be removed by the organism itself (Mannito, 1981).
Marine microalgae are believed to have the ability to produce bioactive compounds, such as antibiotics, toxins and antitoxins, antitumor and antimicrobial agents. Research conducted by Gastineau ., (2012, 2013) confirmed that blue diatoms ( –like diatoms) have such capabilities, thanks to marennine like piments. Molecular compositions of compounds produced depend on the fertility of marine environment, cell defense mechanism against alteration from outside its natural environment (Leone ., 2007).
The treatment M3 ( + ( ) also
demonstrated that microalgae require specific environments to grow optimally. As an example in this case, when we put the treatment on temperature of 16 °C, successfully grows, while the growth of was depressed (inhibited). In contrast, grows well when placed at a temperature of 21 °C but experienced an inhibition. According to Gastineau ., (2013) would grow optimally at temperature of 16 °C and (T.iso) at temperature of 21 °C (Espinoza ., 2002; Van Bergeijk ., 2010). influence on physiological function of microalgae. High temperatures will affect the metabolism, increase cell doubling rate, respiration and affect the movement of diatoms due to the changes in the viscosity of their cytoplasm in the raphe. This is also supported by Campbell . (2004), which stated that temperature influence the stability of communities, removal some species of diatom and changes in resource availability. which should be shared between the two organisms. However, it doesn’t mean that (by way of extracellular marennine) is not effective. Its influence is likely to occur but to a very small extent (inhibition = 28.72% ± 1.03).
Resistancy of certain microalgae against the secondary metabolite of is probably due to the structure of that the allelopathic power decreased over time for instance in T10 for treatment M3 ( + ( at
temperature 21°C) and the treatment M6 ( +
). Declining allelopathic power indicates that there has been changement or adjustment of bioactive substances which exist in . Decomposition of dead microalgae in culture may also possibly eliminate toxicity of the secondary metabolites.
Gastineau .,(2012) explained that marennine produced by able to deliver growth inhibition during the process of mitotic (embryo). This is possible because of the phenolic compounds contained in marennine. It causes lasting cell division cycle. So the generated cell production slightly. In the other hand, according to the research of Pouvreau . (2007) flavonoids (in this case phenol) can inhibit cell membrane active transport (Na+ and K+) so causing the cell wall lysis (rupture). However, until now unknown which the phase inhibited.Einhellig (1995) asserts that the phenolic compounds and their derivatives can affect several important processes such as cell division, mineral absorption, balance, respiration, photosynthesis, protein synthesis and chlorophyll content in microalgae. In addition, growth inhibition may also be due to nutrient mobilization barriers. This could be possible because of the large body of which allowed them to absorb more nutrients as compared to other microalgae, although given its large size, its growth rate is lower than those of smaller cells.
From the overall treatment, allelopathic is not influenced by the light level and the agitation which carried out a better nutrient utilization. According to Mouget ., (2005),
and other microalgae grow normally with white light. Agitation before algal counting was not really affect the quantity and allelopathic of culture. Furthermore, temperature, illumination and medium culture were inequal quantity, so that the result should be mostly the effect allelopathy of
.
): 7;1 ):
©
aquaculture. The concentrations of marennine which have been shown to inhibit the growth of microalgae ranged from 0.47 mg L1 to 5.35 mg L1. However measurement with HPLC PDA is suggested to obtain more precise values of marennine concentration, and to confirm that marennine is the main/only chemical involved in the allelopathic effect caused by a supernatant of culture.
9:) 7-/0- -:81
We want to thanks all those who contributed over the months to make this work and in particular: Lab. Mer, Molécule et Santé, Université du MaineLe Mans, Pr. Nathalie BOURGOUGNON, vice president of Université de Bretagne Sud,Thanksful to Prof. M. Zainuri, Dr. Ita Widowati and Dr. Jusup Suprijanto, responsable of Program Studi Konsentrasi Perencanaan dan Pengelolaan Sumberdaya Kelautan Magister Manajemen Sumberdaya Pantai (PPSK MSDP), Diponegoro University and Beasiswa Unggulan Ministry of National Education (BPKLN), who has provided me the scholarships and financial support. We acknowledge helpful comments by Prof. Dr. Ir. Johannes Hutabarat, M.Sc and Dr. Ita Widowati (the reviewer).
-5- -: -1
Campbell, N.A., J.B. Reece and L.G. Mitchell. 2004. Biology.Erlangga: Jakarta. 459 p.
Dauta, A., Devraux, J.,Piquemal, F and Boumnich, L.1990. Growth Rate of Four Freshwater Algae in Relation to Light and Temperature. # . 207: 221 226.
Einhellig, F.A. 1995. Allelopathy: Allelopathy Organism, Processes and Aplications. In: Inderjit, K.M. and M.Dakshini. AtSymposium Series: Allelopathy Organism.the Botanical Review 60(2):182 196.
Espinoza, E., Valenzuela, R.Millán Nunez, F.Núnez Cebrero.2002. Protein, Carbohydrate, Lipid and Chlorophyll Content in (clone T Iso)Cultured with a Low Cost Alternative to The f/2Medium. .5 . . )6 . . 25: 207 216.
Fogg, G.E. 1975. Algal Culture and Phytoplankton Ecology. The University of Winsconsin Press: London. 7 45 pp.
Gastineau, R., Pouvreau, J.B., Hellio C., Morançais M., JoëlFleurence, Gaudin P.,Bourgougnon N.,and Mouget, J. L. 2012. Biological Activities of Purified Marennine, the Blue Pigment Responsible for the Greening of Oysters. 7 $ ) # 8 # .Accessed 6 May 2013 at pubs.ACS.org/JAFC.
Gastineau, R. 2013. Inheritance of Mitochondrial DNA in the Pennate Diatom (Naviculaceae) during Auxosporulation Suggests a Uniparental Transmission. Protist. Accessed 13 May 2013 at http://dx.doi.org/10.1016/j.protis.2013.01.001.
Harper, M.K., T.S. Bugni, B.R. Copp, R.D. James, B.S. Lindsay, A.D. Richadson, P.C. Schnabel, D.Tasdemir., R.M. Van Wagoner, S.M. Verbitski, and C.M. Ireland. 2001. Introduction to The Chemical Ecology of Marine Natural Product. In: Marine Chemical Ecology (James B. McClintock & Bill J.Baker Eds.). CRC Press: USA. 3 29 pp.
Hillebrand, Helmut. 1999.Biovolume Calculation for Pelagic and Benthic Microalgae. 7 35:403 424.
Leone, S., A. Silipo, E.L. Nazarenko, R. Lanzetta, M. Parrilli, and A. Molinaro. 2007. Molecular Structure of Endotoxins from Gram negative Marine Bacteria: An Update, Mar. Drugs 5th edition. 85 112 pp.
Mannito, P.1981. Biosynthesis of Natural Products. Ellis Horwood Limited. 223 320 pp.
Mouget, J. L., Rosa, P. Vachoux, C & Tremblin, G. 2005. Enhancement of Marennine Production by Blue Light in the Diatom 7 $ )++ # 17: 437 445.
Mouget, J. L.,Gastineau, R., Davidovich, O.,Gaudin, P. and Davidovich, N.A. 2009. Light is a Key Factor in Triggering Sexual Reproduction in The Pennate Diatom . 8.! ! . 69: 194 201.
Mayer, A.Marine Pharmacology in 2007−8: Marine compounds with antibacterial, anticoagulant, antifungal, anti inflammatory, antimalarial, antiprotozoal, antituberculosis, and antiviral activities; affecting the immune and nervous system, and other miscellaneous mechanisms of action.Comp.Biochem. Physiol., Part C: Toxicol. Pharmacol.2011,153, 191 222.
Pouvreau, J.B. 2006. Preliminary Characterisation of The Blue Green Pigment Marennine from The Marine Tychopelagic Diatom (Gaillon/Bory)
7 )++ 18: 757 767.
Pouvreau, J.B.,Housson, E., Le Tallec, L.,Morançais, M., Rincé, Y.,Fleurence, J. andPondaven, P. 2007. Growth inhibition of several marine diatom species induced by the shading effect and allelopathic activity of marennine, a blue green polyphenolic pigment of the diatom Hasleaostrearia (Gaillon/Bory) Simonsen. 7 $ ./+ ! % # . 352: 212 225.
Robert, Jean Michel.,Morançais, M., Pradier, M., Mouget, J. L.and Gérard, T.2002. Extraction and quantitative analysis of the blue green pigment “marennine” synthesized by the diatom 7 $ )++ # 14: 299 305.
Van Bergeijk, S.A., Salas Leiton, E. and Canavate, J.P.2010. Low and variable productivity and low efficiency of mass cultures of the haptophyte " in outdoor tubular photobioreactors. .5 . . 9 )6
. . 43: 14 23.