PIDIE
DALAM ANGKA
Pidie in figures
2014
BADAN PUSAT STATISTIK
KABUPATEN PIDIE
PIDIE DALAM ANGKA 2014 PIDIE IN FIGURES 2014
Katalog BPS: 140302001.1109
Ukuran Buku : 21 x 14,8 Cm Jumlah Halaman : 417 Halaman Naskah:
- Subbagian Tata Usaha - Seksi Statistik Sosial - Seksi Statistik Produksi - Seksi Statistik Distribusi
- Seksi Neraca Wilayah, dan Analisis Statistik
- Seksi Integrasi Pengolahan dan Diseminasi Statistik
Gambar Kulit:
Seksi Integrasi Pengolahan dan Diseminasi Statistik
Diterbitkan Oleh:
Badan Pusat Statistik Kabupaten Pidie
Boleh Dikutip dengan Menyebutkan Sumbernya
KABUPATEN PIDIE
KATA PENGANTAR
KEPALA BPS KABUPATEN PIDIE
Dengan memanjatkan puji dan syukur Kehadhirat Tuhan Yang Maha Kuasa, yang telah memberikan taufiq, hidayah, kekuatan dan kemampuan kepada kami sebagai team penyusun publikasi “Pidie Dalam Angka Tahun 2014” sehingga kami telah dapat menyelesaikan publikasi ini dengan sebaik-baiknya.
Publikasi “Pidie Dalam Angka ” merupakan publikasi tahunan yang diterbitkan BPS Kabupaten Pidie. Publikasi ini menyajikan data sekunder yang berasal dari berbagai Dinas/Instansi/Lembaga dalam lingkungan pemerintahDaerah Kabupaten Pidie maupun non Pemerintah dan data-data hasil Survey dan Sensus yang dilakukan oleh Badan Pusat Statistik Kabupaten Pidie.
Keberhasilan kami dalam penyusunan publikasi ini tidak terlepas dari bantuan Dinas/Instansi/Badan/Lembaga dan Organisasi lainnya, yang telah ikut serta dalam memberikan bantuan data yang diperlukan, oleh karena itu pada kesempatan ini kami mengucapkan terima kasih yang sebesar-besarnya, semoga jalinan kerjasama yang baik ini kiranya dapat terus berlanjut pada tahun-tahun mendatang.
Semoga publikasi ini dapat memenuhi kebutuhan para konsumen data.
Sigli, Agustus 2014 KEPALA BADAN PUSAT STATISTIK
KABUPATEN PIDIE,
Syarbeni, M.Si
NIP. 19720604 199312 1 001
PREFACE CHIEF BPS OF PIDIE REGENCY
Thanks to God the almighty who give us opportunity, way and strength for us as the arranger of “Pidie Dalam Angka 2014”.
The publication of “Pidie Dalam Angka” is the annually Publication that published by BPS Kabupaten Pidie. This edition serves secondary data from formal and non formal office and institution in Pidie and also serves result data and census done by BPS Pidie.
This success is also supported by unlimited give by other offices/institutions. Through this moment we would like to thank you a lot, hopefully this good cooperation can be continued in the future.
Hope this publication can fulfill the data consumers need.
Sigli, Agustus 2014
CHIEF BPS OF PIDIE REGENCYSyarbeni, M.Si
NIP. 19720604 199312 1 001
Daftar Isi Content
Pidie Dalam Angka 2014
Pidie in Figures 2014 xv
DAFTAR ISI/Content
Peta Kabupaten Pidie iii
Logo Kabupaten Pidie iv
Kata Pengantar Kepala BPS Kabupaten Pidie xii Preface Chief BPS of Pidie Regency xiii
Daftar Isi xiv
Daftar Tabel xvi
BAB I GEOGRAFIS/GEOGRAPHIC 1
Letak Geografis/ Geographical Location 1 BAB II PEMERINTAHAN/ADMINISTRATIVE 7
BAB III KEPENDUDUKAN/DEMOGRAPHY 57
BAB IV SOSIAL/SOCIAL 63
BAB V PERTANIAN/AGRICULTURE 185
BAB VI INDUSTRI DAN PERDAGANGAN/
INDUSTRY AND COMMERCE 273
BAB VII PERHUBUNGAN DAN KOMUNIKASI/
TRANSPORTATION AND COMMUNICATION 311
BAB VIII KEUANGAN DAN HARGA-HARGA/
PRICES AND FINANCE 329
BAB IX PENDAPATAN REGIONAL/
REGIONAL INCOME 333
Daftar Tabel Table Content
Pidie Dalam Angka 2014
Pidie in Figures 2014 xvii
DAFTAR TABEL/Table Content
Tabel 1.1 Luas Kabupaten Pidie menurut Kecamatan, Tahun 2013
2 Table 1.1 Land Area of Pidie District by Sub District, 2013
Tabel 1.2 Perkembangan Curah Hujan dan Hari Hujan menurut Bulan di Kabupaten Pidie, Tahun 2008-2013
3 Table 1.2 The Growth of Rain Falls and Rain Days per Month in
Pidie District, 2008-2013
Tabel 1.3 Jarak Tempuh dari Ibukota Kecamatan ke Ibukota Pidie dan Ibukota Propinsi Aceh, Tahun 2013
4 Table 1.3 The Distance from Capital of Sub District to Capital
of District and Capital of Aceh Province,2013
Tabel 1.4 Luas dan Penggunaan Lahan di Kabupaten Pidie, Tahun 2013
5 Table 1.4 Area and Utilizing Land in Pidie District, 2013
Tabel 2.1 Nama Ibukota Kecamatan, Banyaknya Kemukiman, Gampong dan Kelurahan di Kabupaten Pidie, Tahun 2013
7
Table 2.1 Name of Sub District Capital, Number of Kemukiman, Village and Kelurahan in Pidie District, 2013
Tabel 2.2 Nama-nama Desa/Gampong menurut Kecamatan di Kabupaten Pidie, Tahun 2013
8 Table 2.2 Names of Village by Sub District in Pidie District,
2013
Tabel 2.3 Jumlah Pegawai Negeri Sipil per Unit Kerja menurut Golongan Ruang di Lingkungan Pemerintahan Kabupaten Pidie, Tahun 2013
38
Table 2.3 Number of Civilian Employee by Work Unit by Class in Pidie District Goverment, 2013
Tabel 2.4 Kategori Pengembangan LKMD di Kabupaten Pidie, Tahun 2013
40 Table 2.4 Category of LKMD Development in Pidie District,
2013
Daftar Tabel Table Content
Pidie Dalam Angka 2014 Pidie in Figures 2014
xviii
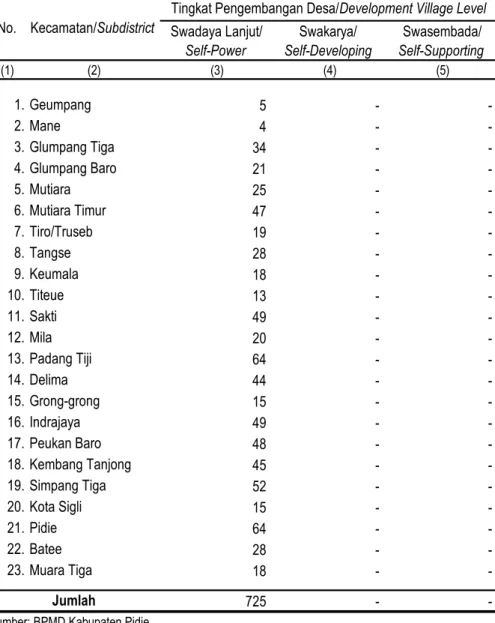
Tabel 2.5 Tingkat Pengembangan Desa/Gampong di Kabupaten Pidie, Tahun 2013
41 Table 2.5 Development Village Level in Pidie District, 2013
Tabel 2.6 Nama Kecamatan, Mukim dan Imum Mukim di Kabupaten Pidie, Tahun 2013
42 Table 2.6 Name of Subdistrict, Mukim, and Imum in Pidie
District, 2013
Tabel 2.7 Nama-nama Anggota Dewan Perwakilan Rakyat Daerah Kabupaten Pidie menurut Fraksi dan Jabatan Tahun 2009-2014
47
Table 2.7 Members of Pidie District’s House of Representative by Faction Pidie District, 2009-2014
Tabel 2.8 Nama-nama Anggota Dewan Perwakilan Rakyat Daerah Kabupaten Pidie menurut Komisi dan Jabatan Tahun 2009-2014
49
Table 2.8 Members of Pidie District’s House of Representative by Faction Pidie District, 2009-2014
Tabel 2.9 Nama-nama Anggota Dewan Perwakilan Rakyat Daerah Kabupaten Pidie menurut Panitia Anggaran Tahun 2009-2014
51
Table 2.9 Members of Pidie District’s House of Representative by Faction Pidie District, 2009-2014
Tabel 2.10 Nama-nama Anggota Dewan Perwakilan Rakyat Daerah Kabupaten Pidie Menurut Panitia Legislasi Tahun 2009-2014
52
Table 2.10 Members of Pidie District’s House of Representative by Faction Pidie District, 2009-2014
Tabel 2.11 Nama-nama Anggota Dewan Perwakilan Rakyat Daerah Kabupaten Pidie Menurut Panitia Musyawarah Tahun 2009-2014
53
Table 2.11 Members of Pidie District’s House of Representative by Faction Pidie District, 2009-2014
Tabel 2.12 Nama-nama Pengurus Badan Kehormatan Dewan Perwakilan Rakyat Daerah Kabupaten Pidie, Tahun 2009-2014
54
Daftar Tabel Table Content
Pidie Dalam Angka 2014
Pidie in Figures 2014 xix
Table 2.12 Members of Pidie District’s House of Representative by Faction Pidie District, 2009-2014
Tabel 2.13 Nama-nama Bupati Pidie menurut Masa Jabatan 55 Table 2.13 Names of Regent of Pidie by Period
Tabel 3.1 Jumlah Penduduk Dirinci menurut Jenis Kelamin dan Seks Rasio di Kabupaten Pidie, Tahun 2013
57 Table 3.1 Number of People by Sex and Sex Ratio in Pidie
District, 2013
Tabel 3.2 Jumlah Desa, Luas Wilayah,, Jumlah Penduduk dan Kepadatan Penduduk per Desa serta per Km2 di Kabupaten Pidie, Tahun 2013
58
Table
Table 3.2
3.2 Number of Village, Land Area, Number of People and People Density by Village and by Km2 in Pidie District, 2013
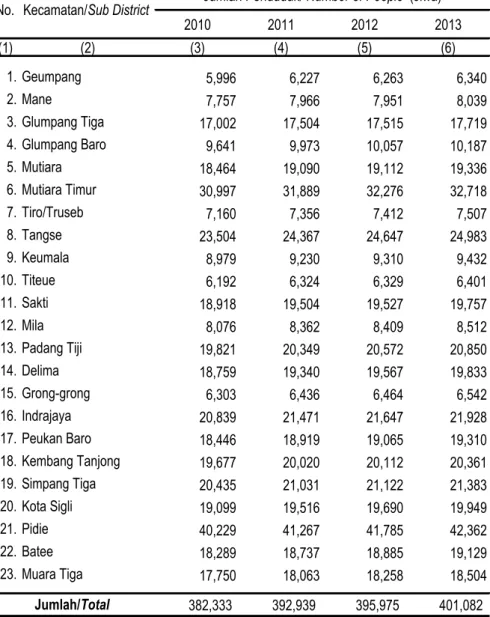
Tabel 3.3 Jumlah Penduduk Akhir Tahun Kabupaten Pidie per Kecamatan, Tahun 2009-2013
59 Table 3.3 Number People by Sub District in Pidie District,
2009-2013
Tabel 3.4 Pertumbuhan Penduduk Kabupaten Pidie per Kecamatan, Tahun 2009-2013
60 Table 3.4 Number People Growth by Sub District in Pidie
District, 2009-2013
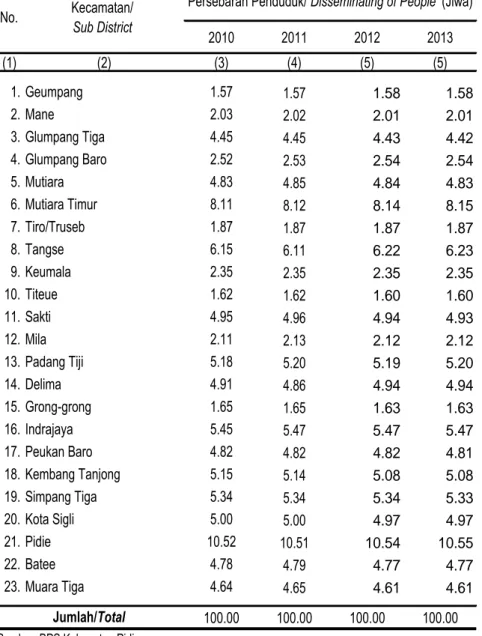
Tabel 3.5 Persebaran Penduduk Kabupaten Pidie per Kecamatan, Tahun 2009-2013
61 Table 3.5 Number People Growth by Sub District in Pidie
District, 2009-2013
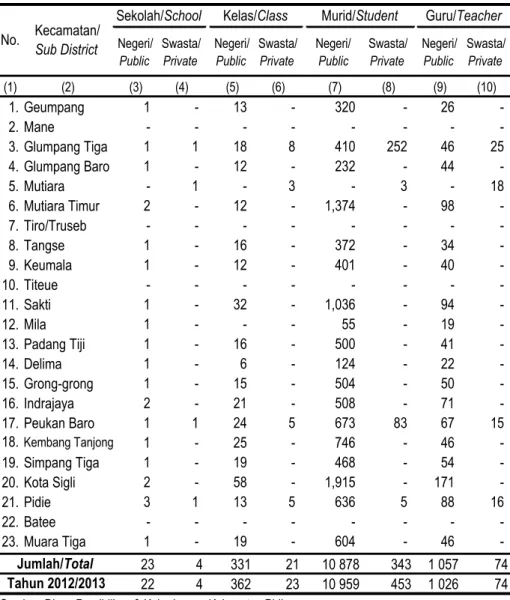
Tabel 4.1 Jumlah Sekolah, Kelas, Murid, dan Guru pada Taman Kanak-Kanak Negeri dan Swasta per Kecamatan di Kabupaten Pidie, Tahun 2013/2014
63
Table 4.1 Number of School, Class, Student and Teacher at
Private and Public Kindergarten by Sub District in
Pidie District, 2013/2014
Daftar Tabel Table Content
Pidie Dalam Angka 2014 Pidie in Figures 2014
xx
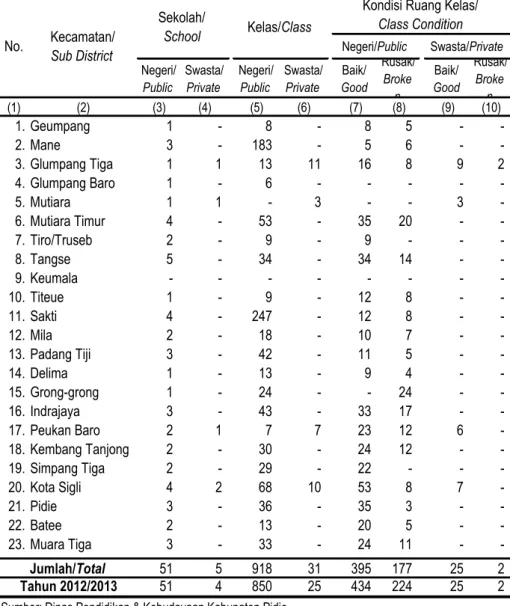
Tabel 4.2 Jumlah Sekolah, Kelas, dan Kondisi Ruang Kelas pada Taman Kanak-Kanak Negeri dan Swasta per Kecamatan di Kabupaten Pidie, Tahun 2013/2014
64
Table 4.2 Number of School, Class, and Class Condition at Private and Public Kindergarten by Sub District in Pidie District, 2013/2014
Tabel 4.3 Jumlah Sekolah, Kelas, Murid, dan Guru pada
Sekolah Dasar Negeri dan Swasta per Kecamatan di Kabupaten Pidie, Tahun 2013/2014
65
Table 4.3 Number of School, Class, Student and Teacher at Private and Public Junior School by Sub District in Pidie District, 2013/2014
Tabel 4.4 Jumlah Sekolah, Kelas, dan Kondisi Ruang Kelas pada Sekolah Dasar Negeri dan Swasta per Kecamatan di Kabupaten Pidie, Tahun 2013/2014
66
Table 4.4 Number of School, Class, and Class Condition at Private and Public Junior School by Sub District in Pidie District, 2013/2014
Tabel 4.5 Jumlah Murid Sekolah Dasar Dirinci menurut Kelas per Kecamatan di Kabupaten Pidie, Tahun 2013/2014
67 Table 4.5 Number of Student of Junior School according to
Class by Sub District in Pidie District, 2013/2014
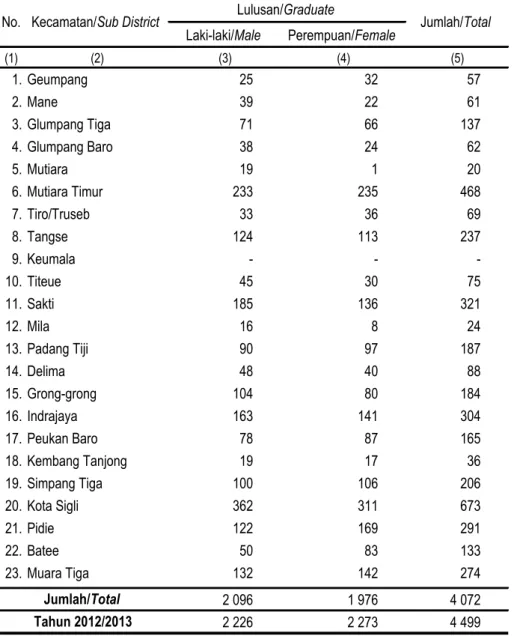
Tabel 4.6 Jumlah Lulusan Sekolah Dasar menurut Kecamatan dan Jenis Kelamin di Kabupaten Pidie, Tahun 2013/2014
68
Table 4.6 Number of Graduate Student of Junior School by Sub District and Sex in Pidie District, 2013/2014
Tabel 4.7 Jumlah Siswa Sekolah Dasar yang Putus Sekolah menurut Jenis Kelamin dan Kecamatan di Kabupaten Pidie, Tahun 2013/2014
69
Table 4.7 Number of Drop Out Student of Junior School by Sub District and Sex in Pidie District, 2013/2014
Tabel 4.8 Jumlah Kepala Sekolah, Penjaga Sekolah, dan Guru SD Negeri/Swasta menurut Bidang Studi per Kecamatan di Kabupaten Pidie, Tahun 2013/2014
70
Daftar Tabel Table Content
Pidie Dalam Angka 2014
Pidie in Figures 2014 xxi
Table 4.8 Number of Head Master, School Keeping, and Teacher at Private and Public Junior School by Major and Sub District in Pidie District, 2013/2014
Tabel 4.9 Jumlah Sekolah, Rombongan Belajar, Murid, dan
Guru SLTP Negeri dan Swasta per Kecamatan di Kabupaten Pidie, Tahun 2013/2014
71
Table 4.9 Number of School, Class, Student and Teacher at Private and Public Second School by Sub District in Pidie District, 2013/2014
Tabel 4.10 Jumlah Sekolah, Kelas, dan Kondisi Ruang Kelas pada SLTP Negeri dan Swasta per Kecamatan di Kabupaten Pidie, Tahun 2013/2014
72
Table 4.10 Number of School, Class, and Class Condition at Private and Public Second School by Sub District in Pidie District, 2013/2014
Tabel 4.11 Jumlah Guru SLTP Dirinci menurut Golongan dan Status per Kecamatan di Kabupaten Pidie, Tahun 2013/2014
73
Table 4.11 Number of Second School Teacher according to Type and Status at by Sub District in Pidie District, 2013/2014
Tabel 4.12 Jumlah Lulusan SLTP menurut Kecamatan dan Jenis Kelamin di Kabupaten Pidie, Tahun 2013/2014
74 Table 4.12 Number of Second School Graduate by Sub District
and Sex in Pidie District, 2013/2014
Tabel 4.13 Jumlah Siswa SLTP yang Putus Sekolah menurut Jenis Kelamin dan Kecamatan di Kabupaten Pidie, Tahun 2013/2014
75
Table 4.13 Number of Second School Drop Out by Sub District and Sex in Pidie, 2013/2014
Tabel 4.14 Jumlah Kepala Sekolah, Penjaga Sekolah, dan Guru SLTP Negeri/Swasta menurut Bidang Studi per Kecamatan di Kabupaten Pidie, Tahun 2013/2014
76
Daftar Tabel Table Content
Pidie Dalam Angka 2014 Pidie in Figures 2014
xxii
Table 4.14 Number of Head Master, School Keeper and Second School Teacher according to Majors by Sub district in Pidie District, 2013/2014
Tabel 4.15 Jumlah Sekolah, Rombongan Belajar, Murid, dan
Guru SMU Negeri dan Swasta per Kecamatan di Kabupaten Pidie, Tahun 2013/2014
78
Table 4.15 Number of School, Class, Student and Teacher at Private and Public High School by Sub District in Pidie District, 2013/2014
Tabel 4.16 Jumlah Sekolah, Kelas, dan Kondisi Ruang Kelas pada SMU Negeri dan Swasta per Kecamatan di Kabupaten Pidie, Tahun 2013/2014
79
Table 4.16 Number of School, Class, and Class Condition at Private and Public High School by Sub District in Pidie, 2013/2014
Tabel 4.17 Jumlah Sekolah, Kelas, Siswa, dan Guru Sekolah Menengah Kejuruan menurut Kecamatan di Kabupaten Pidie, Tahun 2013/2014
80
Table 4.17 Number of School, Class, and Teacher Vocational School by Sub District in Pidie District, 2013/2014
Tabel 4.18 Jumlah Lulusan SLTA menurut Jenis Peminatan,
Jenis Kelamin dan Kecamatan di Kabupaten Pidie, Tahun 2013/2014
81
Table 4.18 Number of High School Graduate by Majors, Sub District and Sex in Pidie District, 2013/2014
Tabel 4.19 Jumlah Siswa SLTA yang Putus Sekolah menurut Jenis Peminatan, Jenis Kelamin, dan Kecamatan di Kabupaten Pidie, Tahun 2013/2014
82
Table 4.19 Number of High School Drop Out by Interest, Sub District and Sex in Pidie District, 2013/2014
Tabel 4.20 Ketersediaan Fasilitas Sekolah Menengah Umum (SMU) menurut Kecamatan di Kabupaten Pidie, Tahun 2013/2014
83
Daftar Tabel Table Content
Pidie Dalam Angka 2014
Pidie in Figures 2014 xxiii
Table 4.20 Availibility of Facility of Public High School by Sub District in Pidie District, 2013/2014
Tabel 4.21 Ketersediaan Fasilitas Sekolah Menengah Kejuruan (SMK) menurut Kecamatan di Kabupaten Pidie, Tahun 2013/2014
84
Table 4.21 Availibility of Facility of Public Vocational School by Sub District in Pidie District, 2013/2014
Tabel 4.22 Jumlah Kepala Sekolah, Penjaga Sekolah, dan Guru SMU Negeri/Swasta menurut Bidang Studi per Kecamatan di Kabupaten Pidie, tahun 2013/2014
85
Table 4.22 Number of Head Master, School Keeper and High School Teacher according to Majors by Sub District in Pidie District, 2013/2014
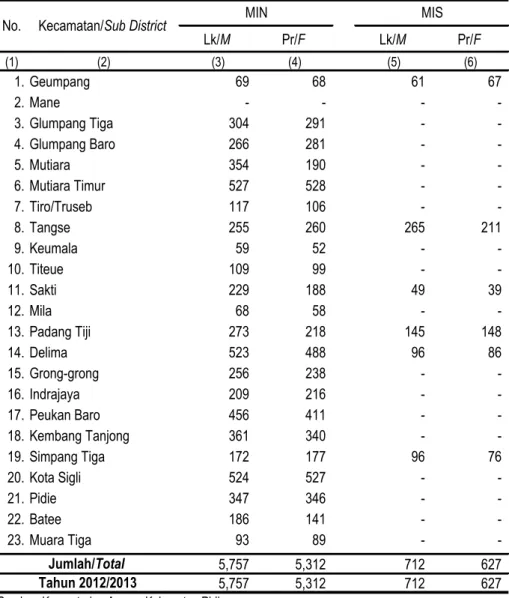
Tabel 4.23 Jumlah Sekolah di Bawah Departemen Agama Kabupaten Pidie per Kecamatan, Tahun Akademik 2013/2014
90
Table 4.23 Number of Garaduate Student of Pidie Government Nursery Academy by Majors and Sex in Pidie District, 2013/2014
Tabel 4.24 Kondisi Ruang Sekolah yang Berada di Bawah Departemen Agama Kabupaten Pidie Dirinci menurut Sekolah per Kecamatan, Tahun Akademik 2013/2014
91
Table 4.24 Condition of School Room below Religion Department of Pidie District according to School by Sub District, 2013/2014
Tabel 4.25 Jumlah Murid Sekolah di Bawah Departemen Agama Kabupaten Pidie Dirinci menurut Sekolah dan Jenis Kelamin per Kecamatan, Tahun Akademik 2013/2014
94
Table 4.25 Number of Student below Religion Department of Pidie District according to School and Sex by Sub District, 2013/2014
Tabel 4.26 Jumlah Lulusan Madrasah Ibtidaiyah menurut Kecamatan dan Jenis Kelamin di Kabupaten Pidie, Tahun Akademik 2013/2014
97
Daftar Tabel Table Content
Pidie Dalam Angka 2014 Pidie in Figures 2014
xxiv
Table 4.26 Number of Graduate Student of Madrasah Ibtidaiyah by Sub District and Sex in Pidie District, 2013/2014
Tabel 4.27 Jumlah Murid Madrasah Ibtidaiyah yang Putus Sekolah menurut Kecamatan dan Jenis Kelamin di Kabupaten Pidie, Tahun Akademik 2013/2014
99
Table 4.27 Number of Drop Out Student of Madrasah Ibtidaiyah by Sub District and Sex in Pidie District, 2013/2014
Tabel 4.28 Jumlah Lulusan Madrasah Tsanawiyah menurut Kecamatan dan Jenis Kelamin di Kabupaten Pidie, Tahun Akademik 2013/2014
101
Table 4.28 Number of Graduate Student of Madrasah Tsanawiyah by Sub District and Sex in Pidie District, 2013/2014
Tabel 4.29 Jumlah Murid Madrasah Tsanawiyah yang Putus Sekolah menurut Kecamatan dan Jenis Kelamin di Kabupaten Pidie, Tahun Akademik 2013/2014
103
Table 4.29 Number of Drop Out Student of Madrasah Tsanawiyah by Sub District and Sex in Pidie District, 2013/2014
Tabel 4.30 Jumlah Lulusan Madrasah Aliyah menurut Kecamatan dan Jenis Kelamin di Kabupaten Pidie, Tahun Akademik 2013/2014
105
Table 4.30 Number of Graduate Student of Madrasah Aliyah by Sub District and Sex in Pidie District, 2013/2014
Tabel 4.31 Jumlah Siswa Madrasah Aliyah yang Putus Sekolah menurut Kecamatan dan Jenis Kelamin di Kabupaten Pidie, Tahun Akademik 2013/2014
107
Table 4.31 Number of Drop Out Student of Madrasah Aliyah by Sub District and Sex in Pidie District, 2013/2014
Tabel 4.32 Jumlah Guru PNS Sekolah di Bawah Departemen Agama Kabupaten Pidie Dirinci menurut Sekolah per Kecamatan, Tahun 2013
109
Table 4.32 Number of Public Worker Teacher below Religion
Depertment of Pidie District by School and Sub
District, 2013
Daftar Tabel Table Content
Pidie Dalam Angka 2014
Pidie in Figures 2014 xxv
Tabel 4.33 Banyaknya Sarana Pendidikan Agama menurut Kecamatan di Kabupaten Pidie, Tahun 2013
110 Table 4.33 Number of Religion Education Infrastructure by Sub
District in Pidie District, 2013
Tabel 4.34 Jumlah Pondok Pesantren menurut Kecamatan dan Jenis Pesantren di Kabupaten Pidie, Tahun 2013
111 Table 4.34 Number of Pesantren by Type of Pesantren in Pidie
District, 2013
Tabel 4.35 Jumlah Pesantren, Santri, dan Teungku menurut Kecamatan di Kabupaten Pidie, Tahun 2013
112 Table 4.35 Number of Pesantren, Student and Teungku by Sub
District in Pidie District, 2013
Tabel 4.36 Jumlah Jemaah Haji menurut Kecamatan dan Jenis Kelamin di Kabupaten Pidie, Tahun 2010 - 2013
113 Table 4.36 Number of Haji by Sub District and Sex in Pidie
District, 2010-2013
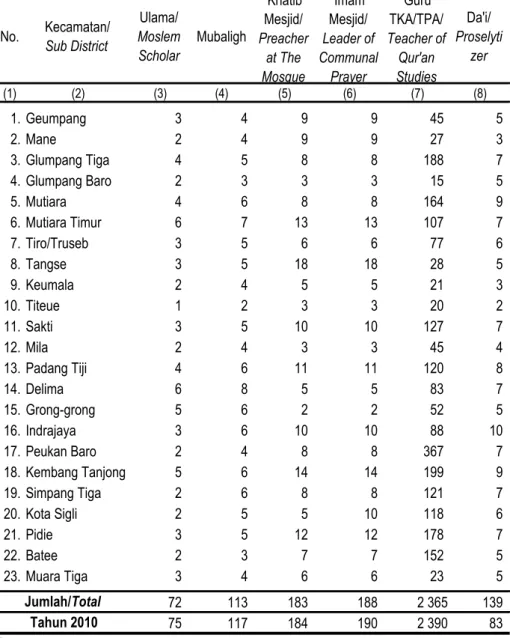
Tabel 4.37 Jumlah Fungsionaris Agama Islam menurut Kecamatan di Kabupaten Pidie, Tahun 2013
114 Table 4.37 Number of Islam Official by Sub District in Pidie
District, 2013
Tabel 4.38 Jumlah Tanah Wakaf menurut Kecamatan dan Jenis Perwakafan di Kabupaten Pidie, Tahun 2013
115 Table 4.38 Number of Land of Wakaf by Sub District and Type in
Pidie District, 2013
Tabel 4.39 Jumlah Zakat yang Dikoordinir oleh Departemen Agama menurut Kecamatan di Kabupaten Pidie, Tahun 2013
116
Table 4.39 Number of Coordinate Zakat by Sub District in Pidie District, 2013
Tabel 4.40 Jumlah Tempat Ibadah menurut Jenis Agama per Kecamatan di Kabupaten Pidie, Tahun 2013
117 Table 4.40 Number of Religios Service Place by Sub District in
Pidie District, 2013
Daftar Tabel Table Content
Pidie Dalam Angka 2014 Pidie in Figures 2014
xxvi
Tabel 4.41 Jumlah Perkara yang Diterima menurut Jenis perkara pada Mahkamah Syariah di Kabupaten Pidie, Tahun 2013
118
Table 4.41 Number of Case Accepted at Syariah Court by Religion and Sub District in Pidie District, 2013
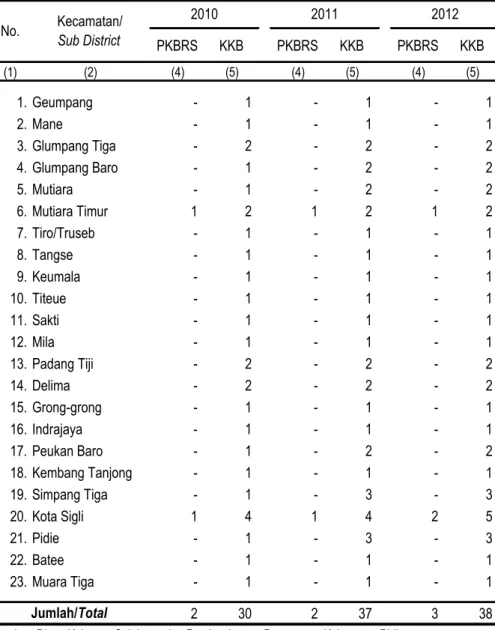
Tabel 4.42 Perkembangan PKBRS dan KKB menurut Kecamatan di Kabupaten Pidie, Tahun 2009-2013
124 Table 4.42 Growth of PKBRS and KKB by Sub District in Pidie
District, 2009-2013
Tabel 4.43 Jumlah Pos KBG dan Jumlah Akseptor menurut Kecamatan di Kabupaten Pidie, Tahun 2013
125 Table 4.43 Number of KBG Pos and Acceptor by Sub District in
Pidie District, 2013
Tabel 4.44 Target dan Realisasi Akseptor Baru dan Current Ussers (CU) dari Jumlah PUS di Kabupaten Pidie, Tahun 2013
126
Table 4.44 Number of KGB Pos and Acceptor by Sub District in Pidie District, 2013
Tabel 4.45 Jumlah Akseptor Baru per Metode Kontrasepsi menurut Kecamatan di Kabupaten Pidie, Tahun 2013
128 Table 4.45 Number of New Acceptor according to Contracepcion
Method by Sub District in Pidie District, 2013
Tabel 4.46 Jumlah Peserta KB Baru dan Peserta KB Aktif menurut Kecamatan di Kabupaten Pidie, Tahun 2013
129 Table 4.46 Number of New Contraception User And Active
Contraception User by Sub District in Pidie District, 2013
Tabel 4.47 Jumlah Puskesmas dan Balai Pengobatan Dirinci per Kecamatan di Kabupaten Pidie, Tahun 2013
130 Table 4.47 Number of Local Clinic Clinical Center by Sub
District in Pidie District, 2013
Tabel 4.48 Jumlah Ibu Hamil yang Mendapat Tenaga Kesehatan per Kecamatan di Kabupaten Pidie, Tahun 2013
132
Daftar Tabel Table Content
Pidie Dalam Angka 2014
Pidie in Figures 2014 xxvii
Table 4.48 Number of Pregnancy Woman which Get Health Care by Sub District in Pidie District, 2013
Tabel 4.49 Perkiraan Jumlah Persalinan dan Jumlah yang Ditolong oleh Tenaga Kesehatan per Kecamatan di Kabupaten Pidie, Tahun 2013
133
Table 4.49 Estimate Number of Child Bearing and Helped by Medical Personel by Sub District in Pidie District, 2013
Tabel 4.50 Jumlah Bayi yang Telah Diimunisasi Lengkap (Berdasarkan Cakupan Campak) menurut Puskesmas di Kabupaten Pidie, Tahun 2013
134
Table 4.50 Number of Complete Immunized Baby (according to Throw) Local Clnic in Pidie District, 2013
Tabel 4.51 Jumlah Siswa yang Mengikuti Cakupan Bulan Imunisasi Anak Sekolah menurut Kecamatan di Kabupaten Pidie, Tahun 2013
135
Table 4.51 Number of Student Following Coverage of Month Immunize Schoolchild by Sub District in Pidie District, 2013
Tabel 4.52 Jumlah Penduduk yang Mendapat Imunisasi menurut Jenis Imunisasi Pada Puskesmas per Kecamatan di Kabupaten Pidie, Tahun 2013
136
Table 4.52 Number of Resident which Get to Immunize according to Type of Immunized at Local Clinic by Sub District in Pidie District, 2013
Tabel 4.53 Kasus Penyakit Menular yang Diamati menurut Kecamatan di Kabupaten Pidie, Tahun 2013
137 Table 4.53 Number of Perceived Infect Disease Case by Sub
District in Pidie District, 2013
Tabel 4.54 Jumlah Tenaga Kesehatan Dirinci menurut Kecamatan di Kabupaten Pidie, Tahun 2013
141 Table 4.54 Number of Medical Personel by Sub District in Pidie
District, 2013
Daftar Tabel Table Content
Pidie Dalam Angka 2014 Pidie in Figures 2014
xxviii
Tabel 4.55 Jumlah Tenaga Medis menurut Jenis Kegiatan dan Status Pada Rumah Sakit Umum Sigli, di Kabupaten Pidie, Tahun 2013
142
Table 4.55 Number of Medical Personel by Activity and Status in Sigli Central Hospital in Pidie District, 2013
Tabel 4.56 Kegiatan Rawat Inap pada Rumah Sakit Umum Sigli, di Kabupaten Pidie, Tahun 2013
146 Table 4.56 Lodging Take Care in Sigli Central Hospital in Pidie
District, 2013
Tabel 4.57 Kegiatan Kebidanan dan Perinatologi pada Rumah Sakit Umum Sigli Kabupaten Pidie, Tahun 2013
147 Table 4.57 Midwiferyin and Perinatology in Sigli Central
Hospital in Pidie District, 2013
Tabel 4.58 Kegiatan Pembedahan menurut Spesialisasi dan Jenis Operasi pada Rumah Sakit Umum Sigli di Kabupaten Pidie, Tahun 2013
148
Table 4.58 Surgery Activityby Specialization and Type of Surgery in Sigli Central Hospital in Pidie District, 2013
Tabel 4.59 Jumlah Terdakwa Berdasarkan Jenis Kelamin di Kabupaten Pidie, Tahun 2013
149 Table 4.59 Number of Defendant by Sex in Pidie District, 2013
Tabel 4.60 Jumlah Terdakwa Berdasarkan Kelompok Umur di Kabupaten Pidie, Tahun 2013
150 Table 4.60 Number of Defendant by Age Group in Pidie District,
2013
Tabel 4.61 Jumlah Terdakwa per Bulan menurut Perkara Diputuskan Pengadilan Negeri Kabupaten Pidie, Tahun 2013
151
Table 4.61 Number of Defendant per Month according to Decided Case by The Court of Pidie District, 2013 Tabel 4.62 Jumlah Terdakwa per Bulan dengan Perkara
Diselesaikan Pengadilan Negeri Kabupaten Pidie, Tahun 2013
153
Daftar Tabel Table Content
Pidie Dalam Angka 2014
Pidie in Figures 2014 xxix
Table 4.62 Number of Defendant per Month with Finished Case by The Court of Pidie District, 2013
Tabel 4.63 Jumlah Perkara Pidana per Bulan Diselesaikan Kejaksaan Negeri di Kabupaten Pidie, Tahun 2013
154 Table 4.63 Number of Defendant per Month with Finished by The
Judiciary State of Pidie District, 2013
Tabel 4.64 Jumlah Tambahan Tahanan Kejaksaan Negeri di Kabupaten Pidie, Tahun 2013
155 Table 4.64 Number of Additional Prisoner of The Judiciary State
of Pidie District, 2013
Tabel 4.65 Banyaknya Tindakan Kriminalitas menurut Kecamatan dan Jenis Kasus di Kabupaten Pidie, Tahun 2013
156
Table 4.65 Number of Criminality by Sub District and Case Type in Pidie District, 2013
Tabel 4.66 Banyak Banyaknya Tindakan Kriminalitas menurut Bulan dan Jenis Kasus di Kabupaten Pidie, Tahun 2013
161
Table 4.66 Number of Criminality by Sub District and Case Type in Pidie District, 2013
Tabel 4.67 Jumlah Perkara Pelanggaran di Kabupaten Pidie, Tahun 2013
166 Table 4.67 Number of Infraction Case in Pidie District, 2013
Tabel 4.68 Jumlah Pengelolaan Perkara Pelanggaran di Kabupaten Pidie, Tahun 2013
167 Table 4.68 Number of Infraction Case Management in Pidie
District, 2013
Tabel 4.69 Jumlah Kecelakaan menurut Bulan dan Jenis Kecelakaan di Kabupaten Pidie, Tahun 2013
168 Table 4.69 Number of Accident by Month and Type of Accident
in Pidie District, 2013
Tabel 4.70 Jumlah Korban Kecelakaan menurut Bulan dan Jenis Korban di Kabupaten Pidie, Tahun 2013
169
Daftar Tabel Table Content
Pidie Dalam Angka 2014 Pidie in Figures 2014
xxx
Table 4.70 Number of Accident Victim by Month and Type of Accident in Pidie District, 2013
Tabel 4.71 Jumlah Kejadian Bencana Alam dan Korban menurut Jenis Bencana di Kabupaten Pidie, Tahun 2013
170 Table 4.71 Number of Natural Disaster and Victim by Type of
Disaster in Pidie District, 2013
Tabel 4.72 Daftar Panti Asuhan Dirinci menurut Lokasi dan Anak Asuh di Kabupaten Pidie, Tahun 2013
171 Table 4.72 List of Reformatory according to Location and Child
Take Care in Pidie District, 2013
Tabel 4.73 Jumlah Penyandang Masalah Kesejahteraan Sosial di Kabupaten Pidie, Tahun 2013
174 Table 4.73 Number of Problem of Social Prosperity Person
in Pidie District, 2013
Tabel 4.74 Jumlah Kelompok Karang Taruna Dirinci menurut Kecamatan di Kabupaten Pidie, Tahun 2013
178 Table 4.74 Number of young Group by Sub District in Pidie
District, 2013
Tabel 4.75 Jumlah Penderita Cacat Dirinci menurut Kecamatan di Kabupaten Pidie, Tahun 2013
179
Table 4.75 Number Physical Defect Person by Sub District in Pidie District, 2013
Tabel 4.76 Jumlah Penghuni Rutan Kelas II B Sigli di Kabupaten Pidie, Tahun 2013
180 Table 4.76 Number of Prisoner in Prison of Sigli in Pidie District,
2013
Tabel 4.77 Jumlah Pemilih Tetap Dirinci menurut Kecamatan di Kabupaten Pidie, pada Pemilihan Gubernur-Wakil Gubernur dan Bupati-Wakil Bupati
182
Table 4.77 Number of Elector by Sex and Sub District in Pidie District at Governor Election, 2004-2013
Tabel 4.78 Jumlah Pemilih Tetap Dirinci menurut Jenis Kelamin dan Kecamatan di Kabupaten Pidie, pada Pemilihan Presiden-Wakil Presiden RI Periode 2004-2013
183
Daftar Tabel Table Content
Pidie Dalam Angka 2014
Pidie in Figures 2014 xxxi
Table 4.78 Number of Elector by Sex and Sub District in Pidie District at President Election, 2004-2013
Tabel 5.1 Luas Tanam, Luas Panen, dan Rata-Rata Produksi per Hektar Padi Sawah menurut Kecamatan di Kabupaten Pidie, Tahun 2013
185
Table 5.1 Plant Area, Harvest and Production Average by Paddy Field Hectare by Subdistrict in Pidie District, 2013
Tabel 5.2 Luas Tanam, Luas Panen, dan Rata-Rata Produksi per Hektar Padi Ladang menurut Kecamatan di Kabupaten Pidie, Tahun 2013
186
Table 5.2 Plant Area, Harvest Area and Production Average by Paddy Farm Hectare by Subdistrict in Pidie District, 2013
Tabel 5.3 Luas Tanam, Luas Panen, dan Rata-Rata Produksi Per Hektar Padi Sawah dan Padi Ladang menurut Kecamatan di Kabupaten Pidie, Tahun 2013
187
Table 5.3 Plant Area, Harvest Area and Production Average by Paddy Plant and Farm Hectare by Subdistrict in Pidie District, 2013
Tabel 5.4 Luas Tanam, Luas Panen, dan Produksi Tanaman Kacang Tanah menurut Kecamatan di Kabupaten Pidie, Tahun 2013
188
Table 5.4 Plant Area, Harvest Area and Production of Peanut by Subdistrict in Pidie District, 2013
Tabel 5.5 Luas Tanam, Luas Panen, dan Produksi Tanaman Kacang Hijau menurut Kecamatan di Kabupaten Pidie, Tahun 2013
189
Table 5.5 Plant Area, Harvest Area and Production of Green Peanut by Subdistrict in Pidie District, 2013
Tabel 5.6 Luas Tanam, Luas Panen, dan Produksi Tanaman Kacang Kedelai menurut Kecamatan di Kabupaten Pidie, Tahun 2013
190
Table 5.6 Plant Area, Harvest Area and Production of Soybean
by Subdistrict in Pidie District, 2013
Daftar Tabel Table Content
Pidie Dalam Angka 2014 Pidie in Figures 2014
xxxii
Tabel 5.7 Luas Tanam, Luas Panen, dan Produksi Tanaman Jagung menurut Kecamatan di Kabupaten Pidie, Tahun 2013
191
Table 5.7 Plant Area, Harvest Area and Production of Corn by Subdistrict in Pidie District, 2013
Tabel 5.8 Luas Tanam, Luas Panen, dan Produksi Tanaman Ubi Kayu menurut Kecamatan di Kabupaten Pidie, Tahun 2013
192
Table 5.8 Plant Area, Harvest Area and Production of Kaspe Cassava by Subdistrict in Pidie District, 2013
Tabel 5.9 Luas Tanam, Luas Panen, dan Produksi Tanaman Ubi Jalar menurut Kecamatan di Kabupaten Pidie, Tahun 2013
193
Table 5.9 Plant Area, Harvest Area and Production of Jawa Sweet Potato by Subdistrict in Pidie District, 2013
Tabel 5.10 Luas Tanam, Luas Panen, dan Produksi Tanaman Kacang Merah menurut Kecamatan di Kabupaten Pidie, Tahun 2013
194
Table 5.10 Plant Area, Harvest Area and Production of Kidney Beans by Subdistrict in Pidie District, 2013
Tabel 5.11 Luas Tanam, Luas Panen, dan Produksi Tanaman Cabe Merah menurut Kecamatan di Kabupaten Pidie, Tahun 2013
195
Table 5.11 Plant Area, Harvest Area and Production of Chili by Subdistrict in Pidie District, 2013
Tabel 5.12 Luas Tanam, Luas Panen, dan Produksi Tanaman Bawang Merah menurut Kecamatan di Kabupaten Pidie, Tahun 2013
196
Table 5.12 Plant Area, Harvest Area and Production of Onion by Subdistrict in Pidie District, 2013
Tabel 5.13 Luas Tanam, Luas Panen, dan Produksi Tanaman Bawang Putih menurut Kecamatan di Kabupaten Pidie, Tahun 2013
197
Daftar Tabel Table Content
Pidie Dalam Angka 2014
Pidie in Figures 2014 xxxiii
Table 5.13 Plant Area, Harvest Area and Production of Garlic by Subdistrict in Pidie District, 2013
Tabel 5.14 Luas Tanam, Luas Panen, dan Produksi Tanaman bwang Daun menurut Kecamatan di Kabupaten Pidie, Tahun 2013
198
Table 5.14 Plant Area, Harvest Area and Production of Scallion by Subdistrict in Pidie District, 2013
Tabel 5.15 Luas Tanam, Luas Panen, dan Produksi Tanaman Kubis/Kol menurut Kecamatan di Kabupaten Pidie, Tahun 2013
199
Table 5.15 Plant Area, Harvest Area and Production of Cabbage by Subdistrict in Pidie District, 2013
Tabel 5.16 Luas Tanam, Luas Panen, dan Produksi Tanaman Wortel menurut Kecamatan di Kabupaten Pidie, Tahun 2013
200
Table 5.16 Plant Area, Harvest Area and Production of Leavy Carrot by Subdistrict in Pidie District, 2013
Tabel 5.17 Luas Tanam, Luas Panen, dan Produksi Tanaman Buncis menurut Kecamatan di Kabupaten Pidie, Tahun 2013
201
Table 5.17 Plant Area, Harvest Area and Production of Green Bean by Subdistrict in Pidie District, 2013
Tabel 5.18 Luas Tanam, Luas Panen, dan Produksi Tanaman Kembang Kol menurut Kecamatan di Kabupaten Pidie, Tahun 2013
202
Table 5.18 Plant Area, Harvest Area and Production of Cauliflower by Subdistrict in Pidie District, 2013
Tabel 5.19 Luas Tanam, Luas Panen, dan Produksi Tanaman Tomat menurut Kecamatan di Kabupaten Pidie, Tahun 2013
203
Table 5.19 Plant Area, Harvest Area and Production of Tomato
by Subdistrict in Pidie District, 2013
Daftar Tabel Table Content
Pidie Dalam Angka 2014 Pidie in Figures 2014
xxxiv
Tabel 5.20 Luas Tanam, Luas Panen, dan Produksi Tanaman Kacang Panjang menurut Kecamatan di Kabupaten Pidie, Tahun 2013
204
Table 5.20 Plant Area, Harvest Area and Production of String Bean by Subdistrict in Pidie District, 2013
Tabel 5.21 Luas Tanam, Luas Panen, dan Produksi Tanaman Terong menurut Kecamatan di Kabupaten Pidie, Tahun 2013
205
Table 5.21 Plant Area, Harvest Area and Production of Eggplant by Subdistrict in Pidie District, 2013
Tabel 5.22 Luas Tanam, Luas Panen, dan Produksi Tanaman Bayam menurut Kecamatan di Kabupaten Pidie, Tahun 2013
206
Table 5.22 Plant Area, Harvest Area and Production of Spinach by Subdistrict in Pidie District, 2013
Tabel 5.23 Luas Tanam, Luas Panen, dan Produksi Tanaman Kangkung menurut Kecamatan di Kabupaten Pidie, Tahun 2013
207
Table 5.23 Plant Area, Harvest Area and Production of Leavy Vegetable by Subdistrict in Pidie District, 2013
Tabel 5.24 Luas Tanam, Luas Panen, dan Produksi Tanaman Mentimun menurut Kecamatan di Kabupaten Pidie, Tahun 2013
208
Table 5.24 Plant Area, Harvest Area and Production of Cucumber by Subdistrict in Pidie District, 2013
Tabel 5.25 Luas Tanam, Luas Panen, dan Produksi Tanaman Melon menurut Kecamatan di Kabupaten Pidie, Tahun 2013
209
Table 5.25 Plant Area, Harvest Area and Production of Melon by Subdistrict in Pidie District, 2013
Tabel 5.26 Luas Tanam, Luas Panen, dan Produksi Tanaman Semangka menurut Kecamatan di Kabupaten Pidie, Tahun 2013
210
Daftar Tabel Table Content
Pidie Dalam Angka 2014
Pidie in Figures 2014 xxxv
Table 5.26 Plant Area, Harvest Area and Production of Tomato by Watermelon in Pidie District, 2013
Tabel 5.27 Banyaknya Tanaman Mangga, Tanaman yang Dapat Menghasilkan dan Produksi menurut Kecamatan di Kabupaten Pidie, Tahun 2013
211
Table 5.27 Number of Manggo, Produce Plant and Production by Subdistrict in Pidie District, 2013
Tabel 5.28 Banyaknya Tanaman Rambutan, Tanaman yang Dapat Menghasilkan dan Produksi menurut Kecamatan di Kabupaten Pidie, Tahun 2013
212
Table 5.28 Number of Nephelium, Produce Plant and Production by Subdistrict in Pidie District, 2013
Tabel 5.29 Banyaknya Tanaman Langsat, Tanaman yang Dapat Menghasilkan dan Produksi menurut Kecamatan di Kabupaten Pidie, Tahun 2013
213
Table 5.29 Number of Lansium, Produce Plant and Production by Subdistrict in Pidie District, 2013
Tabel 5.30 Banyaknya Tanaman Jeruk Siam/Keprok, Tanaman yang Dapat Menghasilkan dan Produksi menurut Kecamatan di Kabupaten Pidie, Tahun 2013
214
Table 5.30 Number of Orange, Produce Plant and Production by Subdistrict in Pidie District, 2013
Tabel 5.31 Banyaknya Tanaman Jambu Biji, Tanaman yang Dapat Menghasilkan dan Produksi menurut Kecamatan di Kabupaten Pidie, Tahun 2013
215
Table 5.31 Number of Guava, Produce Plant and Production by Subdistrict in Pidie District, 2013
Tabel 5.32 Banyaknya Tanaman Nenas, Tanaman yang Dapat Menghasilkan dan Produksi menurut Kecamatan di Kabupaten Pidie, Tahun 2013
216
Table 5.32 Plant Area, Harvest Area and Production of Peanut by
Subdistrict in Pidie District, 2013
Daftar Tabel Table Content
Pidie Dalam Angka 2014 Pidie in Figures 2014
xxxvi
Tabel 5.33 Banyaknya Tanaman Nangka, Tanaman yang Dapat Menghasilkan dan Produksi menurut Kecamatan di Kabupaten Pidie, Tahun 2013
217
Table 5.33 Plant Area, Harvest Area and Production of Peanut by Subdistrict in Pidie District, 2013
Tabel 5.34 Banyaknya Tanaman Durian, Tanaman yang Dapat Menghasilkan dan Produksi menu00rut Kecamatan di Kabupaten Pidie, Tahun 2013
218
Table 5.34 Plant Area, Harvest Area and Production of Peanut by Subdistrict in Pidie District, 2013
Tabel 5.35 Banyaknya Tanaman Sawo, Tanaman yang Dapat Menghasilkan dan Produksi menurut Kecamatan di Kabupaten Pidie, Tahun 2013
219
Table 5.35 Plant Area, Harvest Area and Production of Peanut by Subdistrict in Pidie District, 2013
Tabel 5.36 Banyaknya Tanaman Pepaya, Tanaman yang Dapat Menghasilkan dan Produksi menurut Kecamatan di Kabupaten Pidie, Tahun 2013
220
Table 5.36 Plant Area, Harvest Area and Production of Peanut by Subdistrict in Pidie District, 2013
Tabel 5.37 Banyaknya Tanaman Pisang, Tanaman yang Dapat Menghasilkan dan Produksi menurut Kecamatan di Kabupaten Pidie, Tahun 2013
221
Table 5.37 Plant Area, Harvest Area and Production of Peanut by Subdistrict in Pidie District, 2013
Tabel 5.38 Banyaknya Tanaman Salak, Tanaman yang Dapat Menghasilkan dan Produksi menurut Kecamatan di Kabupaten Pidie, Tahun 2013
222
Table 5.38 Number of Zalacca Palm Fruit, Produce Plant and Production by Subdistrict in Pidie District, 2013 Tabel 5.39 Banyaknya Tanaman Manggis, Tanaman yang Dapat
Menghasilkan dan Produksi menurut Kecamatan di Kabupaten Pidie, Tahun 2013
223
Daftar Tabel Table Content
Pidie Dalam Angka 2014
Pidie in Figures 2014 xxxvii
Table 5.39 Number of Mangistan, Produce Plant and Production by Subdistrict in Pidie District, 2013
Tabel 5.40 Banyaknya Tanaman Sirsak, Tanaman yang Dapat Menghasilkan dan Produksi menurut Kecamatan di Kabupaten Pidie, Tahun 2013
224
Table 5.40 Number of Soursop Fruit, Produce Plant and Production by Subdistrict in Pidie District, 2013
Tabel 5.41 Banyaknya Tanaman Alpukat, Tanaman yang Dapat Menghasilkan dan Produksi menurut Kecamatan di Kabupaten Pidie, Tahun 2013
225
Table 5.41 Number of Avocado, Produce Plant and Production by Subdistrict in Pidie District, 2013
Tabel 5.42 Banyaknya Tanaman Belimbing, Tanaman yang Dapat Menghasilkan dan Produksi menurut Kecamatan di Kabupaten Pidie, Tahun 2013
226
Table 5.42 Number of Star Fruit, Produce Plant and Production by Subdistrict in Pidie District, 2013
Tabel 5.43 Banyaknya Tanaman Jambu Air, Tanaman yang Dapat Menghasilkan dan Produksi menurut Kecamatan di Kabupaten Pidie, Tahun 2013
227
Table 5.43 Number of Guava Water, Produce Plant and Production by Subdistrict in Pidie District, 2013
Tabel 5.44 Banyaknya Tanaman Sukun, Tanaman yang Dapat Menghasilkan dan Produksi menurut Kecamatan di Kabupaten Pidie, Tahun 2013
228
Table 5.44 Plant Area, Harvest Area and Production of Breadfruit by Subdistrict in Pidie District, 2013
Tabel 5.45 Banyaknya Tanaman Melinjo, Tanaman yang Dapat Menghasilkan dan Produksi menurut Kecamatan di Kabupaten Pidie, Tahun 2013
229
Table 5.45 Plant Area, Harvest Area and Production of Peanut by Subdistrict in Pidie District, 2013
Tabel 5.46 Jumlah Alat-alat Pertanian menurut Jenis dan Kecamatan di Kabupaten Pidie, Tahun 2013
230
Daftar Tabel Table Content
Pidie Dalam Angka 2014 Pidie in Figures 2014
xxxviii
Table 5.46 Number of Agriculture Tools by Type and Subdistrict in Pidie District, 2013
Tabel 5.47 Luas Lahan Sawah menurut Jenis Pengairan dan Kecamatan di Kabupaten Pidie, Tahun 2013
234 Table 5.47 Area of Rice Field by Irrigation Type and Subdistrict
in Pidie District, 2013
Tabel 5.48 Luas Areal Budidaya Perikanan menurut Kecamatan di Kabupaten Pidie, Tahun 2013
235 Table 5.48 Area of Fishery Cultivation.by Subdistrict in Pidie
District, 2013
Tabel 5.49 Produksi Ikan menurut Tempat Penangkapan/
Pemeliharaan per Kecamatan di Kabupaten Pidie, Tahun 2013
236
Table 5.49 Production of Fish by Place of Maintain by Subdistrict in Pidie District, 2013
Tabel 5.50 Nilai Produksi Ikan menurut Tempat Penangkapan/
Pemeliharaan per Kecamatan di Kabupaten Pidie, Tahun 2013
237
Table 5.50 Production Rate of Fish by Arrest Place by Subdistrict in Pidie District, 2013
Tabel 5.51 Produksi dan Nilai Produksi Ikan Laut menurut Lokasi TPI di Kabupaten Pidie, Tahun 2010-2013
239 Table 5.51 Production and Production Rate of Sea Fish
by Place of Fish Arrest by Subdistrict in Pidie District, 2010-2013
Tabel 5.52 Banyaknya Armada Perikanan menurut Kecamatan di Kabupaten Pidie, Tahun 2013
240 Tablet 5.42 Number of Fishery Fleet by Subdistrict in Pidie
District, 2013
Tabel 5.53 Banyaknya Alat Penangkapan menurut Kecamatan di Kabupaten Pidie, Tahun 2013
241 Table 5.43 Number of Arrest Tools by Subdistrict in Pidie
District, 2013
Daftar Tabel Table Content
Pidie Dalam Angka 2014
Pidie in Figures 2014 xxxix
Tabel 5.54 Banyaknya Populasi Ternak menurut Jenis Ternak per Kecamatan di Kabupaten Pidie, Tahun 2013
242 Table 5.54 Number of Livestock by Livestock Type Subdistrict in
Pidie District, 2013
Tabel 5.55 Banyaknya Pemotongan Ternak menurut Jenis Ternak per Kecamatan di Kabupaten Pidie, Tahun 2013
244 Table 5.55 Number of Livestock by Livestock Type Subdistrict in
Pidie District, 2013
Tabel 5.56 Banyaknya Produksi Telur menurut Jenis Unggas per Kecamatan di Kabupaten Pidie, Tahun 2013
246 Table 5.56 Number of Egg Production by Poultry Type and
Subdistrict in Pidie District, 2013
Tabel 5.57 Banyaknya Produksi Daging menurut Jenis Daging per Kecamatan di Kabupaten Pidie, Tahun 2013
247 Table 5.57 Number of Meat Production by Meat Type and
Subdistrict in Pidie District, 2013
Tabel 5.58 Banyaknya Pemasukan Ternak dan Hasil Ternak menurut Jenis Ternak dan Daerah Asal di Kabupaten Pidie, Tahun 2013
248
Table 5.58 Number of Livestock Inclusion and Prodution by Livestock Type and Origin Area in Pidie District, 2013
Tabel 5.59 Banyaknya Pemasukan Ternak dan Hasil Ternak menurut Jenis Ternak dan Daerah Tujuan di Kabupaten Pidie, Tahun 2013
249
Table 5.59 Number of Livestock Inclusion and Prodution by Livestock Type and Destination Area in Pidie District, 2013
Tabel 5.60 Luas Areal dan Produksi Komoditi Karet Perkebunan Rakyat menurut Kecamatan di Kabupaten Pidie, Tahun 2013
250
Table 5.60 The Area and Production of Rubber from People
Plantation by Subdistrict in Pidie District, 2013
Daftar Tabel Table Content
Pidie Dalam Angka 2014 Pidie in Figures 2014
xl
Tabel 5.61 Luas Areal dan Produksi Komoditi Kelapa Dalam Perkebunan Rakyat menurut Kecamatan di Kabupaten Pidie, Tahun 2013
251
Table 5.61 The Area and Production of Coconut from People Plantation by Subdistrict in Pidie District, 2013
Tabel 5.62 Luas Areal dan Produksi Komoditi Kelapa Hibrida Perkebunan Rakyat menurut Kecamatan di Kabupaten Pidie, Tahun 2013
252
Table 5.62 The Area and Production of Hybrid Coconut from People Plantation by Subdistrict in Pidie District, 2013
Tabel 5.63 Luas Areal dan Produksi Komoditi Kelapa Sawit Perkebunan Rakyat menurut Kecamatan di Kabupaten Pidie, Tahun 2013
253
Table 5.63 The Area and Production of Palm Oil from People Plantation by Subdistrict in Pidie District, 2013
Tabel 5.64 Luas Areal dan Produksi Komoditi Kopi Perkebunan Rakyat menurut Kecamatan di Kabupaten Pidie, Tahun 2013
254
Table 5.64 The Area and Production of Coffee Bean from People Plantation by Subdistrict in Pidie District, 2013
Tabel 5.65 Luas Areal dan Produksi Komoditi Cengkeh Perkebunan Rakyat menurut Kecamatan di Kabupaten Pidie, Tahun 2013
255
Table 5.65 The Area and Production of Clove from People Plantation by Subdistrict in Pidie District, 2013
Tabel 5.66 Luas Areal dan Produksi Komoditi Pala Perkebunan Rakyat menurut Kecamatan di Kabupaten Pidie, Tahun 2013
256
Table 5.66 The Area and Production of Nutmeg from People Plantation by Subdistrict in Pidie District, 2013 Tabel 5.67 Luas Areal dan Produksi Komoditi Pinang Perkebunan
Rakyat menurut Kecamatan di Kabupaten Pidie, Tahun 2013
257
Daftar Tabel Table Content
Pidie Dalam Angka 2014
Pidie in Figures 2014 xli
Table 5.67 The Area and Production of Pinang from People Plantation by Subdistrict in Pidie District, 2013
Tabel 5.68 Luas Areal dan Produksi Komoditi Kapuk Perkebunan Rakyat menurut Kecamatan di Kabupaten Pidie, Tahun 2013
258
Table 5.68 The Area and Production of Kapok from People Plantation by Subdistrict in Pidie District, 2013
Tabel 5.69 Luas Areal dan Produksi Komoditi Kakao Perkebunan Rakyat menurut Kecamatan di Kabupaten Pidie, Tahun 2013
259
Table 5.69 The Area and Production of Kakao from People Plantation by Subdistrict in Pidie District, 2013
Tabel 5.70 Luas Areal dan Produksi Komoditi Jambu Mete Perkebunan Rakyat menurut Kecamatan di Kabupaten Pidie, Tahun 2013
260
Table 5.70 The Area and Production of Cashew from People Plantation by Subdistrict in Pidie District, 2013
Tabel 5.71 Luas Areal dan Produksi Komoditi Kemiri Perkebunan Rakyat menurut Kecamatan di Kabupaten Pidie, Tahun 2013
261
Table 5.71 The Area and Production of Walnut from People Plantation by Subdistrict in Pidie District, 2013
Tabel 5.72 Luas Areal dan Produksi Komoditi Lada Perkebunan Rakyat menurut Kecamatan di Kabupaten Pidie, Tahun 2013
262
Table 5.72 The Area and Production of Peppercorn from People Plantation by Subdistrict in Pidie District, 2013
Tabel 5.73 Luas Areal dan Produksi Komoditi Sagu Perkebunan Rakyat menurut Kecamatan di Kabupaten Pidie, Tahun 2013
263
Table 5.73 The Area and Production of Sago Palm from People
Plantation by Subdistrict in Pidie District, 2013
Daftar Tabel Table Content
Pidie Dalam Angka 2014 Pidie in Figures 2014
xlii
Tabel 5.74 Luas Areal dan Produksi Komoditi Aren Perkebunan Rakyat menurut Kecamatan di Kabupaten Pidie, Tahun 2013
264
Table 5.74 The Area and Production of Sugar Palm from People Plantation by Subdistrict in Pidie District, 2013
Tabel 5.75 Luas Areal dan Produksi Komoditi Cassiavera Perkebunan Rakyat menurut Kecamatan di Kabupaten Pidie, Tahun 2013
265
Table 5.75 The Area and Production of Cassiavera from People Plantation by Subdistrict in Pidie District, 2013
Tabel 5.76 Luas Areal dan Produksi Komoditi Nilam Perkebunan Rakyat menurut Kecamatan di Kabupaten Pidie, Tahun 2013
266
Table 5.76 The Area and Production of Patchouli. from People Plantation by Subdistrict in Pidie District, 2013
Tabel 5.77 Luas Areal dan Produksi Komoditi Tembakau Perkebunan Rakyat menurut Kecamatan di Kabupaten Pidie, Tahun 2013
267
Table 5.77 The Area and Production of Tobacco from People Plantation by Subdistrict in Pidie District, 2013
Tabel 5.78 Luas Areal dan Produksi Komoditi Tebu Perkebunan Rakyat menurut Kecamatan di Kabupaten Pidie, Tahun 2013
268
Table 5.78 The Area and Production of Sugar Cane from People Plantation by Subdistrict in Pidie District, 2013
Tabel 5.79 Luas Areal dan Produksi Komoditi Kunyit Perkebunan Rakyat menurut Kecamatan di Kabupaten Pidie, Tahun 2013
269
Table 5.79 The Area and Production of Turmeric from People Plantation by Subdistrict in Pidie District, 2013 Tabel 5.80 Luas Areal dan Produksi Komoditi Jahe Perkebunan
Rakyat menurut Kecamatan di Kabupaten Pidie, Tahun 2013
270
Table 5.80 The Area and Production of Gingger from People
Plantation by Subdistrict in Pidie District, 2013
Daftar Tabel Table Content
Pidie Dalam Angka 2014
Pidie in Figures 2014 xliii
Tabel 5.81 Luas Areal dan Produksi Komoditi Gambir Perkebunan Rakyat menurut Kecamatan di Kabupaten Pidie, Tahun 2013
271
Table 5.81 The Area and Production of Gambier from People Plantation by Subdistrict in Pidie District, 2013
Tabel 6.1 Keadaan Industri di Kabupaten Pidie, Tahun 2013 273 Table 6.1 Situation of Industry in Pidie District, 2013
Tabel 6.2 Keadaan Industri Kecil Komoditi Industri Pangan di Kabupaten Pidie, Tahun 2013
274 Table 6.2 Situation of Small Industry of Food Industry in Pidie
District, 2013
Tabel 6.3 Keadaan Industri Komoditi Industri Sandang di Kabupaten Pidie, Tahun 2013
276 Table 6.3 Situation of Small Industry of Clothe Industry in Pidie
District, 2013
Tabel 6.4 Keadaan Industri Kecil Komoditi Industri Kimia dan Bahan Bangunan di Kabupaten Pidie, Tahun 2013
277 Table 6.4 Situation of Small Industry of Chemistry andMaterial
Industry Commodity in Pidie District, 2013
Tabel 6.5 Keadaan Industri Kecil Komoditi Industri Logam dan Elektronika di Kabupaten Pidie, Tahun 2013
278 Table 6.5 Situation of Small Industry of Metal and Electronic
Commodity Commodity in Pidie District, 2013
Tabel 6.6 Keadaan Industri Kecil Komoditi Industri Kerajinan di Kabupaten Pidie, Tahun 2013
279 Table 6.6 Situation of Formal Small Industry of Handycraft
Commodity in Pidie District, 2013
Tabel 6.7 Keadaan Industri Kecil Formal Logam Mesin dan Elektronik di Kabupaten Pidie, Tahun 2013
280 Table 6.7 Situation of Formal Small Industry of Metal Machine
and Electronic in Pidie District, 2013
Daftar Tabel Table Content
Pidie Dalam Angka 2014 Pidie in Figures 2014
xliv
Tabel 6.8 Keadaan Industri Kecil Non Formal Logam Mesin dan Elektronik di Kabupaten Pidie, Tahun 2013
281 Table 6.8 Situation of Non Formal Small Industry of Metal
Machine and Electronic in Pidie District, 2013
Tabel 6.9 Keadaan Industri Kecil Formal Hasil Hutan di Kabupaten Pidie, Tahun 2013
282 Table 6.9 Situation of Formal Small Industry of Forest Product
in Pidie District, 2013
Tabel 6.10 Keadaan Industri Kecil Non Formal Hasil Hutan di Kabupaten Pidie, Tahun 2013
283 Table 6.10 Situation of Non Formal Small Industry of Forest
Product in Pidie District, 2013
Tabel 6.11 Jumlah Koperasi sebagai Badan Hukum menurut Kualitasnya Dirinci per Kecamatan di Kabupaten Pidie, Tahun 2013
284
Table 6.11 Number of Co-operation as Legal Institution by Quality and Subdistrict in Pidie District, 2013
Tabel 6.12 Perkembangan Koperasi KUD dan Non KUD di Kabupaten Pidie, Tahun 2013
285 Table 6.12 Growth of Countryside Unit Co-operation and Non
Countryside Unit Co-operation in Pidie District, 2013
Tabel 6.13 Jumlah Daya Tersambung Listrik, KWH Terjual, Jumlah Pelanggan dan Jumlah Pendapatan menurut Unit Lokasi Kerja pada PT. (Persero) PLN di Kabupaten Pidie, Tahun 2013
286
Table 6.13 Number of Connected Electrics Energy, Sold KWH, Number of Costumer and Earnings according to Work Location Unit at PT. PLN in Pidie District, 2013
Tabel 6.14 Jumlah Daya Tersambung, Langganan, KWH Terjual dan Pendapatan menurut Golongan Pemakai pada PT.
(Persero) PLN di Kabupaten Pidie, Tahun 2013
287
Table 6.14 Number of Connected Electrics Energy, Number of
Costumer, Sold KWH and Earnings at PT. PLN
according to Users Type in Pidie District, 2013
Daftar Tabel Table Content
Pidie Dalam Angka 2014
Pidie in Figures 2014 xlv