Professional SQL Server 2000 Data
Warehousing with Analysis Services
Tony Bain Mike Benkovich
Robin Dewson Sam Ferguson Christopher Graves
Terrence J. Joubert Denny Lee Mark Scott Robert Skoglund
Paul Turley Sakhr Youness
About the Authors
Tony Bain
Tony Bain (MCSE, MCSD, MCDBA) is a senior database consultant for SQL Services in Wellington, New Zealand. While Tony has experience with various database platforms, such as RDB and Oracle, for over four years SQL Server has been the focus of his attention. During this time he has b een responsible for the design, development and administration of numerous SQL Server -based solutions for clients in such industries as utilities, property, government, technology, and insurance.
Tony is passionate about database technologies especially w hen they relate to enterprise availability and scalability. Tony spends a lot of his time talking and writing about various database topics and in the few moments he has spare Tony hosts a SQL Server resource site (www.sqlserver.co.nz).
Dedication
I must thank Linda for her continued support while I work on projects such as this, and also our beautiful girls Laura and Stephanie who are my motivation. Also a big thank -you to Wrox for the opportunity to participate in the interesting projects that have been thrown my way, with special thanks in particular to Doug, Avril, and Chandy.
Mike Benkovich
Mike Benkovich is a partner in the Minneapolis -based consulting firm Applied Technology Group. Despite his degree in Aerospace Engineering, he has found that developing software is far more interesting and rewarding. His interests include integration of relational databases within corporate models, application security and encryption, and large-scale data replication systems.
Mike is a proud father, inspired husband, annoying brother, and dedicated son who thanks his lucky stars for having a family that gives freely their support during this project. Mike can be reached at [email protected].
Robin Dewson
he passed away was a brilliant inspiration to my children, my mother -in-law for once again helping Julie with the children. Also a quick thank-you from my wife, to Charlie and Debbie at Sea Palling for selling the pinball machine!!! But my biggest thanks as ever go to Julie, the most perfect mother the kids could have, and to Scott, Cameron, and Ellen for not falling off the jet -ski when I go too fast.
'Up the Blues'
Sam Ferguson
Sam Ferguson is an IT Consultant with API Software, a growing IT Solutions company based in Glasgow, Scotland. Sam works in various fields but specializes in Visual Basic, SQL Server, XML, and all things .Net.
Sam has been married to the beautiful Jacqueline for two months and happily lives next door to sister -i n-law Susie and future brother -i n-law Martin.
Dedication
I would like to dedicate my contribution to this book to Susie and Martin, two wonderful people who will have a long and happy life together.
Christopher Graves
Chris Graves is President of RapidCF, a ColdFusion development company in Canton Connecticut
(www.rapidcf.com). Chris leads projects with Oracle 8i a nd SQL Server 2000 typically coupled to web-based solutions. Chris earned an honors Bachelor of Science degree from the US Naval Academy (class of 93, the greatest class ever), and was a VGEP graduate scholar. After graduating, Chris served as a US Marine Corps Officer in 2n d Light Armored Reconnaissance Battalion, and 2nd ANGLICO where he was a jumpmaster. In addition to a passion for efficient CFML, Chris enjoys skydiving and motorcycling, and he continues to lead Marines in the Reserves. His favorite pas time, however, is spending time with his two daughters Courtney and Claire, and his lovely wife Greta.
Terrence J. Joubert
Terrence is a Software Engineer working with Victoria Computer Services (VCS), a Seychelles -based IT solutions provider. He also works as a freelance Technical Reviewer for several publishing companies. As a developer and aspiring author, Terrence enjoys reading about and experimenting with new technologies, especially the Microsoft .Net products. He is currently doing a Bachelor of Science degree by correspondence and hopes that his IT career spans development, research, and writing. When he is not around computers he can be found relaxing on one of the pure, white, sandy beaches of the Seychelles or hiking along the green slopes of its mountains.
Dedication
This work is the starting point of a very long journey. I dedicate it to:
My mother who helped me get started on my first journey to dear life, my father who teaches me independence, and motivation to achieve just anything a man wills along the path of destiny, and Audrey, for all the things between us that are gone, the ones are here now, and those that are to come. Thanks for being a great friend.
Denny Lee
Denny Lee is the Lead OLAP Architect at digiMine, Inc. (Bellevue, WA), a leading analytic services company specializing in data warehousing, data mining, and business intelligence. His primary focus is delivering powerful, scalable, enterprise-level OLAP solutions that provide customers with the business intelligence insights needed to act on their data. Before joining digiMine, Lee was as a Lead Developer at the Microsoft Corporation where he built corporate reporting solutions utilizing OLAP services against corporate data warehouses, and took part in developing one of the first OLAP solutions. Interestingly, he is a graduate of McGill University in Physiology and prior to Microsoft, was a Statistical Analyst at the Fred Hutchison Cancer Research Center in one of the largest HIV/AIDS research projects.
Dedication
Special thanks to my beautiful wife, Hua Ping, for enduring the hours I spend of working and writing...and loving me all the same.
Many thanks to the kind people at Wrox Press to produced this book.
Mark Scott
Mark Scott serves as a consultant for RDA, a provider of advanced technology consulting services. He develops multi-tier, data-centric web applications. He implements a wide variety of Microsoft-based technologies, with special emphasis on SQL Server and Analysis Services. He is a Microsoft Certified System Engineer + Internet, Solution Developer, Database Administrator, and Trainer. He holds A+, N etwork+ and CTT+ certifications from COMPTIA.
Robert Skoglund
Robert is President and Managing Director of RcS Consulting Services, Inc., a Business Intelligence, Database Consulting, and Training Company based in Tampa, Florida, USA. Robert has over 10 years experience developing and implementing a variety of business applications using Microsoft SQL Server (version 1.0 through version 2000), and is currently developing data warehouses using Microsoft’s SQL Server and Analysis Services. Robert’s certificat ions include Microsoft’s Certified Systems Engineer (1997), Solution Developer (1995), and Trainer (1994). He is also an associate member of The Data Warehousing Institute. Additionally, Robert provides certified training services to Microsoft Certified Technical Education Centers nationwide and internationally. Robert also develops customized NT and SQL courses and presentations for both technical and managerial audiences.
frameworks. He has been working with Microsoft development tools including Visual Basic, SQL Server and Access since 1994. He was a contributing author for the Wrox Press book, Professional A ccess 2000 Programming and has authored several technical courseware publications.
A Microsoft Certified Solution Developer (MCSD) since 1996, Paul has worked on a number of large-scale consulting projects for prominent clients including HP, Nike, and Microsoft. He has worked closely with Microsoft Consulting Services and is one of few instructors certified to teach the Microsoft Solution Framework for solution design and project management.
Paul lives in Vancouver, Washington with his wife, Sherri, and four children – Krista, 4; Sara, 5; Rachael, 10; and Josh, 12; a dog, two cats, and a bird. Somehow, he finds time to write technical publications. He and his family enjoy camping, cycling and hiking in the beautiful Pacific Northwest. He and his son also d esign and build competition robotics.
Dedication
Thanks most of all to my wife, Sherri and my kids for their patience and understanding.
To the staff and instructors at SQL Soft, a truly unique group of people (I mean that in the best possible way). It's good to be part of the team. Thanks to Douglas Laudenschlager at Microsoft for going above and beyond the call of duty.
Sakhr Youness
Sakhr Youness is a Professional Engineer (PE) and a Microsoft Certified Solution Developer (MCSD) and Product Specialist ( MCPS) who has extensive experience in data modeling, client-server, database, and enterprise application development. Mr. Youness is a senior software architect at Commerce One, a leader in the business-to-business (B2B) area. He is working in one of the largest projects for Commerce One involving building an online exchange for the auto industry. He designed and developed or participated in developing a number of client-server applications related to the automotive, banking, healthcare, and engineering industries. Some of the tools used in these projects include: Visual Basic, Microsoft Office products, Active Server Pages (ASP), Microsoft Transaction Server (MTS), SQL Server, Java, and Oracle.
Mr. Youness is a co-author of SQL Server 7.0 Programming Unleashed which was published by Sams in June 1999. He also wrote the first edition of this book, Professional Data Warehousing with SQL Server 7.0 and OLAP Services. He is also proud to say that, in this edition, he had help from many brilliant authors who helped write numerous chapters of this book, adding to it a great deal of value and benefit, stemming from their experiences and knowledge. Many of these authors have other publications and, in some cases, wrote books about SQL Server.
Mr. Youness also provided development and technical reviews of many books for MacMillan Technical Publishing and Wrox Press. These books mostly involved SQL Server, Oracle, Visual Basic, and Visual Basic for Applications (VBA).
Mr. Youness loves learning new technologies and is currently focused on using the latest innovations in his projects.
Introduction
1
How to Download the Sample Code for the Book 4
Errata 5
E- mail Support 5
p2p.wrox.com 5
Chapter 1: Analysis Services in SQL Server 2000 – An Overview
9
What is OLAP? 10
What are the Benefits of OLAP? 11
Who Will Benefit from OLAP? 12
What are the Features of OLAP? 13
Multidimensional Views 13
Calculation-Intensive 13
Time Intelligence 14
What is a Data Warehouse? 14
Data Warehouse vs. Traditional Operational Data Stores 15
Purpose and Nature 16
Data Structure and Content 17
Data Volume 18
Timeline 19
How Data Warehouses Relate to OLAP 19
Data Warehouses and Data Marts 19
Data Mining 22
Overview of Microsoft Analysis Services in SQL Server 2000 23
Features of Microsoft Analysis Services 25
New Features to Support Data Warehouses and Data Mining 25
The Foundation: Microsoft SQL Server 2000 26
Data Transformation Services (DTS) 26
Meta Data and the Repository 28
Chapter 2: Microsoft Analysis Services Architecture
35
Overview 35
The Microsoft Repository 39
Architecture of the Microsoft Repository 41
Microsoft Repository in Data Warehousing 43
The Data Source 43
Operational Data Sources 43
Data Transformation Services 46
DTS Package Tasks 46
Defining DTS Package Components 47
The Data Warehouse and OLAP Database – The Object Architecture in
Analysis Services 49
Chapter 3: Analysis Services Tools
57
Analysis Manager 57
Data Sources 59
Cubes 61
Shared Dimensions 63
Enterprise Manager 68
How Does a Data Mart Differ from a Data Warehouse? 78
Who Should Implement a Data Mart Solution? 78
Development Approache s 79
Design Considerations – Things to Watch For... 85
Minimize Duplicate Measure Data 85
Allow for Drilling Across and Down 85
Build Your Data Marts with Compatible Tools and Technologies 86
Take into Account Locale Issues 86
Data Modeling Techniques 87
Microsoft Data Warehousing Framework and Data Marts 93
Chapter 5: The Transactional System
97
Data Manipulation Language (DML) 107
Data Analysis Support in SQL 107
Online Transaction Processing (OLTP) 107
The Need for the Data Warehouse 115
The FoodMart Sample 115
Upgrading to SQL Server 2000 115
Summary 121
Chapter 6: Designing the Data Warehouse and OLAP Solution
123
Pre-requisites for a Successful Design 124
Customer Management 125
The Project Team 125
The Tools 127
Designing the Data Warehouse 128
Be Aware of Pre-Calculations 133
Dimension Data Must Appropriately Exist in Dimension Tables 134
Indexed Views 135
Use Star or Snowflake Schema 135
How About Dimension Members? 136
Designing OLAP Dimensions and Cubes 138
Member Properties 139
Virtual Dimensions and Virtual Cubes 140
Designing Partitions 140
Meta Data and the Microsoft Repository 141
Data Source 141
Data Loading and Transformation Strategy 150
Capturing the Data 150
Transforming the Data 153
Populating the Data Warehouse 154
OLAP Policy and Long-Term Maintenance and Security Strategy 154
What is the OLAP Policy, After All? 154 What Rules Does the OLAP Policy Contain? 154
User Interface and Querying Tools 157
Summary 157
Chapter 7: Introducing Data Transformation Services (DTS)
159
DTS Overview 160
Support for Multiple Data Sources 166
Data Transformations 168
Data Validation 169
Simple Validation 169
Complex Validation 170
Planning your Transformations 172
Data Migration 173
Using the DTS Package 173
Anatomy of the DTS Package 174
DTS Connection 175
DTS Task 175
DTS Step/Workflow 178
Storing the DTS Package 179
How DTS Packages are Stored in SQL Server 179 DTS Package Storage in the Repository 180 DTS Package Storage in Visual Basic Files 180 DTS Package Storage in COM-Structured Files 181
Creating a DTS package 182
Chapter 8: Advanced DTS Topics
203
Data Driven Query (DDQ) 204
DTS Lookup 209
The Analysis Services Processing Task 211
How Can You Use It? 211
Benefits of Using the Analysis Services Processing Task 214
Data Mining Prediction Task 214
OLTP to Star Schema through DTS 217
OLTP/Star Package Design 218
Multiple Connections and Single Connections 219
Package Transactions 220
Loading the Customer Dimension Data 220
Building the Time Dimension 221
Building the Geography Dimension 222
Building the Product Dimension 222
Building the Sales Fact Data 223
DTS Performance Issues 224
Using ActiveX Scripts 224
DTS Security 225
Owner password 225
User Password 225
Viewing Package Meta Data 225
Summary 227
Chapter 9: Building OLAP Cubes with Analysis Manager
229
Basic Topics 230
Create a New OLAP Database 230
Data Sources 231
Regular Dimension with Member Properties 238
Building a Virtual Dimension 240
Building a Parent -Child dimension 241
Viewing Dimension Meta Data 241
More on Processing Cubes 247
Viewing your Cube Meta Data 248
Browsing your Cubes 249
Calculations at the Member Level 254
Dimension Properties 279
Dimension Level Properties 282
Summary 285
Chapter 10: Introduction to MDX
287
How Good is SQL? 288
MDX Representation of OLAP Schema 298
Using Square Brackets 298
Using the Period in Schema Representation 299
Establishing Unique Names 299
Separation of Set Elements (The Comma) 300
Identifying Ranges (Colon) 301
Identifying the Set Members with the .Members Operator 302
CrossJoin() 302
The * (asterisk) Operator 304
Filter() Function 305
The Order() Function 306
Dimensional Calculations in MDX 308
Query -Defined Calculated Members (With Operator) 309 Non Query -Defined Calculated Members (CREATE MEMBER) 312
Named Sets 312
Axis Numbering and Ordering 313
Chapter 11: Advanced MDX Topics
317
Advanced MDX Statement Topics 317
Retrieving Cell Properties 317
The Format String 319
MDX Cube Slicers 323
Beefing Up MDX Cube Slicers 324
Joining Cubes in the FROM Clause 324
Empty FROM Clause 325
Using Outer References in an MDX Query 325
Using Property Values in MDX Queries 326
Overriding the WHERE Clause 326
Default Hierarchy and Member 327
Empty Cells 328
NULLs, Invalid Members, and Invalid Results 328
The COALESCEEMPTY Function 330
Counting Empty Cells 331
Empty Cells in a Cellset and the NON EMPTY Keyword 331
More on Named Sets and Calculated Members 332
MDX Expressions 333
Set Value Expressions 334
Drilling by Member 335
Drilling by Level 337
Preserving State During UI Operations 339
Conditional Expressions 339
Chapter 12: Using the PivotTable Service
349
Introducing the PivotTable Service 349
Quick Primer on Data Access Technologies 350
Usage of the PivotTable Service 351
OLE DB For OLAP 351
Multidimensional Expressions 352
Data Retrieval 352
ActiveX Data Objects, Multi Dimensional 353
ADO MD 353
The ADO MD Object Model 353
The Database Structural View 353
Example Working Through a Structural View 354
The PivotTable View 356
PivotTable Service and Excel 356
Implementing OLAP- Centric PivotTables in Excel 356
Implementing OLAP- Centric PivotTables in Excel VBA 360
The Code 360
Summary 363
Chapter 13: OLAP Services Project Wizard in English Query
365
What is the Project Wizard? 366
Development and User Installation Requirements 367
Before You Begin 368
Model Test Window Features 378
Regression Tests 379
Analysis Page 380
Suggestion Wizard 380
Follow-up Questions 381
Adding and Modifying Phrases 382
Test the Query 385
Chapter 14: Programming Analysis Services
395
ADO: The History and Future of Data Access 395
Case Study 396
User Audience 396
Business Requirements and Vision 396
Development Tools and Environment 397
Proposed Solution 397
Data Storage and Structure 398
Programming Office Web Components 399
Programming the PivotTable Control 401
Meta Data Scripter Utility 423
Summary 423
Chapter 15: English Query and Analysis Services
425
Programming English Query 426
English Query Engine Object Model 426
Solution Components 429
Question Builder Object Model 433
The Question Builder Control 433
Building the English Query Application 437
Submitting a Question 440
Chapter 16: Data Mining – An Overview
455
Data Mining 456
Historical Perspective 456
Why is Data Mining Important? 457
Why Now? 458
Inexpensive Data Storage 458
Affordable Processing Power 459
Data Availability 459
Off -the-Shelf Data Mining Tools 459
Definition 459
Operational Data Store vs. Data Warehousing 460
OLAP vs. Data Mining 460
Data Mining Models 460
Data Mining Algorithms 461
Hypothesis Testing vs. Knowledge Discovery 463
Measure the Results 465
Success Factors for Data Mining Projects 467
The situation 468
Create a plan 468
Delivering on the plan 469
Summary 469
Chapter 17: Data Mining: Tools and Techniques
471
Data Mining Approaches 472
Building An OLAP Clustering Data Mining Model 482
Open Analysis Services Manager 482
Select The Source Of Data For Our Analysis 484
Select The Source Cube 484
Choose The Algorithm For This Mining Model 485
Define The Key To Our Case 486
Select Type Of Data For Our Analysis 491
Select The Source Table(s) 491
Choose The Algorithm For This Mining Model 492 Define How The Tables Are Related 493
Define The Key 493
Identify Input And Prediction Columns 494 Save The Model But Don't Process It – Yet 494 Edit The Model In The Relational Mining Model Editor 495
Progress Window 496
Examp le: Browsing Mining Model Information 503
Getting Started 504
Building And Using A Local Data Mining Model 510
Create Mining Model 510
Training The Model 512
Browsing The Model – What Have We Learned? 515
Querying The Model – Prediction Join 515
DTS And Data Mining Tasks 515
Use DTS To Create Prediction Queries 516
Commerce Data 530
Optimizing the SQL Data Warehouse 535
Organizing Your Data 535
Visits 536
Events 536
Referential Integrity 536
Optimizing Your OLAP Data Warehouse 537
Optimizing OLAP Dimensions 537
Cube Partitions and Updating Dimensions 542
Issues 543
Reporting the Data with ADO MD 546
Connection Object 546
Connection Pooling 548
Middle Tier Optimizations 550
Mini Case Study 552
Summary 553
Chapter 19: Securing Analysis Services Cubes
555
Establishing Basic Cube Security 555
Creating Users and Groups 556
Managing Permissions through Roles 559
Database Roles 559
Building database roles with Analysis Manager 559 Building Database Roles Programmatically using Decision Support Objects 562
Cube Roles 563
Building Cube Roles with Analysis Manager 563 Building Cube Roles Programmatically using Decision Support Objects 566
Mining Model Roles 568
Building Mining Model Roles with Analysis Manager 568 Building Mining Model Roles Programmatically Using Decision Support Objects 569
Dimensional Security 569
Building Dimensional Security with Analysis Manager 570 Building Dimensional Security Programmatically using Decision Support Objects 573 Considerations for Custom Dimensional Access 575
Cell Level Security 575
Building Cell Security with Analysis Manager 576 Building Cell Security Programmatically using Decision Support Objects 578
Virtual Security 578
Chapter 20: Tuning for Performance
585
Performance Tuning Overview 585
Evaluate and Refine the Design 586
SQL Server Profiler 597
Chapter 21: Maintaining the Data Warehouse
619
Backup and Recovery 619
Automating the Data Warehouse Administration Tasks with SQL Agent 636
Automatic Administration Components 637
Jobs 637
Operators 639
Alerts 640
Database Maintenance Plan 647
Archiving Analysis Databases 654
Archive Creation 654
Archiving using Analysis Manager 655 Archive Creation using the Command Line 655
Archive Restoration 656
Archive Restoration from Analysis Services 656 Archive Restoration from the Command Line 656
Summary 657
Introduction
It has only been roughly 20 months since the first edition of this book was released. That edition covered Microsoft data warehousing and OLAP Services as it related to the revolutionary Microsoft SQL Server 7.0. Approximately seven months after that, Microsoft released its new version of SQL Server, SQL Server 2000. This version included many enhancements on an already great product. Many of these came in the area of data warehousing and OLAP Services, which was renamed as "Analysis Services". Therefore, it was important to produce an updated book, covering these new areas, as well as present the original material in a new, more mature, way. We hope that as you read this book, you will find the answers to most of the questions you may have regarding Analysis Services and Microsoft data warehousing technologies.
So, what are the new areas in Microsoft OLAP and data warehousing that made it worth creating this new edition? We are not going to mention the enhancements to the main SQL Server product; rather, we will focus on enhancements in the areas of Data Transformation and Analysis Services. These can be summarized as:
q Cube enhancements: new cube types have been introduced, such as distributed partitioned cubes, real-time cubes, and linked cu bes. Improved cube processing, drillthrough, properties selections, etc. are also among the great enhancements in the area of OLAP cubes.
q Dimension enhancements: new dimension and hierarchy types, such as changing dimensions, write-enabled dimensions, dependent dimensions, and ragged dimensions have been added. Many enhancements have also been introduced to virtual dimensions, custom members, and rollup formulae.
q Other enhancements include improvements in the security area, allowing for cell-level security, and additional authentication methods, such as HTTP authentication.
q OLAP clients can now connect to Analysis servers through HTTP or HTTPS protocols v ia the Internet Information Services (IIS) web server. Allocated write-backs have also been introduced in this area, as well as the introduction of data mining clients.
q The long-awaited MDX builder has also been introduced in this version, allowing develop ers to easily write MDX queries without having to worry about syntactical errors, thus enabling them to focus on getting the job done.
q The introduction of XML for Analysis Services.
q Enhancements of the programming APIs that come with Analysis Services, such as ADO-MD and DSO objects.
q Microsoft has added many new tasks to DTS, making it a great tool for transformations – not only for data being imported into a SQL Server database, but also for any RDBMS. For instance:
q DTS packages can now be saved as Visual Basic files
q Packages can run asynchronously q Packages can send messages to each other
q Packages can be executed jointly in one atomic transaction
q Parameterized queries can now be used in DTS packages q Global variables can now be used to pass values among pack ages
q There are new logging capabilities
q We can use a customizable multi-phase data pump
This is only a partial list of the enhancements to Analysis Services and DTS. Many enhancements in SQL Server itself have led to a further increase in the support for data warehousing and data marts. These include the enhanced management and administration (new improved tools like SQL Server Manager, Query Analyzer, and Profiler), and the support for bigger hardware and storage space.
Is This Book For You?
If you have already used SQL Server 7.0 OLAP Services, or are familiar with it, you will see that this book adds a great value to your knowledge with the discussion of the enhancements to these services and tools.
If you are a database administrator or developer who is anxious to learn about the new OLAP and data warehousing support in SQL Server 2000, then this book is for you. It does not really matter if you have had previous experience with SQL Server, or not. However, this book is not about teaching you how to use SQL Server. Many books are available on the market that would be more appropriate for this purpose, such as
Professional SQL Server 2000 Programming (Wrox Press, IBSN 1-861004-48-6) and Beginning SQL Server 2000 Programming (Wrox Press, ISBN 1-861005-23-7). This book specifically handles OLAP, data
warehousing, and data mining support in SQL Server, giving you all you need to know to learn these concepts, and become able to use SQL Server to build such solutions.
If you are a client-server application developer or designer who has worked on developing many online transaction processing (OLTP) systems, then this book will show you the differences between such systems and OLAP systems. It will also teach you how to leverage your skills in developing highly normalized databases for your OLTP systems to develop dimensional databases used as backends for OLAP systems.
What Does the Book Cover?
This book covers a wide array of topics, and includes many examples to enrich the content and facilitate your understanding of key topics.
The book starts with an introduction to the world of data modeling, with emphasis on dimensional data analysis, and also covers, at length, the different aspects of the Microsoft Analysis Services: OLAP database storage (MOLAP, ROLAP, HOLAP), OLAP cubes, dimensions and measures, and how they are built from within Analysis Services's front end, Analysis Manager.
There are two chapters that discuss Microsoft Data Transformation Services (DTS), and how it can be used in the M icrosoft data warehousing scheme (Chapters 7 and 8). The new Multidimensional Expressions (MDX) language that was introduced with the first release of Microsoft OLAP is discussed in Chapters 10 and 11.
Client tools are also discussed, in particular, the PivotTable Service (introduced in Chapter 12) and its integration with Microsoft OLAP and other Microsoft tools, such as Microsoft Excel, and development languages such as Visual Basic and ASP.
The book also covers the new data mining features added to SQL Server Analysis Services. It describes the new mining models, the client applications, related MDX functions, DTS package, and other programmable APIs related to data mining. Data mining is covered in Chapters 16 and 17.
Other topics covered in the book i nclude an introduction to data marts and how these concepts fit with the overall Microsoft data warehousing strategy; web housing and the BIA initiative, and using English Query with Analysis Services. Security, optimization, and administration issues are examined in the last three chapters of the book.
Please note that a range of appendices covering installation; MDX functions and statements; ADO MD; and XML and SOAP are also available from our web site: www.wrox.com.
We hope that by reading this book y ou will get a very good handle on the Microsoft data warehousing framework and strategy, and will be able to apply most of this to your specific projects.
What Do You Need to Use to Use This Book?
All you need to use this book is to have basic understandin g of data management. Some background in data warehousing would help too, but is not essential. You need to have SQL Server 2000 and Microsoft Analysis Services installed. Chapters 12 to 15 that center around the use of client tools require Microsoft Offic e XP and access to Visual Studio 6. Most of all, you need to have the desire to learn this technology that is new to the Microsoft world.
Conventions
Code has several fonts. If it's a word that we're talking about in the text – for example, when discussing a for
Sometimes we'll see code in a mixture of styles, like this:
for (int i = 0; i < 10; i++) {
Console.Write("The next number is: "); Console.WriteLine(i);
}
In cases like this, the code with a white background is code we are already familiar with; the line highlighted in gray is a new addition to the code since we last looked at it.
Advice, hints, and background information comes in this type of font.
Important pieces of information come in boxes like this.
Bullets appear indented, with each new bullet marked as follows:
q Important Words are in a bold type font
q Words that appear on the screen, or in me nus like the File or Window, are in a similar font to the one you would see on a Windows desktop
q Keys that you press on the keyboard like Ctrl and Enter, are in italics
Customer Support
We always value hearing from our readers, and we want to know what you think about this book: what you liked, what you didn't like, and what you think we can do better next time. You can send us your comments, either by returning the reply card in the back of the book, or by e-mail to [email protected]. Please be sure to mention the book title in your message.
How to Download the Sample Code for the Book
When you visit the Wrox site, http://www.wrox.com/, simply locate the title through our Search facility or by using one of the title lists. Click on Download in the Code column, or on Download Code on the book's detail page.
Errata
We've made every effort to make sure that there are no errors in the text or in the code. However, no one is perfect and mistakes do occur. If you find an error in one of our books, like a spelling mistake or a faulty piece of code, we would be very grateful for feedback. By sending in errata you may save another reader hours of frustration, and of course, you will be helping us provide even higher quality information. Simply e-mail the information to [email protected]; your information will be checked and if correct, posted to the errata page for that title, or used in subsequent editions of the book.
To find errata on the web site, go to http://www.wrox.com/, and simply locate the title through our Advanced
Search or title list. Click on the Book Errata link, which is below the cover graphic on the book's detail page.
E-mail Support
If you wish to directly query a problem in the book with an expert who knows the book in detail then e-mail
[email protected], with the title of the book and the last four numbers of the ISBN in the subject field of
the e-mail. A typical e-mail should include the following things:
q The title of the book, the last four digits of the ISBN, and the page number of the problem in the
Subject field.
q Your name, contact information, and the problem in the body of the message.
We won't send you junk mail. We need the details to save your time and ours. When you send an e-mail message, it will go through the following chain of support:
q Customer Support – Your message is delivered to our customer support staff, who are the first people to read it. They have files on most frequently asked questions and will answer anything general about the book or the web site immediately.
q Editorial – Deeper queries are forwarded to the technical editor responsible for that book. They have experience with the programming language or particular product, and are able to answer detailed technical questions on the subject. Once an issue has been resolved, the editor can post the errata to the web site.
q The Authors – Finally, in the unlikely event that the editor cannot answer your problem, he or she will forward the request to the author. We do try to protect the author from any distractions to their writing; however, we are quite happy to forward specific requests to them. All Wrox authors help with the support on their books. They will e-mail the customer and the editor with their response, and again all readers should benefit.
The Wrox Support process can only offer support on issues that are directly pertinent to the content of our published title. Support for questions that fall outside the scope of normal book support is provided via the community lists of our http://p2p.wrox.com/ forum.
p2p.wrox.com
Particularly appropriate to this book are the sql_language, sql_server and sql_server_dts lists.
To subscribe to a mailing list just follow these steps:
1.
Go to http://p2p.wrox.com/2.
Choose the appropriate category from the left menu bar3.
Click on the mailing list you wish to join4.
Follow the instru ctions to subscribe and fill in your e-mail address and password5.
Reply to the confirmation e -mail you receiveAnalysis Services in SQL Server
2000 – An Overview
Data warehousing is an expanding subject area with more and more companies realizing the potential of a well set up OLAP system. Such a system provides a corporation with the means to analyze data in order to aid tasks such as targeting sales, projecting growth in specific areas, or even calculating general trends, all of which can give it an edge over its competition. Analysis Services provides the tools that you as a developer can master, with the aid of this book, so that you become a key player in your corporation's future.
Before we delve into Analysis Services, this chapter will introduce you to general OLAP and
data-warehousing concepts, with a particular focus on the Microsoft contribution to this field. To this end we will consider the following:
q What is Online Analytical Processing (OLAP), what are its benefits, and who will benefit from it most?
q What is data warehousing, and how does it differ from OLAP and operational databases?
q What are Online transactional processing (OLTP) Systems?
q Challenges rising from the flood of data generated at the corporate and departmental levels resulting in need for decision support and OLAP Systems
q What is data mining and how does it relate to decision support systems and business intelligence?
What is OLAP?
Let's answer the first question you have in mind about On-Line Analytical Processing (OLAP), which is simply, "What is OLAP?"
Transaction-handling (operational) databases such as those handling order processing or share dealing, have gained great popularity since the mid 1980s. Many corporations adopted these databases for their mission-critical data needs. Almost all of these operational databases are relational. Many database vendors supported relational databases and produced state-of-the-art products that made using such databases easy, efficient, and practical.
As a result, many corporations migrated their data to relational databases, which were mainly used in areas where transactions are needed, such as operation and control activities. An example would be a bank using a relational database to control the daily operations of customers transferring, withdrawing, or depositing funds in their accounts. The unique properties of relational databases, with referential integrity, good fault recovery, support for a large number of small transactions, etc. contributed to their widespread use.
The concept of data warehouses began to arise as organizations found it necessary to use the data they collected through their operational systems for future planning and decision-making. Assuming that they used the operational systems, they needed to build queries that summarized the data and fed management reports. Such queries, however, would be extremely slow because they usually summarize large amounts of data, while sharing the database engine with every day operations, which in turn adversely affected the performance of operational systems. The solution was, therefore, to separate the data used for reporting and decision making from the operational systems. Hence, data warehouses were designed and built to house this kind of data so that it can be used later in the strategic planning of the enterprise.
Relational database vendors, such as Microsoft, Oracle, Sybase, and IBM, now market their databases as tools for building data warehouses, and include capabilities to do so with their packages. Note that many other smaller database vendors also include warehousing within their products as data warehousing has become more accepted as an integral part of a database, rather than an addition. Data accumulated in a data warehouse is used to produce informational reports that answer questions such as "who?" or "what?" about the original data. As an illustration of this, if we return to the bank example above, a data warehouse can be used to answer a question like "which branch yielded the maximum profits for the third quarter of this fiscal year?" Or it could be used to answer a question like "what was the net profit for the third quarter of this fiscal year per region?"
While data warehouses are usually bas ed on relational technology, OLAP enables analysts, managers, and executives to gain insight into data through fast, consistent, interactive access to a wide variety of possible views of information. OLAP transforms raw data to useful information so that it reflects the real factors affecting or enhancing the line of business of the enterprise.
Raw data is collected, reorganized, stored, and managed into a data warehouse that follows a special schema, whereupon OLAP converts this data t o information that helps make good use of it. Advanced OLAP analyses and other tools, such as data mining (explained in detail in Chapters 16 and 17), can further convert the information into powerful knowledge that allows us to generate predictions of the future performance of an entity, based on data gathered in the past.
E.F. Codd, the inventor of relational databases and one of the greatest database researchers, first coined the term OLAP in a white paper entitled "Providing OLAP to User Analysis: An IT Mandate", published in 1993. The white paper defined 12 rules for OLAP applications. Nigel Pendse and Richard Creeth of the OLAP Report
(http://www.olapreport.com/DatabaseExplos ion.htm) simplified the definition of OLAP applications as those
that should deliver fast analysis of shared multidimensional information (FASMI). This statement means:
q Fast: the user of these applications is an interactive user who expects the delivery of the
information they need at a fairly constant rate. Most queries should be delivered to the user in five seconds or less, and many of these queries will be adhoc queries as opposed to rigidly predefined reports. For instance, the end user will have the flexibility of combining several attributes in order to generate a report based on the data in the data warehouse.
q Analysis: OLAP applications should perform basic numerical and statistical analysis of the data. These calculations could be pre-defined by the application developer, or defined by the user as ad hoc queries. It is the ability to conduct such calculations that makes OLAP so powerful, allowing the addition of hundreds, thousands, or even millions of records to come up with the hidden information within the piles of raw data.
q Shared: the data delivered by OLAP applications should be shared across a large user population, as seen in the current trend to web-enable OLAP applications allowing the generation of OLAP reports over the Internet.
q Multidimensional: OLAP applications are based on data warehouses or data marts built on multi-dimensional database schemas, which is an essential characteristic of OLAP.
q Information: OLAP applications should be able to access all the data and information necessary and relevant for the application. To give an example, in a banking scenario, an OLAP application working with annual interest, or statement reprints, would be required to access historical
transactions in order to calculate and process the correct information. Not only is the data likely to be located in different sources, but its volume is liable to be large.
What are the Benefits of OLAP?
OLAP tools can improve the productivity of the whole organization by focusing on what is essential for its growth, and by transferring the responsibility for the analysis to the operational parts of the organization.
In February 1998, ComputerWorld magazine reported that Office Depot, one of the largest office equipment suppliers in the US, significantly improved its sales due to the improved on-line analytical processing (OLAP) tools it used directly in its different stores. This result came at a time when the financial markets expected Office Depot's sales to drop after a failed merger with one of its competitors, Staples. ComputerWorld reported that the improved OLAP tools used by Office Depot helped increase sales a respectable 4% for the second half of 1997. For example, Office Depot found that it was carrying too much fringe stock in the wrong stores. Therefore, the retail stores narrowed their assortment of PCs from 22 to 12 products. That helped the company eliminate unnecessary inventory and avoid costly markdowns on equipment that was only gathering dust.
The Office Depot example is a strong indication of the benefits that can be gained by using OLAP tools. By moving the analyses to the store level, the company empowered the store managers to make decisions that made each of these stores profitable. The inherent flexibility of OLAP systems allowed the individual stores to become self-sufficient. Store managers no longer rely on corporate information systems (IS) department to model their business for them.
Developers also benefit from using the right OLAP software. Although it is possible to build an OLAP system using software designed for transaction processing or data collection, it is certainly not a very efficient use of developer time. By using software specifically designed for OLAP, developers can deliver applications to business users faster, providing better service, which in turn allows the developers to build more applications.
Another advantage of using OLAP systems is that if such systems are separate from the On-Line Transaction Processing (OLTP) systems that feed the data warehouse, the OLTP systems' per formance will improve due to the reduced network traffic and elimination of long queries to the OLTP database.
In a nutshell, OLAP enables the organization as a whole to respond more quickly to market demands. This is possible because it provides the ability to model real business problems, make better -informed decisions for the conduct of the organization, and use human resources more efficiently. Market responsiveness, in turn, often yields improv ed revenue and
profitability.
Who Will Benefit from OLAP?
OLAP tools and applications can be used by a variety of organizational divisions, such as sales, marketing, finance, and manufacturing, to name a few.
The finance and accounting department in an organization can use OLAP tools for budgeting applications, financial performance analyses, and financial modeling. With such analyses, the finance department can determine the next year's budget to accurately reflect the expenses of the organization and avoid budget deficits. The department can also use its analyses to reveal weakness points in the business that should be eliminated, and points of strength that should be given more focus.
The sales depart ment, on the other hand, can use OLAP tools to build sales analysis and forecasting
applications. These applications help the sales department to realize the best sales techniques and the products that will sell more than others.
The marketing department may use OLAP tools for market research analysis, sales forecasting, promotions analysis, customer analysis, and market/customer segmentation. Such applications will reveal the best markets and the markets that don't yield good returns. They will also help decide where a given product can be marketed versus another product. For instance, it is wise to market products used by a certain segment of society in areas where people belonging to this segment are located.
The information delivered by OLAP applications usually reflects complex relationships and is often calculated on the fly. Analyzing and modeling complex relationships is practical only if response times are consistently short. In addition, because the nature of data relationships may not be known in advance, the data model must be flexible, so that it can be changed according to new findings. A truly flexible data model ensures that OLAP systems can respond to changing business requirements as needed for effective decision-making.
What are the Features of OLAP?
As we saw in the previous section, OLAP applications are found in a wide variety of functional areas o f an organization. However, no matter what functions are served by an OLAP application, it must always have the following elements:
q Multidimensional views of data (data cubes)
q Calculation-intensive capabilities
q Time intelligence
Multidimensional Views
Business models are multidimensional in nature. Take the Office Depot example: several dimensions can be identified for the business of that company; time, location, product, people, and so on. Since sales, for example, can differ in time from quarter to qua rter, or from year to year, the time dimension, therefore, has several levels within it. The location, or geography dimension, can also have multiple levels such as city, state, country, and so on. The product dimension is no different from the previous two dimensions. It can have several levels, such as categories (computers, printers, etc.), and more refined levels (printer cartridge, printer paper, etc.).
This aspect of OLAP applications provides the foundation to 'slice and dice' the data, as well as providing flexible access to information buried in the database. Using OLAP applications, managers should be able to analyze data across any dimension, at any level of aggregation, with equal functionality and ease. For instance, profits for a particular month (or fiscal quarter), for a certain product subcategory (or maybe brand name) in a particular country (or even city) can be obtained easily using such applications. OLAP software should support these views of data in a natural and responsive fashion, insulating users of the information from complex query syntax. After all, managers should not have to write structured query language (SQL) code, understand complex table layouts, or elaborate table joins.
The multidimensional data views are usually referred to as data cubes. Since we typically think of a cube as having three dimensions, this may be a bit of a misnomer. In reality data cubes can have as many dimensions as the business model allows. Data cubes, as they pertain to Microsoft SQL Server 2000 Analysis services, will be discussed in detail in Chapter 2.
Calculation-Intensive
While most OLAP applications do simple data aggregation along a hierarchy like a cube or a dimension, some of them may conduct more complex calculations, such as percentages of totals, and allocations that use the hierarchies from the top down. It is important that an OLAP application is designed in a way that allows for such complex calculations. It is these calculations that add great benefits to the ultimate solution.
OLTP (On-Line Transaction Processing) systems are used to collect and manage data, while OLAP systems are used to create information from the collected data that may lead to new knowledge. It is the ability to conduct complex calculations by the OLAP applications that allows successful transfer of the raw data to information, and later to knowledge.
Time Intelligence
Time is a universal dimension for almost all OLAP applications. It is very difficult to find a business model where time is not considered an integral part. Time is used to compare and judge performance of a business process. As an example, performance of the eastern re gion this month may be compared to its performance last month. Or, the profits of a company in the last quarter may be judged against its profits in the same quarter of the previous year.
The time dimension is not always used in a similar way to other dimensions. For example, a manager may ask about the sales totals for the first two months of the year, but is not likely to ask about the sales of the first two computers in the product line. An OLAP system s hould be built to easily allow for concepts like "year to date" and "period over period comparisons" to be defined.
When time is considered in OLAP applications, another interesting concept is that of balance. A balance of the computers built in a quarter will be the sum of the computers built in the individual months of the quarter. So, if the company built 20 computers in January, 10 in February, and 25 in March, the balance of computers built for the first quarter will be 20 + 10 + 25 = 55 computers. On the other hand, the balance of cash flow for a quarter will usually be the ending balance at the end of the quarter regardless of the cash flow balance of the individual months in the quarter. So, if the balance at the end of January is $20,000, at the end of February is $15,000, and at the end of March is $25,000, the balance for the end of the quarter will be $25,000. Lastly, the balance of employees in a quarter will usually be the average balance of the number of employees in the company in the individual months. So, if the number of employees in January is 10, in February 8, and in March 15, the balance of employees for the first quarter will be (10 + 8 + 15)/3 or 11.
First Quarter, 1999 11 (Average) 55 (Summation) $25,000 (End Value)
What is a Data Warehouse?
Not only does the data warehouse store data collected from the corporate OLTP applications, but it may also store data generated by the OLAP reports. Such data is canned as snapshots at a certain point in time and stored in the data warehouse to facilitate quick retrieval.
Data Warehouse vs. Traditional Operational Data Stores
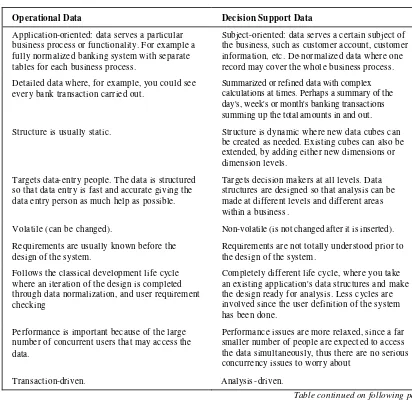
The data warehouse differs from operational database systems in many ways. One of the main differences between these two types of systems is the data collected in each of them. In operational systems (OLTP systems), the data is called operational data and is constantly in a state of flux, while in the data warehouse, the data is usually referred to as decision supportdata and remains relatively static. The table below summarizes the main differences between operational data found in OLTP systems and decision support data found in a data warehouse.
Operational Data Decision Support Data
Application-oriented: data serves a particular business process or functionality. For example a fully normalized banking system with separate tables for each business process.
Subject-oriented: data serves a certain subject of the business, such as customer account, customer information, etc. De-normalized data where one record may cover the whol e business process.
Detailed data where, for example, you could see every bank transaction carried out.
Summarized or refined data with complex calculations at times. Perhaps a summary of the day's, week's or month's banking transactions summing up the total amounts in and out.
Structure is usually static. Structure is dynamic where new data cubes can be created as needed. Existing cubes can also be extended, by adding either new dimensions or dimension levels.
Targets data-entry people. The data is structured so that data entry is fast and accurate giving the data entry person as much help as possible.
Targets decision makers at all levels. Data structures are designed so that analysis can be made at different levels and different areas within a business.
Volatile (can be changed). Non-volatile (is not changed after it is inserted).
Requirements are usually known before the design of the system.
Requirements are not totally understood prior to the design of the system.
Follows the classical development life cycle where an iteration of the design is completed through data normalization, and user requirement checking
Completely different life cycle, where you take an existing application's data structures and make the design ready for analysis. Less cycles are involved since the user definition of the system has been done.
Performance is important because of the large number of concurrent users that may access the data.
Performance issues are more relaxed, since a far smaller number of people are expect ed to access the data simultaneously, thus there are no serious concurrency issues to worry about
Transaction-driven. Analysis-driven.
Operational Data Decision Support Data
Must be highly available for the end users (back-up and recovery plans are very well planned).
Does not have the same degree of high availability requirement and plans for back-up and recovery are more relaxed.
Usually retrieved in units or records at any given time. This leads to processing only a small amount of data in any given process (transaction)
Usually retrieved in sets of records. This leads to processing large amounts of data in one single process (such as finding out a particular trend based on data collected over several years).
Reflects current situation. Reflects values over time (historical).
When managed (administered), it is usually managed as a whole.
Usually managed in pieces, or smaller sets.
We will now discuss the major differences between data-warehouse data and operational OLTP data.
Purpose and Nature
The data warehouse is subject -oriented, which means it is designed around the major subjects of the enterprise business. Traditional operational databases, on the other hand are usually process-oriented based on the functionality provided by the applications accessing them. For example, an operational system may be designed around processes like bank savings, loans, and other transactions, while a data warehouse may be organized around subjects like customer data, vendor data, activity data, etc.
The subject-orientation of the data warehouse makes its design different from the design of an operational database. As a result, the data warehouse design involves data modeling and database design . The business processes, which are the heart of the operational database design, do not affect the design process of the data warehouse.
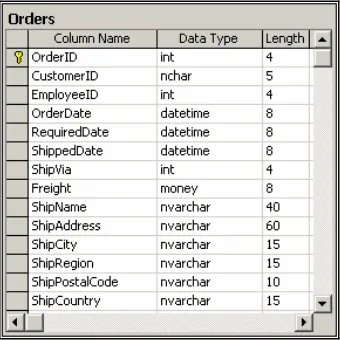
The data warehouse may exclude data that is not directly relevant to the decision support process. This data may be essential for the daily activities taking place in operational databases and is therefore included in them. For example, a banking OLTP database may include a lookup table about available statuses of a customer account. This table may be linked to other tab les lending them its primary key as a foreign key, which makes maintaining status information easy by maintaining only the lookup table. Thefollowing figure shows a sample of the data that may be contained in the status lookup table. The figure shows different fields that are
important for the OLTP system, such as the description of the status and the last two fields that keep track of who last updated the table, and when. In the data warehouse, data is not expected to change, and the different fields in the status table may not be needed. Instead, the StatusName field may be stored in the fact table
Data Structure and Content
Operational databases also differ from the data warehouse in their structure. Operational systems are usually designed to allow a large number of small transactions (OLT P systems). This requirement makes it necessary to optimise the database for data inserts, updates, and deletions. The most efficient way to do so is by normalizing the database tables according to E.F. Codd's rules. Further details on these rules can be found in Chapter 5.
The data warehouse, on the other hand, is not expected to be subject to updates and deletions; however, inserts may happen periodically when data is added to it. Improving the query performance against the data
warehouse may require that its tables be de-normalized so as to less strictly adhere to Codd's Rules.
Another aspect of the data structure in a data warehouse stems from the very nature of OLAP systems. Specifically, OLAP's multi-dimensional dat abase that stores data represented by multi-dimensional views, and the complex calculations that take place in such systems, mean that the data structures built may take the database down to a design where it is possible to move in different directions for investigation. This is in stark contrast to OLTP which is very flat in its design.
Most OLAP applications are intended for interactive use, and users of these applications expect to get a fast response to queries (ideally, not more than a few seconds). This is simple to achieve if queries only have to retrieve information from a database, reformat it, and present it to a user, but gets slower and more complicated if a significant amount of calculation work has to be done to service the query. This might include hierarchical consolidation, calculations of variances, analyzing trends, deriving computed measures, and so on. As the amount of calculations performed on the data increases, so does the time it takes to get the query results. This becomes more apparent as calculations involve a larger number of items retrieved from the database.
In order to get a fast response, all large multidimensional applications need to pre-calculate at least some of the information that will be needed for analysis. This might, for example, include high-level consolidations needed for reports or adhoc analyses, and which involve too much data to be calculated on the fly. In multi-dimensional databases, the storage of pre -calculated data is usually automatic and transparent. O LAP systems typically store such aggregations in what are called OLAPcubes (explained in detail in the next
chapter).There are some OLAP systems that store the data in the same ways OLTP system, usually referred to as relationalOLAP (ROLAP) systems, normally using summary tables. The summary tables store similar pre-calculated and pre-aggregated information to that stored by a multi-dimensional database. Again, although the details of the implementation differ, there is no difference in principle between multi-dimensional
databases and ROLAP products in this regard.
The figure above shows that the OLTP system holds detailed information about the transaction. What we are not able to see is that the transaction table is linked to many other tables according to certain relationships. The data warehouse stores the collective transactions over time after selecting the important pieces of data to store, and performing some transformation on it. In the figure, we see that the data warehouse stores each customer with the date when they opened an account, the total number of transactions, and the total bank charges as a result of these transactions. The data in the data warehouse is used to generate the OLAP data, which shows the number of transactions for the bank customers for each month. For a bank manager, the information drawn from this analysis concerns whether their bank is serving more transactions, or not, over time.
Data Volume
This rule is not always the case. You may find that a corporation is using its OLTP system as the backend for its analysis tools. In this case, the data warehouse and the OLTP have the same size. This practice is not
recommended, because optimizing the database for transaction processing will degrade its performance in analytical processing, and vice versa. Performance tuning will be discussed in Chapter 20.
Data storage volume is not the only difference between operational OLTP systems and data warehouses. The volume of data processed when retrieval occurs is also extremely different. With OLTP systems, a small amount of data is retrieved for every performed transaction. In data warehouses and OLAP systems, a large set of data may have to be processed when queries are issue d against the data store. The data is retrieved in sets, rather than in small units as is the case with OLTP systems.
Timeline
OLTP systems depict the current state of the business. For example, a banking OLTP system will hold records that show the current customer accounts, and the daily transactions that take place around them. The data warehouse for the same bank, on the other hand, will store historical information about bank customers, accounts, and activities over a long period of time. Data is retrieved from the data warehouse as snapshots in time.
How Data Warehouses Relate to OLAP
In the OLAP section you read that the OLAP services and tools are usually used to convert the enterprise raw data stored in the data warehouse into information and knowledge within the OLAP service. The data warehouse is the storage area that OLAP may tap into to do its analyses. Data is fed into the data warehouse over time from operational systems using many techniques. In the process, the data is said to be scrubbed and transformed. This transformation and scrubbing is done because the raw data in the operational system may not be in the format and shape that can lead to efficient storage in the data warehouse, or efficient analyses by the OLAP tools. Furthermore, if the data was collected from several sources before storing it into the data warehouse, inconstancies in the data have to be resolved. An example is one of the sources storing states by their abbreviation (CA for California), and other sources using the full state name.
The data warehouse, thus, still holds raw data. OLAP systems aggregate and summarize such data making good use of it as we saw earlier in the chapter, by organizing it in OLAP cubes or other forms of special storage that allow for fast retrieval of the "information" expected from a query or report.
Data Warehouses and Data Marts
Today's corporations strive to conduct their business on a national and global basis. We see companies that originated in the US expanding their business across the oceans to Europe, Asia, and Africa. Business expansion creates the need to access corporate data from different geographical locations in a timely manner. For example, a salesperson who is working in Texas for a company based in California may need instant access to the enterprise database to identify names of potential customers in Texas, or to retrieve certain information that would help in selling the product to an existing Texan customer when meeting with them.
q Some corporations completely replace the concept of having a data warehouse with that of having smaller data marts that can be fed with the data they need from the operational systems.
q Other companies use data marts to complement their data warehouses by moving data into them from the data warehouse allowing for more efficient analysis based on criteria such as department, geographical area, time period, etc.
q Finally, some corporations use their data marts as the first stage of storing operational data. The data is then replicated from all of the corporate data marts into a central "enterprise" data warehouse. Such a data warehouse then evolves over time as the data marts continue to be built to cover as many aspects of the company business as needed.
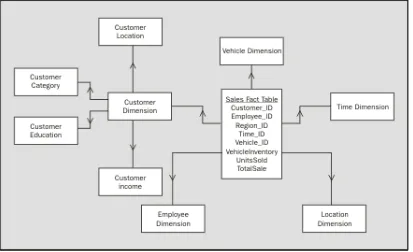
The figure below shows a typical data warehouse/OLAP system architecture. The following three figures show how this architecture changes to accommodate the introduction of data marts according to the strategies discussed above. First, we have a diagram depicting a typical data warehouse/OLAP system architecture with no data marts.
In the next diagram of a typical data mart/OLAP system architecture, the data marts are populated with data from the data warehouse:
Each one of these solutions has its relevant advantages and disadvantages to the companies that adopted it. No matter what the solution is, data marts usually have similar characteristics to those of the data warehouse, except for the data volume. Actually, due to the smaller data volume and focus in the subject matter, queries are usually faster to run in data marts as opposed to the data warehouse.
However, where you will see data warehouses have the greatest advantage is being able to analyze areas of information and allow that analysis to be seen from different viewpoints, where in the OLTP system, this may not be possible due to the lack of summary data.
Data Mining
Many corporations accumulate the data they collect in the process of their daily operations in a data warehouse and data marts for analysis reasons. The analyses they co nduct on the stored data help the managers in the decision making process. One relatively new, but powerful, concept that has started to gain popularity in the business intelligence (BI) world is data mining. With data mining, managers find out aspects and facts about their business that may not be evident otherwise. Data mining establishes relationships between business elements that may seem completely unrelated.