EU-FP7-iMARS: analysis of Mars multi-resolution images using auto-coregistration, data
mining and crowd source techniques: processed results – a first look
Jan-Peter Muller 1, Yu Tao1, Panagiotis Sidiropoulos1, Klaus Gwinner2, Konrad Willner2, Lida Fanara2, Marita Waehlisch2, Stephan van Gasselt3, Sebastian Walter3, Ralf Steikert3, Bjoern Schreiner3, Anton Ivanov4, Federico Cantini4, Jessica Wardlaw5,
Jeremy Morley5, James Sprinks5, Michele Giordano5, Stuart Marsh5, Jungrack Kim6, Robert Houghton7, Steven Bamford8
1
Imaging Group, Mullard Space Science Laboratory, University College London, Holmbury St Mary, Surrey, RH56NT, UK 2
DLR, Deutsches Zentrum für Luft - und Raumfahrt EV, Rutherfordstrasse, 2 Berlin - 12489 Germany 3
Freie Universität Berlin, Malteserstrasse, 74-100 Berlin – 12249, Germany 4
École Polytechnique Federale de Lausanne, ELD 014, Station 11 Lausanne – 1015, Switzerland 5
The Nottingham Geospatial Institute, University of Nottingham, Nottingham, NG7 2TU, UK 6
University of Seoul, Jeonnong Dong 90 Dongdaemun Gu Seoul - 130 743, Republic of Korea 7
Human Factors Research Group, University of Nottingham, Nottingham, NG7 2RD, UK 8
School of Physics and Astronomy, University of Nottingham, Nottingham, NG7 2RD, UK ([email protected])
Commission IV, WG VI/4/8
KEY WORDS: automated DTM and co-registration,multi-resolution DTM + ORI, CTX, HiRISE, HRSC, webGIS
ABSTRACT:
Understanding planetary atmosphere-surface exchange and extra-terrestrial-surface formation processes within our Solar System is one of the fundamental goals of planetary science research. There has been a revolution in planetary surface observations over the last 15 years, especially in 3D imaging of surface shape. This has led to the ability to overlay image data and derived information from different epochs, back in time to the mid 1970s, to examine changes through time, such as the recent discovery of mass movement, tracking inter-year seasonal changes and looking for occurrences of fresh craters.
Within the EU FP-7 iMars project, we have developed a fully automated multi-resolution DTM processing chain, called the Co-registration ASP-Gotcha Optimised (CASP-GO), based on the open source NASA Ames Stereo Pipeline (ASP) [Tao et al., this conference], which is being applied to the production of planetwide DTMs and ORIs (OrthoRectified Images) from CTX and HiRISE. Alongside the production of individual strip CTX & HiRISE DTMs & ORIs, DLR [Gwinner et al., 2015] have processed HRSC mosaics of ORIs and DTMs for complete areas in a consistent manner using photogrammetric bundle block adjustment techniques. A novel automated co-registration and orthorectification chain has been developed by [Sidiropoulos & Muller, this conference]. Using the HRSC map products (both mosaics and orbital strips) as a map-base it is being applied to many of the 400,000 level-1 EDR images taken by the 4 NASA orbital cameras. In particular, the NASA Viking Orbiter camera (VO), Mars Orbiter Camera (MOC), Context Camera (CTX) as well as the High Resolution Imaging Science Experiment (HiRISE) back to 1976. A webGIS has been developed [van Gasselt et al., this conference] for displaying this time sequence of imagery and will be demonstrated showing an example from one of the HRSC quadrangle map-sheets.
Automated quality control [Sidiropoulos & Muller, 2015] techniques are applied to screen for suitable images and these are extended to detect temporal changes in features on the surface such as mass movements, streaks, spiders, impact craters, CO2 geysers and Swiss Cheese terrain. For result verification these data mining techniques are then being employed within a citizen science project within the Zooniverse family. Examples of data mining and its verification will be presented.
1
Corresponding Author [email protected]
1. INTRODUCTION
1.1 Background and Context
Understanding the role of different planetary surface formation processes within our Solar System is one of the fundamental goals of planetary science research. There has been a revolution in planetary surface observations over the last 15 years, especially in 3D imaging of surface shape. This has led to the ability to be able to overlay different time epochs back to the mid 1970’s, to examine time-varying changes, such as the recent discovery of mass (e.g. boulder) movement, tracking inter-year seasonal changes and looking for occurrences of fresh craters.
To track these changes whether manually or automatically using data mining on the planet Mars, it is important to be able to be able to process data from different sensors and therefore address issues of processing massive datasets with different noise characteristics, image resolution, lighting conditions, coverage and locational accuracy. The goal of our work is to be able to maximize the exploitation of the available planetary datasets to enable improved understanding of the geology and geomorphology of the Martian surface. To achieve this goal requires that we can develop the necessary algorithms and processing software to generate a time series of co-registered images to an image map-base taking into account terrain relief distortion effects due to the rugged topography of the surface, in this case Mars.
The ESA HRSC instrument has been acquiring imagery since January 2004. HRSC is the first true photogrammetric mapping instrument around Mars (Gwinner et al., 2010). HRSC has retrievals and orthorectified Images (ORIs) being processed to the best resolution possible. This results in DTMs from 50-150m and in ORIs from 12.5-50m. As part of the bundle adjustment process, all the HRSC 3D positions are co-located with the global reference system determined by the MOLA instrument resulting in planimetric accuracy at the subgrid point level (≈9-25m RMS) (loc.cit.). geomorphological features, when trying to examine time-varying phenomena, it does not allow any easy inter-comparison of features other than in a side-by-side manual fashion and does not at all allow for automated inter-comparison or “flickering” of time series to look for changes.
Therefore within iMars, a fully automated co-registration processing chain has been developed (Sidiropoulos & Muller, 2016) to register salient points from the last 40 years of NASA imagery to HRSC ORIs covering the same area and the HRSC DTMs are subsequently employed to orthorectify the NASA
imagery. These auto-coregistered ORIs (ACRO’d) are then input into a change detection processing chain. This chain processes all the co-registered ACRO images to detect change according to ordering all of the images into a timeline. Preliminary examples of this are shown later in this paper. For NASA CTX and HiRISE occasional stereo (≈4,500 pairs to date covering around 3% of the surface) are also being processed including being ACRO’d to HRSC (always using CTX-to-HRSC first and then HiRISE-to-CTX subsequently) to ensure that all images of higher resolution are still co-registered to the global reference system form HRSC. A webGIS is being developed to display browse products from these high quality co-registered Digital Terrain Models (DTM) and corresponding terrain-corrected images, OrthoRectified Images (ORI). Slope Linae) and polar avalanches (here called mass movements hereafter) over the last 40 years of NASA observations.
Figure 1 An example of identified changes on Mars showing the context of iMars project. Courtesy of the HiRISE team.
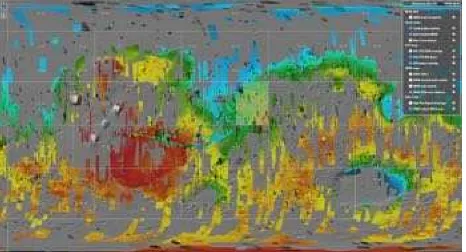
The EU-FP7 iMars website (http://www.i-mars.eu) shows examples of this seamless set of co-registered image and 3D products of the surface including a webGIS system to display the HRSC DTM products as shown in Figure 2 .
Figure 2. An example of the iMars web-GIS system showing HRSC DTM products, CTX stereo coverage, and MC11-E DTM mosaic in the middle of the map.
In the rest of this paper examples will be shown of some of the novel products generated within the project.
1.2 Dataset Overview
The global reference of our multi-resolution DTM production is MOLA data, which is considered to be the best global Mars 3D reference model to date. Individual MOLA tracks have been interpolated and extrapolated to yield a global MOLA DTM with a spatial resolution of up to 128 grid-points per degree (~460m) with a vertical resolution of 2-13m.
The HRSC on Mars Express comprises nine channels that together in a single pass collect multicolour images of the Martian surface and at multiple angles, allowing stereo colour images to be produced from single orbit observations. DLR generated along-track orbital strip DTMs (at grid-spacing from 50-150m) and ORIs (up to 12.5m/pixel) in Sinusoidal projection system by processing the raw HRSC data using radiometric de-calibration, noise removal, image matching, geo-referencing and photogrammetric processing. Where orbital strips are selected, along-track Bundle Adjustment (BA), has been applied and such products are labelled as “Level-4 Version 50+” when the products reach a satisfactory level of quality. The v50+ HRSC DTMs use the MOLA reference sphere with a radius of 3396.0 km.
In iMars, the v50 HRSC ORI/DTM has been employed for most of the sites as a reference base map for subsequent cascaded CTX/HiRISE DTM production. More recently, with increasingly dense HRSC coverage, DLR has generated a large area mosaic over the US Geological Survey’s MC11-E area (~100 stereo pairs), which covers two of the four ExoMars 2018 landing site candidates. The MC11-E HRSC DTM mosaic uses Equidistant Cylindrical projection with grid spacing of 50m for DTM and colour image, and 12.5m for panchromatic image. DLR’s MC11-E DTM and ORI are based on the same set of procedures for image filtering and rectification, least squares matching, strip BA, and calculation of 3D points applied for single strip data products, and additionally include bundle block adjustment, joint interpolation of multi-scale 3D point sets, and photometric correction and image normalisation to an external brightness standard (Thermal Emission Spectrometer albedo). Gwinner et al. (2015) describe these processes in more detail.
The MRO CTX currently captures single panchromatic grey-scale images at ~6m/pixel over a swath-width of 30km. The CTX images are usually acquired at the same time as HiRISE so the stereo coverage is very limited also. UCL have processed CTX stereo pairs for a number of sites at the time of writing including MER-A, MER-B, MSL, Viking-1, Viking-2, MPF, and Phoenix to derive ORI (6m) and DTMs of 18m/grid point resolution using the ASP software in early 2013 within the EU FP-7 Planetary Robotics Vision Data Exploitation (PRoViDE) project. CTX ORI and DTM are essential for accurate HiRISE to HRSC co-registration. In late 2015, within the iMars project, CTX stereo pairs for MER-A, MER-B, MSL were reprocessed at UCL using an optimised CASP-GO processing chain (Tao et al., 2016), which brings CTX ORI and DTM to a higher level of quality. More recently, a total of 69 CTX stereo pairs over the MC11-E area have been processed at UCL using the CASP-GO system (loc.cit.)
On the other hand, the NASA MRO HiRISE camera is designed to take very detailed orbital images of Mars. HiRISE uses 14 CCDs including 10 red channels, 2 blue-green channels, and 2 NIR channels. The nominal maximum size of the red images is about 20,000 x 126,000 pixels and 4,000 x 126,000 pixels for
Sidiropoulos & Muller (2016) show examples of the application of Auto-Co-Registration using Orthorectified images (ACRO’d) to the MC-11E map-sheet. We show detailed examples below.
1.3 Pipeline Overview
The automated DTM processing chain, called the Co-registered Ames Stereo Pipeline with Gotcha refinement and Optimization (CASP-GO) is described in Tao & Muller (2016). The Automated Co-Registration and Orthorectification (ACRO) system is described in detail in Sidiropoulos & Muller (2016). These descriptions will not be repeated here. Instead some assessment of their potential for global application will be discussed.
The UCL-MSSL Imaging Group computing consists of a 14-blade cluster, 10 of which have 16-cores with 48 Gb RAM and 1 Tb disk-space and 4 of which have 24 cores with 96 Gbytes pairs in around the same 6 day time period. Extrapolating this to the whole ≈200,000 dataset (estimated from half of the Martian surface being covered by HRSC DTMs & ORIs suggests that ACRO’ing all the NASA imagery to the ≈50% of the Martian surface can be accomplished within the timescales of the project but generating the ≈2,000 CTX DTMs and ORIs will not be achievable. HiRISE scenes which are some 100 times larger than CTX can only be processed for limited areas where repeat observations have been made. Alternative processing facilities are currently being sought to address this processing “gap”.
2. IMARS PROCESSING RESULTS
2.1 CASP-GO CTX DTMs and ORIs
The CASP-GO processing chain described in Tao & Muller (2016) was tested/applied to stereo CTX (6m) imagery over the MER, MSL and the large area mosaic over the US Geological Survey’s MC11-E area (~100 stereo pairs).
The CASP-GO output includes DTM, ORI and a number of ARCgis® feature, they demonstrate the excellent co-registration of the CTX and HRSC products. This comes from the last stage of the processing chain when the CTX DTMs and ORIs are co-registered to the HRSC basemap. Figure 4 shows the same DTMs as separate colourised hill-shaded DTM browse products whilst Figure 5 shows a zoom-up of one of these CTX DTMs and ORIs. Please note the scale-bar. All products have North at the top and are on a Cylindrical projection.
Figure 3. Overview of some of the processed CTX DTMs elevations superimposed on the top of the MC-11E HRSC DTM mosaic. Note that ARCgis used for this display adjusts each greyscale via the CTX elevation range irrespective of the overall DTM range.
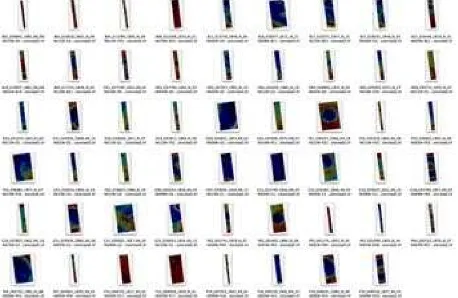
Figure 4. Example of some of the MC11-E CTX DTM browser products using colourised by height hill-shaded images of many of the CTX DTMs.
Figure 5 An example of one of the MC11-E CTX DTM and ORI products from CASP-GO pipeline for the CTX stereo-pair B11_013756_1848_XI_04N002W-G09_021905_1848_XN_04N002W
2.2 ACRO Examples of CTX and HRSC imagery and change detected automatically using data mining
As discussed in Sidiropoulos & Muller (2016) some 8,000 NASA imagery from MOC-NA, THEMIS-VIS and CTX were co-registered to the MC11-E and an example superimposition of 4 overlapping CTX ORIs is shown in this work. Unfortunately, NASA images over this mosaic showed very few change features. We therefore focus on other areas where change has been detected using single-strip HRSC v50+ HRSC products.
In particular, we show examples in Figure 6 of the robustness of the auto-coregistration processing chain over part of the MER-A frame where there were multiple CTX frames. The HRSC scene (shown in the lower row, rightmost panel) was acquired on 3-Apr-2007 and this scene was used to co-register 5 subsequently acquired CTX scenes which are shown in time order from top-left across the columns and then down the rows as follows: 6-Oct-2007, 12-Feb-2009, 15-Feb-2010, 4-Mar-2011 and 24-Jun-2013.
These individual images were then employed to search automatically for changes over time. The resultant 6 pairs of CTX iamge fragments over areas where change was automatically detected are shown in Figure 7. The time
sampling of these frames is insufficient to track individual dust devil features but change can be obviously observed.
P12_005601_1653_X I_14S184W
B06_011943_1653_ XN_14S184W
B18_016677_1653_ XN_14S184W
G09_021569_1653_ XN_14S184W
D13_032395_1654_
XN_14S184W H4165_0000_ND4 Figure 6. Zoom-in showing the results of automated co-registration of 5 CTX images (the 3 panels of the top-row and the two most left panels of the bottom row) to a common HRSC baseline (H4165_0000_ND4). The mapped region is a 15X11 km area which is part of the MER-A landing site. The North is on the top.
Figure 7. Six examples of changes between the two most left top-images of Figure 6 (P12_005601_1653_XI_14S184W and B06_011943_1653_XN_14S184W) which were automatical -ly detected from the change detection pipeline. All panels show areas of 768X768 metres, with the North being at the top. Panels are split in half by a vertical dark line. The left sub-panel shows P12_005601_1653_XI_14S184W while the right to B06_011943_1653_XN_14S184W
In order to apply such change detection techniques for the discovery of features not previously observed, we need to ensure that we can reproduce results which have been manually obtained. An example of this is shown in Figure 8 which shows a small image feature automatically detected using the change detection algorithm applied to a HRSC ORI taken 3 years before a CTX image observed the impact crater. This crater is listed in Daubar et al. (2013) and shows that the automated change detection algorithm can reproduce previous manual detections.
Figure 8. 64 x 64 image fragment of HRSC (left) H2963_0000 (2-May-2006) and from the CTX image B12_014321_2095_XN_29N310W (16-Aug-2009) show -ing an automatically detected impact crater.
3. IMARS DISSEMINATION
The iMars CASP-GO DTM and ORI products as well as ACRO products are being available through a DOI referenced open access system via the iMars webGIS platforms. These products will also eventually be released through the NASA PDS data archiving centres through the NASA “APPS” programme. An example screenshot of some of the HRSC products are shown in Figure 9 which displays the CTX stereo coverage as well as the MC11E HRSC mosaic and Figure 10 which shows the repeat high resolution image coverage over Gale crater, scene of the MSL Curiosity rover. The repeat image coverage is derived using the methods described in Sidiropoulos & Muller (2015).
Figure 9 An example of the iMars web-GIS system showing HRSC DTM products, CTX stereo coverage, and MC11-E DTM mosaic in the middle of the map.
Figure 10. An example of the repeat coverage map shown in the iMars webGIS centred around Gale crater (white area).
We are also building on the huge momentum, developed within the Zoouniverse system by building a “MarsZoo” project for mass public participation in the feature mapping of Mars. We
will apply this mass participation by citizen scientists to the labelling of the changes which are automatically detected to enable “deep learning” processes to obtain the best possible labels of the changes detected.
4. SUMMARY AND REMAINING WORK
In this paper, we have introduced the iMars project results at just after the three-quarters stage of the project. Results have been shown of the fully automated CASP-GO DTM and ORI production system along with results of co-registered and orthorectified products from the automated ACRO production system. Preliminary results are also shown of the automated change detection system both verifying obvious changes from dust devils and from an impact crater detected previously.
The ACRO automated co-registration and orthorectification system is planned to be applied to the 50% of Mars which have HRSC products. It is hoped this will be complete by the end of the iMars project. The CASP-GO automated DTM pipeline is about to start processing a large fraction of the CTX stereo pairs accumulated to date in a matter of several months on the UCL-MSSL imaging Linux cluster of 224 cores. We hope that we are given access to large-scale cloud computing resources to apply the CASP-GO to a large number of HiRISE stereo-pairs of major scientific interest, which show change features. The ACRO and CASP-GO software could also be applied to the ExoMars Trace Gas Orbiter 2016 CaSSiS instrument colour stereo views in future.
ACKNOWLEDGEMENTS
The research leading to these results has received funding from the European Union’s Seventh Framework Programme (FP7/2007-2013) under iMars grant agreement n˚ 607379 as well as partial funding from the STFC “MSSL Consolidated Grant” ST/K000977/1.
REFERENCES
Daubar, I. et al., (2013) “The current martian cratering rate,” Icarus, vol. 225, no. 1, pp. 506–516.
Gwinner, K., et al., (2010) “Topography of Mars from global mapping by HRSC high-resolution digital terrain models and orthoimages: Characteristics and performance,” Earth and Planetary Letters, vol. 294, pp. 506–519.
Gwinner, K. et al. (2015), “The first Quadrangle of the Mars Express HRSC Multi-Orbit Data Products (MC-11-E)”, European Planetary Science Congress.
Sidiropoulos, P. and J. P. Muller, (2015a) “On the status of orbital high-resolution repeat imaging of Mars for the observation of dynamic surface processes,” Planetary and Space Science, vol. 117, pp. 207–222, Jul. 2015.
Sidiropoulos, P., and J.-P. Muller (2015b) Automatic quality assessment of planetary images. European Planetary Science Congress.
Sidiropoulos, P., and J.-P. Muller (2016) Batch Co-Registration of Mars High-Resolution Images to HRSC MC11-E Mosaic. ISPRS 2016 Congress
Tao, Y., and J.-P. Muller (2016) An optimised system for generating multi-resolution DTMs using NASA MRO datasets. ISPRS 2016 Congress