AUTOMATED VOXEL MODEL FROM POINT CLOUDS
FOR STRUCTURAL ANALYSIS OF CULTURAL HERITAGE
G. Bitelli a, G. Castellazzi a, A.M. D’Altri a, S. De Miranda a, A. Lambertini a, I. Selvaggi a,*
a
Dept. of Civil, Chemical, Environmental and Materials Engineering (DICAM), University of Bologna, Viale Risorgimento 2, 40136 Bologna I
(gabriele.bitelli, giovanni.castellazzi, antoniomaria.daltri2, stefano.demiranda, alessandro.lambertini, ilenia.selvaggi2)@unibo.it
Commission V, WG V/2
KEY WORDS: Cultural Heritage, Buildings, Point cloud, Voxel, Terrestrial laser scanning, Structural analysis, FEM, Mesh generation
ABSTRACT:
In the context of cultural heritage, an accurate and comprehensive digital survey of a historical building is today essential in order to measure its geometry in detail for documentation or restoration purposes, for supporting special studies regarding materials and constructive characteristics, and finally for structural analysis. Some proven geomatic techniques, such as photogrammetry and terrestrial laser scanning, are increasingly used to survey buildings with different complexity and dimensions; one typical product is in form of point clouds. We developed a semi-automatic procedure to convert point clouds, acquired from laserscan or digital photogrammetry, to a filled volume model of the whole structure. The filled volume model, in a voxel format, can be useful for further analysis and also for the generation of a Finite Element Model (FEM) of the surveyed building. In this paper a new approach is presented with the aim to decrease operator intervention in the workflow and obtain a better description of the structure. In order to achieve this result a voxel model with variable resolution is produced. Different parameters are compared and different steps of the procedure are tested and validated in the case study of the North tower of the San Felice sul Panaro Fortress, a monumental historical building located in San Felice sul Panaro (Modena, Italy) that was hit by an earthquake in 2012.
1. INTRODUCTION 1.1 3D surveying of historical buildings
In this paper we present an approach to efficiently process geometric information of complex objects, such as historical buildings with irregular geometry. A full three-dimensional acquisition of both exterior and interior of those buildings is nowadays common in the field of cultural heritage (Núñez Andrés and Buill Pozuelo, 2009; Guarnieri et al., 2013). These surveys along with other techniques allow to promote documentation and preservation operations and are critical to monitor the building after a particular accident, for example a natural disaster, or in general to support policies of maintenance and restoration (Arias et al., 2007). This is achievable with different geomatic techniques, in a fast but also accurate manner. A laser scanner or photogrammetric survey of an ancient masonry building may be furthermore combined in a multidisciplinary context with other techniques, such as radar interferometric modeling, in order to study the dynamic behavior and produce an FE model (Pieraccini et al., 2014).
Our approach aims at delivering a full three-dimensional model of the building, following a linear and semi-automatic workflow that gives a fast pace to otherwise laborious operations. For instance, there are cases where urgent rehabilitation interventions are required in damaged structures affected by seismic events. The presented procedure can process the acquired data available as a dense point cloud in order to deliver a numerical model suitable for a Finite Element Method (FEM) analysis for the building structure.
* Corresponding author
1.2 Point Clouds management
The result of a full three-dimensional survey is, in its simplest form, a dense point cloud. This is commonly achievable using a Terrestrial Laser Scanner (TLS), digital photogrammetric techniques and Structure from Motion (SfM) approach. The choice of the proper technique, the post-processing of the data and the combined use of multidisciplinary techniques (Sánchez-Aparicio et al., 2016) depends on the context and other parameters to consider that are not discussed in this paper. In our case several point clouds were acquired from a TLS with a precision in the order of a few millimeters, on the coordinates of the single points. Regardless of the technique chosen for the survey, a three-dimensional point cloud with comprehensive data acquired both from the exterior and from all the interior spaces of the building is expected as the input for the workflow described in the following chapters.
Nowadays building information modeling (BIM) interoperability has reached a significant level of maturity. Processing high density point clouds, derived both from photogrammetric and laser scanning surveys (Oreni et al., 2014), it's possible to produce very detailed BIM models. However, there is still the lack of complete algorithms able to perform an automated processing from point clouds to structural simulation based on FEM (Barazzetti et al., 2015). In another application, a validation for models reconstructed from point clouds, restricted to façades, was carried out (Truong-Hong and Laefer, 2013).
Nevertheless, different experimental tests indicate that further work is needed to increase the level of automation, e.g. to better discriminate real openings from data occlusions (Tang et al., 2010; Hinks et al., 2013). Therefore, the BIM models automatically produced from point clouds cannot directly be used The International Archives of the Photogrammetry, Remote Sensing and Spatial Information Sciences, Volume XLI-B5, 2016
in FE software. In fact, several manual corrections are needed to avoid mesh local distortions or small elements and to guarantee the correct representation of complex architectural objects. Providing algorithms that are both robust and capable to operate with few manual intervention, in order to fill holes, close gaps and remove intersection, requires an appropriate interpretation based on the object investigated (Attene et al., 2013).
This procedure starts from a number of different point clouds, acquired from outside and inside the historical building with a heterogeneous distance from the instrument to the surface of the walls. All the data are then merged and georeferenced in a unique cloud with a more regular point distribution. A mesh is computed for the entire building, with inner and outer surfaces. One of the main problems in this phase is the presence of holes in the mesh, due to data missing in the point cloud for occlusions in the line of sight between the sensor and the surface to acquire; this problem is furthermore present for buildings damaged after disasters or in a serious state of decay. These holes do not allow to properly define, for a whole complex building, an accurate filled model using automatic procedures. In order to better analyze the polygonal model, our procedure aims to simplify a complex three-dimensional geometry into a series of two-dimensional closed polygons from sequential sections of the building obtained with a constant spacing. The final step is to convert automatically each polygonal section into a raster model that discriminates filled areas from void areas. All the raster sections stacked in the proper order produce a new three-dimensional volumetric model of the building, in a voxel format, useful for FEM analysis.
The accuracy of the result depends on the chosen resolution of each pixel in the two-dimensional sections and each voxel in the three-dimensional model.
1.3 Case Study
The paper focuses on the San Felice sul Panaro Fortress, a monumental historical building located in San Felice sul Panaro (Modena, Italy) that was hit by the Emilia Earthquake which presented two magnitude peaks on 2012-05-20 and 2012-05-29. The Fortress is characterized by a typical quadrilateral plant with corner towers, of which the principal tower (Mastio) place in the Southeast corner. The building dates back to the fourteenth and fifteenth centuries. This paper focuses attention on the North tower, which was damaged in a greater part of its external walls (Figure 1), as well as the roof almost completely collapsed. The North tower is composed of three floors, with inter-floors characterized by vaults (Figure 2).
2. METHOD 2.1 Automated Model
The semi-automatic procedure, called CLOUD2FEM, starts from a survey of a building and generates a Finite Element model (Castellazzi et al., 2015). This procedure allows a rapid processing of the three-dimensional point cloud data following a specific workflow in order to produce a voxel model. The resulting structural discretization guarantees the generation of 3D finite element meshes as well as their mechanical characterization. As a result, a large reduction in the required time in comparison to CAD-based modeling procedures is achieved. A geometrical and structural validation of the method was carried out on a masonry tower application and the findings show good reliability and effectiveness of the mesh generation approach (Castellazzi et al., 2016a).
Figure 1. Floorplan of the San Felice sul Panaro Fortress: North Tower highlighted
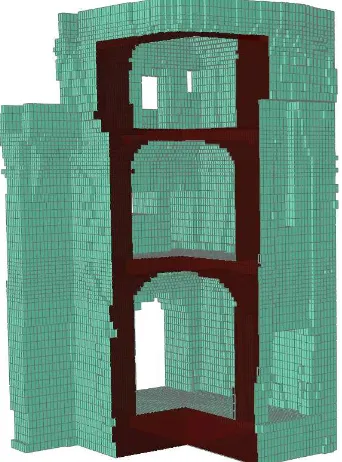
Figure 2. Seismic damages to the North Tower of the San Felice sul Panaro Fortress
2.2 Workflow
The input data is a comprehensive three-dimensional point cloud for the whole building, both from the exterior and interior spaces. Each point of the cloud is conveniently referred to a reference system with X, Y, Z coordinates. A first operation on the data is through a sampling algorithm (in our case Poisson-disk sampling) in order to produce a new point cloud with a more regular density, starting from the original that typically presents strong variations of density related to the acquisition distance between the sensor and detected surface. A brief cleaning phase follows, with different tools but always supervised by an operator that has knowledge over the surveyed object, in order to delete The International Archives of the Photogrammetry, Remote Sensing and Spatial Information Sciences, Volume XLI-B5, 2016
all the points not useful for the subsequent analysis: neighboring structures, vegetation, terrain and outliers. Then a first polygonal mesh is computed from the point cloud using appropriate procedures and parameters. The result is a continuous surface that represent the outer shell and interior shell of the whole structure. One of the main problems in this phase is the presence of holes in the mesh, due to data missing in the point cloud for occlusions in the line of sight between the sensor and the surface to acquire; this problem is furthermore present for buildings damaged after disasters or in a serious state of decay. At this stage we do not care to obtain a perfectly closed and topologically correct mesh, since it would require a great amount of manual intervention in a three-dimensional environment by a qualified operator in relation to the complexity of the structure. Nevertheless, these holes do not allow to properly define, for a whole complex building, an accurate filled model using automatic procedures. The operator intervenes one last time at this stage resolving eventual problems found during the mesh construction phase. Then an automatic decimation procedure is performed in order to reduce the complexity of the mesh, though ensuring the correct representation the specificities of the geometry of the structure. In order to better analyze the polygonal model, our procedure aims to simplify a complex three-dimensional geometry into a series of two-dimensional closed polygons from sequential sections of the building obtained with a constant spacing. A reference plane (X, Y) is fixed in a convenient orientation: in most cases it is efficient to consider the plane parallel to the floors of the building, but in some scenarios could be also oriented parallel to the walls. Other planes, called slices, are created parallel to the reference at a given regular distance ∆ along the Z-axis. The value of ∆ depends on the desired resolution for the Finite Element model. The number of slices must be sufficient to cover the whole building. The intersection between each slice and the polygonal model generates lines. A density of points are distributed along each line and a further cleaning operation is performed only on the points in order to assess eventual geometric irregularities. Then only the points belonging to the perimeter of interior surfaces and rooms of the building are selected for each slice. A concave hull model is computed around those points, representing the internal perimeter of the slice. Another concave hull model is computed around all the points in the plane, representing the external perimeter of the slice. In this phase a couple of closed two-dimensional geometries are obtained for each slices: one for the external perimeter and one for the internal perimeter of the section. The difference between these two geometries, subtracting the internal from the external, represent a closed surface that contains the material of the building. Until now all the data processed are in vector format: points, lines and areas. In this final step, each slice previously processed is finally converted into two-dimensional regular pixel grids at a constant resolution along X and Y axes. All the pixel grids are then gradually stacked in sequence creating a complete voxel model of the whole structure. At this stage it is also possible to assign different values to pixels in order to define the materials of different structural elements of the model (Figure 3).
2.3 New Proposed Approach
In this paper we propose a new approach, tested in our case study, in order to minimize operator intervention in the workflow previously described. The most time-consuming task, in which an operator is required to supervise the processing using specific tools, corresponds to the slice cleaning and split phases. These previously described operations, are repeated for each slice in the model. Therefore, the global processing time is directly correlated to the number of slices to process. The main challenge for the approach was to lower the number of slices to process,
while strictly describing the whole structure surveyed. Our approach can be efficiently applied to different structures and contexts.
The basic idea is to define a principal extension of the structure to process and to slice the point cloud along that direction. In order to achieve this result, the data is processed in different detail and resolution, depending on the context. Initially the structure is sliced with a parameter 2Δ as the distance between any given slice and the following (Figure 4).
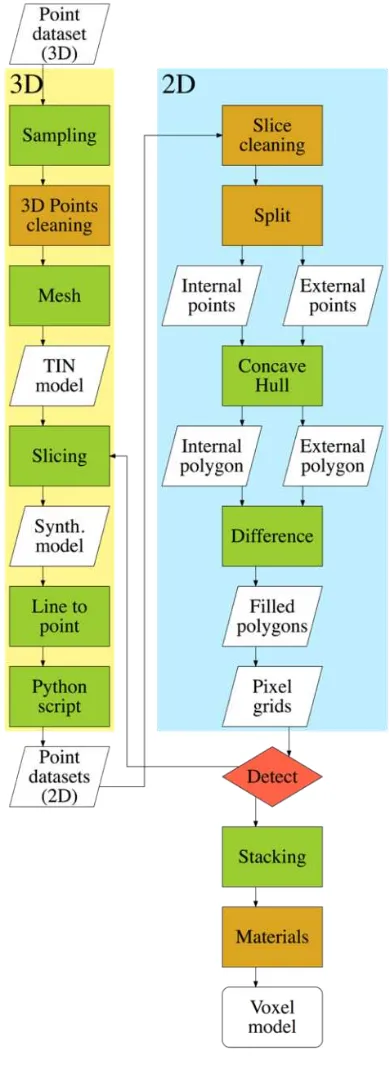
Figure 3. Flowchart for the proposed method: completely automated procedures (green), semi-automated or manual procedures (orange) and the algorithm for the new proposed
approach (red)
Figure 4. Visualization of the stacking layer concept
The specific value of the parameter 2Δ is carefully chosen for the context of operations and depending on the result to achieve during the structural analysis. An automatic script parses all the slices converted in pixel grids and compare the adjacent ones with image analysis techniques. If the difference between the two compared slices is evaluated under a certain threshold, then the algorithm proceeds to compute the following couple of adjacent slices. Only when the difference between the couple of slices is over the threshold, then the algorithm detects a significant variation in the structure between the two levels.
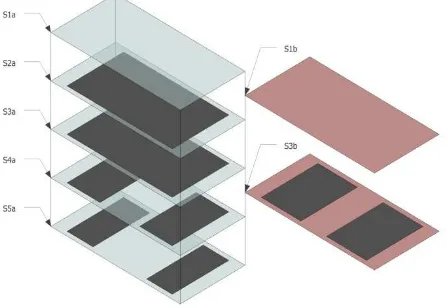
In the example shown in Figure 5 is possible to observe how the section selected with the slice changes: from ‘S1a’ to ‘S2a’ and from ‘S3a’ to ‘S4a’ there were significant variations over the threshold. For this reason, new slices ‘S1b’ and ‘S3b’, highlighted in red, should be processed respectively.
Figure 5. Concept of slicing threshold
Therefore, in this particular case a distance of 2Δ between the two slices is subdivided equally and another slice is added at a step of 1Δ, as visualized in Figure 6.
This procedure allows to process less data and reduce the time needed to analyze the simpler and regular part of the structure. At the same time, it allows to describe with a higher precision all the special features of the building: curved surfaces, vaults, floors height or walls thickness. This is achieved by having a variable resolution of the analysis along the axis perpendicular to the slices.
Figure 6. New displacement of the slices
3. ASSESSMENT OF RESULTS 3.1 Seismic Damages
In our case study the new proposed approach was applied to a simple structural element with a vertical extension: the north tower of the San Felice sul Panaro Fortress. Nevertheless, the tower presents interesting features to analyze, such as the different vaults at various levels and the whole building has an irregular geometry and a complex structure due to its construction, which took place in several stages over different centuries. Furthermore, the tower was heavily damaged during the earthquake (Figure 2).
The Terrestrial Laser Scanner survey was arranged after the 2012 earthquake, in order to better understand the problems of the structure and to plan rehabilitation interventions. Therefore, the analysis has become more complex after the earthquake, because of the presence of debris in some interior rooms, which appears also in the original three-dimensional point cloud. The peculiarity of the irregular geometry of the monumental building and its structure with different constructive elements necessitated appropriate consideration.
3.2 Geometric Analysis
The new proposed approach has been particularly useful in analyzing the vaults with greater detail. In particular, we started from three-dimensional point cloud overall and georeferenced of the Fortress. The survey was performed by ABACUS s.a.s., using a FARO FOCUS 3Dx300 laser scanner, and a total station Trimble S6. 163 point clouds have been acquired by different scanning positions around and inside the whole Fortress, using the laser scanner. These scans are aligned to the topographic network through correlation with the reference targets, resulting in millimetric precision. Using the software Gexcel JRC 3D Reconstructor, following the first decimation, the aforementioned clouds were merged into a unique cloud containing more than 40 million points. Therefore, we have reduced the initial point cloud, using the Poisson-disk sampling algorithm, from more than 40 million of points, to around 3.2 million, with a regular spatial sampling of 0.050 m. The next operation was to clean the point cloud, removing all point except those of North tower. The point cloud has been reduced by this operation to little more than 990 thousand points. Then, the next The International Archives of the Photogrammetry, Remote Sensing and Spatial Information Sciences, Volume XLI-B5, 2016
step was to create a three-dimensional model that consists of continuous surfaces. In this study, the polygonal model has been realized using the TIN mesh. Considering the point (x, y, z) in the space, the conjunction between them is realized with lines forming adjacent triangles in order to represent the object with a continuous surface. With a specific software, a polygonal model is created, that consists of 1.9 millions of triangles. In this study, the polygonal model has been realized using the TIN mesh. In order to reduce the number of triangles, a series of operations (such as decimation) were made to simplify the three-dimensional model which guarantee the correct geometry of the structure. Others operations (self-intersections of triangles, closure of small holes…) have been carried out to solve problems defined during the creation of mesh model. Through these operations, the final model obtained consist of about 1.5 million triangles.
The north tower, as already mentioned, shows some issues, such as the collapse of the roof and damage to much of the structure along its height. For these reasons, in order to obtain the full volume of the structure, filling the gap between the external and internal surface, it has been necessary an interim operation. Therefore, the polygonal model was cut along the Z-axis through horizontal slices (x, y) at a constant distance from each other (2∆= 250 mm) for the entire height of the tower. In the most significant areas, in the specific case the vaults, more slices with 1∆=125 mm increment have been inserted, to better define their variable geometry. The distance between two adjacent slices has to be chosen according to the desired final resolution of the FE model. The resulting stacking sequence is composed of 70 horizontal slices (Figure 7).
Figure 7. Mesh with slices at variable distance
By inspecting every single slice in GIS software (in this case, QGIS has been used), it appears very easy to find and properly clean every slice from points that do not belong to the building, but have been inevitably acquired during the scanning. Using our procedure, by creating a concave hull that envelopes the internal points from the outside, the presence of internal debris or any furniture located inside the room is irrelevant, because each new shape is based on the peripheral points. This operation is fundamental to obtain a closed shape for each slice, directly using
the geometry provided from the previous step, without any smoothing. This part of the procedure is semi-automatic: the manual intervention is essential at this stage for an accurate separation between internal points and external points: this is especially true with data from complex buildings, such as the one analyzed.
The proposed workflow aims at minimizing manual intervention in terms of time in order to maximize the efficiency of the procedure itself. Therefore, we reduce a three-dimensional problem to a two-dimensional problem.
3.3 Global Voxel Model
Once the slices have been created and processed in GIS software, we need to introduce the discretization procedure in order to set up the desired FE model. Thereby, we propose to discretize first the two-dimensional sections and then to use them to build the three-dimensional discretized model. This procedure allows the reconstruction of the original three-dimensional geometry by stacking all of its slices, so a complete volumetric representation of the object is obtained by acquiring a contiguous set of slices. Each slice has been idealized as a digital image composed of picture elements (pixels), so the stacking of these slices generates the volume elements (voxels). The resolution of digitalization of each slice is of 125 mm; this value is chosen according to the characteristics of the object to be analyzed. In this case study, in particular, it is more or less the half of a brick that composes the masonry (Figure 8).
Figure 8. Voxel model: a section cut shows the different floors and their vaults
The resulting dataset is simple and easy to use with the finite element technique: each voxel is automatically transformed into an eight-node hexahedral finite element. This assumption produced a fine FE model which counts 119547 elements and 141525 nodes. Such a model is simple to be used for every kind of FE analyses.
3.4 Structural Analysis
The obtained three-dimensional voxel model is tested with a structural analysis. In order to evaluate the effectiveness of the The International Archives of the Photogrammetry, Remote Sensing and Spatial Information Sciences, Volume XLI-B5, 2016
proposed method, a preliminary linear static analysis under dead loads is performed. From a practical point of view, this procedure is very efficient and can be considered expeditious since allows to immediately identify critical stress states peaks that a building with collapsed portions may present also under dead loads. The results of the analysis in terms of maximum principal and vertical stresses are collected in Figure 9 and Figure 10, respectively.
Figure 9. Maximum principal stress contour plot (Pa).
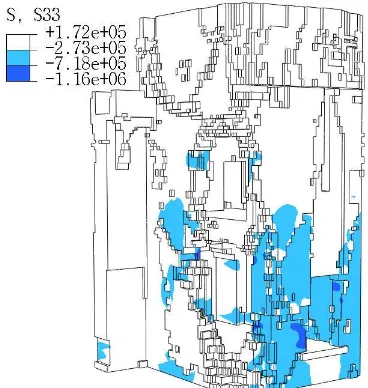
In particular, Figure 9 shows that relevant tensile stress peaks appear in proximity to the collapsed parts indicating a critical structural condition. Similarly, Figure 10 points out the resulting stress peaks, in terms of vertical compression, which are clearly due to the lack of some portions of wall of the tower.
Figure 10. Vertical stress contour plot (Pa).
Therefore, through the proposed procedure it is possible to straightaway understand the main criticalities of the structure which can be very useful, for instance, to address first-aid structural interventions. Furthermore, more advanced structural analyses with complex constitutive models (Castellazzi et al. 2016b), as well as a comprehensive vulnerability assessment of the structure, could be performed on the same FE mesh.
4. CONCLUSIONS
A new technique to generate an FE model from a three-dimensional point cloud of a complex building has been discussed and applied to study the North Tower of a Fortress damaged by the 2012 Emilia earthquake. The tests carried out in the experimental case study illustrate both the potential advantages and limitations of the proposed approach. The resulting discretized geometry contains all of the information to use with a FEM procedure, including the mechanical properties associated with the material features, and guarantees the automatic generation of a reliable FE solid model. The generated models are currently used to support the conservation for the damaged building. In addition, it should be emphasized that with our approach, also users without advanced structural skills are able to complete the described analysis. We can assert that the proposed procedure is a speedy solution of a complex structure FE model generation problem, especially in the field of cultural heritage, and is furthermore designed to be independent of any particular software. We also expect that this procedure can be efficient even for commercial and industrial applications. Taking this into account, further research will focus on the development of algorithms allowing a more complete automation of the entire procedure.
REFERENCES
Arias, P., Armesto, J., Di-Capua, D., González-Drigo, R., Lorenzo, H., Pérez-Gracia, V., 2007. Digital photogrammetry, GPR and computational analysis of structural damages in a mediaeval bridge. Eng. Fail. Anal. 14, 1444–1457. doi:10.1016/j.engfailanal.2007.02.001
Attene, M., Campen, M., Kobbelt, L., 2013. Polygon Mesh Repairing: An Application Perspective. ACM Comput. Surv. 45, 1–33. doi:10.1145/2431211.2431214
Barazzetti, L., Banfi, F., Brumana, R., Gusmeroli, G., Oreni, D., Previtali, M., Roncoroni, F., Schiantarelli, G., 2015. BIM from Laser Clouds and Finite Element Analysis: Combining Structural Analysis and Geometric Complexity. ISPRS - Int. Arch. Photogramm. Remote Sens. Spat. Inf. Sci. XL-5/W4, 345–350. doi:10.5194/isprsarchives-XL-5-W4-345-2015
Castellazzi, G., D’Altri, A.M., De Miranda, S., Ubertini, F., Bitelli, G., Lambertini, A., Selvaggi, I., Tralli, A.M., 2016. A Mesh Generation Method for Historical Monumental Buildings: an Innovative Approach, in: Proceedings of VII European Congress on Computational Methods in Applied Sciences and Engineering, Crete Island, Greece.
Castellazzi, G., D’Altri, A.M., de Miranda, S., Magagnini, S., Tralli, A, 2016. On the seismic behavior of the main tower of San Felice sul Panaro (Italy) fortress, in: Proceedings of ICCMSE 2016, March 17-20, Athens, Greece.
Castellazzi, G., D’Altri, A., Bitelli, G., Selvaggi, I., Lambertini, A., 2015. From Laser Scanning to Finite Element Analysis of Complex Buildings by Using a Semi-Automatic Procedure.
Sensors 15, 18360–18380. doi:10.3390/s150818360
Guarnieri, A., Milan, N., Vettore, A., 2013. Monitoring Of Complex Structure For Structural Control Using Terrestrial Laser Scanning (Tls) And Photogrammetry. Int. J. Archit. Herit. 7, 54– 67. doi:10.1080/15583058.2011.606595
Hinks, T., Carr, H., Truong-Hong, L., Laefer, D.F., 2013. Point Cloud Data Conversion into Solid Models via Point-Based Voxelization. J. Surv. Eng. 139, 72–83. doi:10.1061/(ASCE)SU.1943-5428.0000097
Núñez Andrés, M.A., Buill Pozuelo, F., 2009. Evolution of the architectural and heritage representation. Landsc. Urban Plan.
91, 105–112. doi:10.1016/j.landurbplan.2008.12.006
Oreni, D., Brumana, R., Della Torre, S., Banfi, F., Barazzetti, L., Previtali, M., 2014. Survey turned into HBIM: the restoration and the work involved concerning the Basilica di Collemaggio after the earthquake (L’Aquila). ISPRS Ann. Photogramm. Remote Sens. Spat. Inf. Sci. II-5, 267–273. doi:10.5194/isprsannals-II-5-267-2014
Pieraccini, M., Dei, D., Betti, M., Bartoli, G., Tucci, G., Guardini, N., 2014. Dynamic identification of historic masonry towers through an expeditious and no-contact approach: Application to the “Torre del Mangia” in Siena (Italy). J. Cult. Herit. 15, 275– 282. doi:10.1016/j.culher.2013.07.006
Sánchez-Aparicio, L., Villarino, A., García-Gago, J., González-Aguilera, D., 2016. Photogrammetric, Geometrical, and Numerical Strategies to Evaluate Initial and Current Conditions in Historical Constructions: A Test Case in the Church of San Lorenzo (Zamora, Spain). Remote Sens. 8, 60. doi:10.3390/rs8010060
Tang, P., Huber, D., Akinci, B, Lipman, R., Lytle A., 2010. Automatic reconstruction of as-built building information models from laser-scanned. Automation in Construction, 19, 7, 829-843. doi:10.1016/j.autcon.2010.06.007
Truong-Hong, L., Laefer, D.F., 2013. Validating Computational Models from Laser Scanning Data for Historic Facades. J. Test. Eval. 41, 20120243. doi:10.1520/JTE20120243