A VIRTUAL HUB BROKERING APPROACH FOR INTEGRATION OF HISTORICAL
AND MODERN MAPS
N. Bruno a*, M. Previtali b, L. Barazzetti b, R. Brumana b, R. Roncella a
a Università degli Studi di Parma, Dipartimento di Ingegneria Civile, dell’Ambiente, del Territorio e Architettura, Parco Area delle
Scienze 181A, 43124, Parma, Italy – [email protected], [email protected]
b Politecnico di Milano, Department of Architecture, Built Environment and Construction Engineering, Via Ponzio 31, 20133
Milano, Italy - (raffaella.brumana, luigi.barazzetti, mattia.previtali)@polimi.it
Commission IV, WG IV/4
KEY WORDS: Open data, brokering, cadastral maps, HGIS, interoperability, web services
ABSTRACT:
Geospatial data are today more and more widespread. Many different institutions, such as Geographical Institutes, Public Administrations, collaborative communities (e.g., OSM) and web companies, make available nowadays a large number of maps. Besides this cartography, projects of digitizing, georeferencing and web publication of historical maps have increasingly spread in the recent years. In spite of these variety and availability of data, information overload makes difficult their discovery and management: without knowing the specific repository where the data are stored, it is difficult to find the information required and problems of interconnection between different data sources and their restricted interoperability limit a wide utilization of available geo-data.
This paper aims to describe some actions performed to assure interoperability between data, in particular spatial and geographic data, gathered from different data providers, with different features and referring to different historical periods. The article summarizes and exemplifies how, starting from projects of historical map digitizing and Historical GIS implementation, respectively for the Lombardy and for the city of Parma, the interoperability is possible in the framework of the ENERGIC OD project. The European project ENERGIC OD, thanks to a specific component - the virtual hub - based on a brokering framework, copes with the previous listed problems and allows the interoperability between different data sources.
* Corresponding author
1. INTRODUCTION
Geospatial data are today more and more widespread. Many different institutions, such as Geographical Institutes, Public Administrations, collaborative communities (e.g., OSM) and web companies, make available nowadays a large number of maps in many different formats (raster images, vector data, catalogues, textual data, etc.), using heterogeneous protocols and services based on different standards for discovery and access. At the same time, projects of digitizing, georeferencing and web publication of historical maps have increasingly spread in the recent years. Historical maps are indeed very important to know the past structure of territory and cities and their evolution over time, in order to cope efficiently with management and planning of urban areas and landscape preservation. Territory and urban areas are organism in continuous evolution, so to understand the on-going dynamics and relationships, the study of the current state is not sufficient. To this aim, historical GIS in the last decade proved to be one of the most promising frameworks, which can provide innovative tools and methodological approaches in this field, since they allow having a complete and exhaustive framework of the transformation occurred.
To mention some of the GIS projects realized in the recent years, in Europe noteworthy are the HGIS for the city of Lyon (France) (Gauthiez et al., 2009, 2014), the GBHGIS realized by the University of Portsmouth on the whole Great Britain territory (Gregory et al., 2002) and the GIS on historic estate atlases in the Netherlands (Heere, 2006). In Italy interesting HGIS concern medieval data related to Southern Italy (Carrion
et al., 2013), the city of Rome (Baiocchi et al., 2005; Lelo et al., 2005; Micalizzi et al., 2012), the city of Como (Brovelli et al., 2012) and the town of Cumiana (Torino) (Farruggia, 2009; Panzeri, 2008), for example.
Geoportals, webGIS, geodatabases, and historical atlases are thus available today in a large number, referring to both current mapping and historical one. In spite of these variety and availability of data, information overload makes difficult their discovery and management: from a user point of view, it is difficult to find the information required, without knowing the specific repository where the data are stored. In addition, even when the user knows the existence of data in specific repositories, problems of interconnection between different data sources and their restricted interoperability often limit a wide utilization of the data themselves (Zhao, 2010).
The paper describes the general concept of Virtual Hub adopted in ENERGIC OD and its application in order to facilitate the integration of ancient cadastres and modern cartography. This integration is exemplified through the description of two applications referred to historical datasets of the city of Parma (Italy) and Lombardy Region, related to current maps. In particular, the first case is intended to show the usability of a Historical GIS based on the cadastral maps of the city of Parma which is recently being extended to external users through the publication of Web Map Services (WMS).
The second case refers instead to the GeoPan Atl@s APP. It is an application that is aimed at providing to professional users (e.g., geologists, architects, urban planners) a set of datasets available for territorial and landscape management. In particular, GeoPan Atl@s provides both modern cartographic layers coming from regional/local Spatial Data Infrastructures (SDIs) and historical maps. Indeed, a set of land and territorial changes can be tacked by analysing historical maps and can be related to current maps.
2. THE BROKERING APPROACH: ENERGIC OD
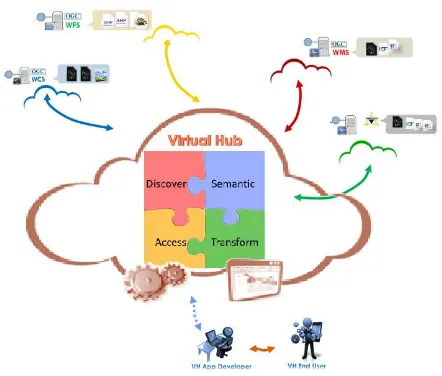
To overcame the heterogeneity of data sources the research activities conducted in the framework of the project ENERGIC OD make use of a novel approach based on the Virtual Hub concept. The term virtual hub is adopted referring to the hub-and-spoke distribution paradigm. An ENERGIC OD Virtual Hub (VH) is defined as a virtual node where users can seamlessly access potentially unlimited datasets by brokering heterogeneous geospatial data sources (ENERGIC-OD Consortium, 2015). In particular, these statements underline some key aspects of the Virtual Hub concept:
An ENERGIC OD Hub is virtual: this means that the data sources connected are not duplicated into a new infrastructure but are accessed in their original repository;
An ENERGIC OD VH accesses datasets in a seamlessly way heterogeneous geospatial data sources: the heterogeneity in data formats, standards and protocols is solved by the VH, allowing a higher interoperability between services and datasets; An ENERGIC OD VH can access potentially
unlimited datasets: the system is able to face the Big Data issue of data Volume allowing to access potentially unlimited datasets;
An ENERGIC OD VH is based on a brokering architecture: a software architecture adopting the (message) broker pattern is usually referred as a hub-and-spoke architecture;
An ENERGIC OD VH is aimed to connect heterogeneous geospatial data sources: different geospatial data sources can be connected by using a VH.
In particular, an ENERGIC OD VH is a solution able to reduce the interoperability problems between data providers and applications. It requires to extend the Service Oriented Architecture (SOA) archetype by introducing a new component that interconnects the different service protocols and standards, mediating their models and interface specifications. In addition, this component must work out all the necessary distribution and virtualization capabilities to lower the entry barriers for multidisciplinary applications. Specifically, ENERGIC OD VH, relies upon a Brokering approach (Nativi et al. 2013). A great advantage of the brokered approach, is that no common model
is defined, and each system can adopt or maintain their preferred interfaces, metadata and data models. Specific components (the brokers) are in charge of accessing the participant systems, providing all the required mediation and harmonization functionalities. The only interoperability agreement is the availability of documentation describing the published interfaces, metadata and data models. No (major) re-engineering of existing systems is required for connecting different services or other data sources.
The brokered approach allows communities-of-practice free from defining their own specifications, and mediating between different specifications. Obviously, mediation will happen at the lowest common level between specifications, but it is generally sufficient for most interdisciplinary applications. Obviously brokering is not magic, the complexity of interoperability is still there, but it is simply shifted from data/product users and providers towards the brokers. Data users and providers are set free of interoperability – i.e. they do not have to make their clients and server compliant with specifications anymore – but new components, the brokers, are in charge of handling all the complexity. This shift of complexity from clients/servers to brokers has two main advantages: (a) it implements the general engineering pattern called “separation-of-concerns”: where there is a specific functionality (interoperability), there should be a specific responsible (broker), (b) a third tier between clients and servers can host added-value services (e.g. semantics, data transformations). A broker is a mediator (Figure 1) which implements some services (i.e. discover, access, distribution, added value, etc.) to facilitate the interconnection between client and server components in a Client-Server architecture.
2.1 The Virtual Hub approach and interoperability
As stressed before, territory and city are complex systems in continuous evolution and transformation. To have a thorough understanding of the dynamics that have affected them, the study of ancient maps and a comparison with the modern ones is crucial.
So, to enhance usability of the historical data and to assure their interoperability with modern cartography, their accessibility through Virtual Hub becomes an essential requirement. Virtual Hub, in fact, ensures interoperability giving the users a single point of access with a standard protocol and interface.
In addition, to improve the feasibility of a concrete interrelation between modern and ancient cartography, in the same framework of the two case studies presented here, a census related to open data available today for the regions of Lombardy and Emilia Romagna had been made. In particular, the catalogue takes into account the data typology (e.g. raster map, vector, raw satellite image, etc.) and information about their availability and accessibility. Moreover, attention is paid on geographic coverage, metadata availability and their compliance to standard profiles. This aspect is particularly significant since it allows verifying the quality and usability of data.
Other information contained in the catalogue concerns the data discovery and access and general characteristics useful for Virtual Hub implementation, such as the URL, the Service Protocol and the reference system.
After the survey, many data have been discovered and now they can be used for analysis interrelated with historical cartography.
3. THE HISTORICAL GIS OF THE CITY OF PARMA
Historical cadastres are very important for the knowledge of the city over time, since they allow reconstructing the land use, the urban structure, the pre-existences and the distribution of property. Knowing deeply the urban and land structure and its evolution over time can address the choices in town planning, rebuilding, restoration, preservation and so on.
In spite of the undoubted importance of documentary sources for historical city knowledge, in general their direct consultation is difficult and very expensive in terms of time and effort in research. This because of problems related to conservation, lack of copies and reduced circulation, which limit the use of documents. To overcome these difficulties, today digital scans of maps and documents and informative systems based on historical data are increasingly widespread.
As far as the city of Parma is concerned, in the recent years the DICATeA of the University of Parma (research group members: Giorgia Bianchi, Nazarena Bruno, Carlo Mambriani, Riccardo Roncella and Andrea Zerbi), upon agreement with the city Archives, has promoted a project for the realization of a HGIS based on the cadastral maps of the city drawn between 1767 and 1940. In its very early stage the main purpose of the project was to provide a multi-user, low cost, information system for historians, architects, town planner etc., as a support for urban development studies, usable in a LAN (Local Area Network) that granted a more controlled access and consultation environment.
Now, a further improvement of the project, addressing the publication of the thematic maps and census data using web services, is in progress. In particular, HGIS information have to be easy accessible and queried by a wider range of users and must be usually related to other geo-data. In this context the possibility of relating the project with a brokering architecture, able to interconnect heterogeneous data sources and reduce barriers represented by different communication protocols and technologies, was considered critical.
3.1 The historical documents
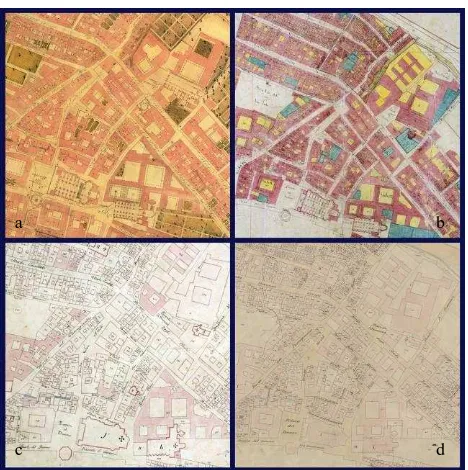
The Parma HGIS project is based on the digitization of the four historical cadastres of the city (see Figure 2), corresponding to key moments in its history: The Atlante Sardi (1767), the Catasto Borbonico (1853), the Catasto Postunitario (1901) and the Nuovo Catasto Edilizio Urbano (N.C.E.U.) (1940). The area under investigation corresponds to the ancient settlement of the city, i.e. the area within the walls demolished between the end of the Nineteenth century and the beginning of
the Twentieth. This area is depicted in all the four cadastres and so allows making queries referring to the same region. To focus on the single historical documents, the main aspects of each cadastre are briefly recalled below.
The Atlante Sardi is the first parcel geometric cadastre of the city, made between 1765 and 1767 by the cartographer Gian Pietro Sardi. Its realization, promoted by the minister Giullaume du Tillot during the first Bourbon government of the city (1749-1804) can refers to the general program of knowledge and renewal of the city, following the example of the previous cadastral surveys of Lombardy and Piedmont.
As far as the internal structure is concerned, the Atlas has a map of location in scale 1:5000 that represents the city within the surrounding area and 28 detail plates, approximately in scale 1:850. There is distinction between built and unbuilt areas and particular attention is given to religious buildings, where the micro-plans of the interiors are surveyed and represented, as a section of the ground floor with the drawing of the roofing system. Each of these 28 plates is complementary to another one containing the list of holders of each parcel drawn in the map.
The Catasto Borbonico is part of a wider series of cadastral surveys started during the government of Marie Louise and considered as a continuation of Napoleon cadastre. The cartographic corpus consists of eight maps in scale 1:1250, which represent each parcel with distinction between buildings and courtyards. The graphical representation is not homogeneous throughout the map sheets because different surveyors made the survey. The plates are accompanied by a register titled Tavola indicativa dei proprietarj di beni stabili nella città di Parma nel 1853. This document shows for all parcels the name of the owners and information about the real estate.
The third cadastre is commonly known as Catasto Postunitario, since it is the first cadastre realized after the Italian Unification. There is little information about its realization and also the date of its production is uncertain, but, from evidences, it is considered in the years between the Nineteenth and the Twentieth centuries. The city is represented in scale 1:1250 in
Figure 2. The four historical cadastres of Parma: a. Atlante Sardi, b. Catasto Borbonico, c. Catasto Postunitario, d. Nuovo
Catasto Edilizio Urbano.
a b
twelve sheets called Rettangoli. The content is similar to the two previous cadastres but with less details and ornaments in representation. While maps are more synthetic, the description of the parcels provided in the register is more detailed. The fourth cadastre consists of a corpus of varied and complex documents not directly consultable. The date of realization has been hypothesized on the basis of the represented city and assumed corresponding to 1940. The city is divided into 34 sheets (Fogli) in scale 1:1000 and the degree of detail of representation is similar to the Catasto Postunitario. Despite the cartographical corpus is comparable to the other cadastres analysed here, the system of archiving and updating information about parcels is more complex. Data about owners and real estate are not collected in a single volume, but distinct in different documents (Schedario delle Partite, Schedario dei possessori, Elenco degli immobili), now available on microfilm.
3.2 HGIS structuring and implementation
These datasets were scanned at high resolution (400 dpi) and georeferenced using the procedure described in (Bruno et al. 2015). For acquiring the Ground Control Points (GCP) for map registration the official Topographic Regional Cartography (CTR – nominal scale of 1:5000, reference system EPSG 23032) was used and a procedure derived from image block orientation in photogrammetry (and in particular in independent model adjustment) was adapted for the registration stage. For the registration, a very simple C# software code was developed, which integrates GCP and common points between the neighbouring plates, and a conformal transformation (Helmert 2D) model was applied.
After the georeferencing stage, the plates were mosaicked, having thus a unique and homogenous image of the city. Since it represents a different product from the original one and would not replace original maps, also radiometric corrections were applied to maps, to uniform as much as possible the general image of the city.
With respect to only the Atlante Sardi and Catasto Borbonico, each plate was digitized (Bruno N., 2014) through the vector draw of the polygonal features corresponding to buildings, unbuilt areas, parcels and blocks.
This process allowed the creation of a spatial database, in which every single element can be associated to thematic information gathered from the cadastral registers that accompany the maps. Simultaneously with the map vectorization, the cadastral registers were transcribed (Bruno N., 2014). The aim of this phase was to produce a digital transcription as close as possible to the original source, but, at the same time, standardized and tailored for their correct entry in the database.
As far as the database structure is concerned, despite the complexity and the heterogeneity of the data under investigation, due to the coexistence of more historical periods so distant in time, a unique database with the same structure for all the historical periods was adopted. In fact, despite the expense of the general compactness and consistency on individual sources, a more homogeneous database of all historical periods would allow diachronic queries more easily and the maintenance of an overall structure rather simple. With respect to the choice of the RDBMS (Relational DataBase Management System) for the system, we opted for a platform based on PostegreSQL, with PostGIS extension for spatial data management. The choice was made for several reasons: first of all, its open source nature allows containing costs connected to operation and maintenance of the system. Moreover, the opportunity not to be bound to a commercial solution provides
greater flexibility, so it is much easier to expand the level of interoperability with different GIS platforms.
3.3 Results and data publication
At the present state, all plates belonging to the four historical cadastres have been digitized, georeferenced and mosaicked. These maps can be overlapped to the modern cartography to make qualitative and quantitative analysis thanks to GIS software. In addition, it is possible to visualize their mosaics covering the entire city.
At the same time, only for the first two historical periods, it is possible to visualize the vector maps and query them based on the data collected from the cadastral registers, now stored in a Postgres database related to maps.
Data can be grouped in four categories: (i) data concerning the parcels, such as use and position, (ii) information regarding the owner(s) of property within the parcels, (iii) data about roads and (iv) information about archival references and historical documents themselves. All these data are not grouped, but related thanks to the logical connections in the database. Their aggregation results instead from queries performed on the database.
In particular, it is possible to query the system with different levels of complexity, starting from the simple display of the original maps, until the realization of more complex queries, on individual parcels or the whole city, as well as statistical and thematic analysis, related to the holders or to specific features concerning spatial data.
These three levels of access to data (referring to the single georeferenced plate, to the all mosaicked plates, or to the vector and thematic maps) give the system the added value compared to the bare consultation of the original sources. While recognizing the irreplaceable value of the original documents, the information system provides an undoubted help to the consultation, allowing, in addition, overlying different maps and making interrelated analysis of multiple sources and historical thresholds. Moreover, the digitization of historical documents grants a wider usability of data and, at the same time, the preservation of the documents.
Nevertheless, in order to widespread mainly the data usability, aiming to reach as many users as possible, it is necessary that these data are open and truly accessible.
In this context, publishing them through Web Map Services (WMS) appeared suitable to the aims of the project. WMS is in fact an Open Geospatial Consortium (OGC) Web Service that ensure the visualization of geographic data (raster and vector) across the web and multiple platforms. This standard does not provide the actual data, but a georeferenced image (e.g. PNG, JPEG, GIF files) of the data. It is possible to query the image, according to the attribute associated to each entity, and assign to the image a display style with rules defined through the Styled Layer Descriptor (SLD).
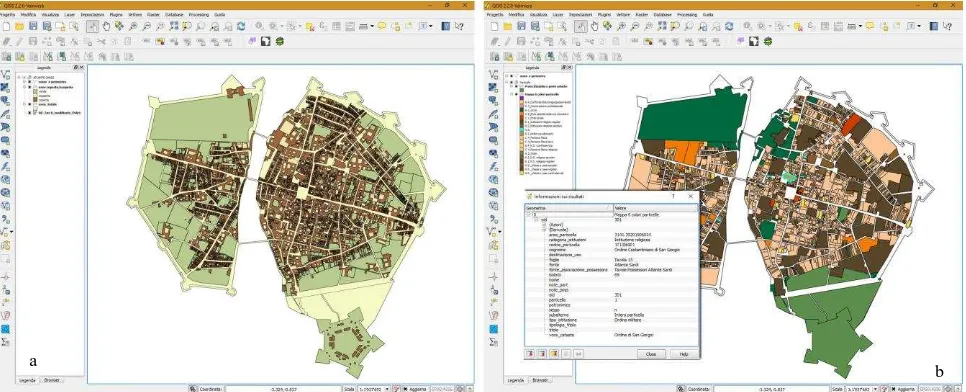
operation is possible at three levels of complexity, which correspond to the three main graphical entities, i.e. parcels, single properties within the parcels and blocks. As far as the viewing style is concerned, we have tried to reproduce the original layout of the maps, in order to simulate the consultation of historical documents themselves (see Figure 3a).
On the other hand, thematic maps concerning the whole city have been provided. To this aim it was necessary to query on specific themes the database. The selection of these themes has been made according to the most frequent requests made by the current project stakeholders (historians, architects, town planners) with whom we have worked in recent years.
These maps are thematised on the basis of specific attributes, explained in a legend, and regards:
the ratio between built and unbuilt areas, useful to make analysis about the urban development and the land use; the use of the parcels or of the property within them, in
order to evaluate changings over time and infer information about social-economic system;
the type of owner: if it is a natural person or a legal entity, if it is private or public, and to which social class it belongs (see Figure 3b).
In these cases, while the possibility to query directly each entity by clicking on it remains, the accessible data are only the ones related to the specific analysis to which the WMS layer refers. Furthermore, in these maps the layout is suited to show the particular theme connected with them.
The previous listed cases are only examples and can be overlapped to the current mapping.
Moving on to the actual publication of the maps using WMS, at first, the maps have been published with QGIS Server application (http://www.qgis.org/). It is an open source WMS 1.3 and WFS 1.0.0 implementation, which, in addition, implements advanced cartographic features for thematic mapping. It uses QGIS as backend for the GIS logic and for map rendering and provides the ‘Publish to Web’ plugin, a plugin for QGIS desktop which exports the current layers and symbology as a web project for QGIS Server (containing cartographic visualization rules expressed in SLD). Since QGIS desktop and QGIS Server use the same visualization libraries, the maps that are published on the web look the same as in the desktop application. Therefore, since the rendering of thematic maps had been made entirely in QGIS desktop, such migration was more immediate.
Now a further improvement of the project moves to maps
publication on GeoServer (http://geoserver.org/), which is an open source server software written in Java that allows users to share and edit geospatial data. Designed for interoperability, it publishes data from any major spatial data source using open standards.
Simultaneously to data publication as WMS, related metadata were created. Metadata are compliant with standard required by the INSPIRE Directive and have been made through CatMDEdit software (http://catmdedit.sourceforge.net/), an editor tool that facilitates metadata creation and validation according to recognized standards. Metadata implementation, in addition to giving a description of the data, facilitates resource discovery, interoperability and legacy resource integration, provides digital identification, and supports archiving and preservation.
4. GEOPAN ATL@S
A more mature and complete example of GIS/HGIS integration in the context of ENERGIC OD, is represented by the project GeoPan Atl@s APP which is designed to prove the feasibility of a brokering approach for an effective wider utilization of Open Data by professional users (e.g., geologists, architects, urban planners). The purpose of this application is to combine management of historical maps in Lombardy Region (Italy) with local cartography provided by local authorities (e.g., municipalities, regions, etc.). Integration of historical maps with modern cartographic layers can be fruitfully used for a wide range of proposes: landscape change analysis, urban development studies, archaeological research, territorial planning, etc. In particular, GeoPan Atl@s is mostly devoted to provide information useful for territorial and landscape management. Indeed, historical maps can be used to track land and territorial changes (e.g., changes in riverbed) during the centuries, which are not generally reported by modern maps. However, such information can be really helpful in land management (e.g., areas corresponding to ancient riverbeds are more prone to be flooded in the case of heavy rains). The innovation given by the brokering framework developed by ENERGIC OD Virtual Hub to access heterogeneous data sources in an easy way is of major importance for the GeoPan application. The Virtual Hub may give a single point of access to data that are provided in a homogeneous way by different actors. The results of this research should provide common map users with a new and easy way of consulting historical maps,
Figure 3. Thematic maps of the city of Parma concerning: a. buildings and unbuilt areas, b. the parcel ownership in 1767. a
getting the related information and stimulating a wider utilization of historical information by professional users. The high modernization level of tools and the archive availability through the web should also enlarge the potential public compared to the current one.
4.1 Data description
Historical maps used by GeoPan APP comes from the huge collection of the Archivio di Stato di Milano and partially Archivio di Stato di Como, whose maps belong to four distinct cadastral productions: (i) the Theresian Cadaster of XVIII century; (ii) the Lombardo-Veneto Cadaster of mid-XIX century and (iii) its updates of 1898 (Signori, 2002); together with samples of (iv) Impianto in conservazione by AdT (Italian Cadastral Administration). For each cadastral series, maps are divided in sheets and are related to single municipalities. Other historical map series considered here are the Corografie delle Province del Regno Lombardo-Veneto (from 1836, in scale 1:115,000), the Carta del Territorio del Milanese e Mantovano (1788-1796, in scale 1:86,400), the Carta del Regno Lombardo Veneto (ITM 1933, in scale 1:86,400). These maps had already been published on the web with the project “Portale Atl@ante dei Catasti Storici e delle Carte topografiche della Lombardia” (http://www.atlas.polimi.it/), a web platform in which the historical maps are conceived as a modern atlas with different levels of access. GeoPan Atl@s APP represents thus an extension of usability and interoperability thanks to the Virtual Hub.
4.2 Implementation of GeoPan Atl @s APP
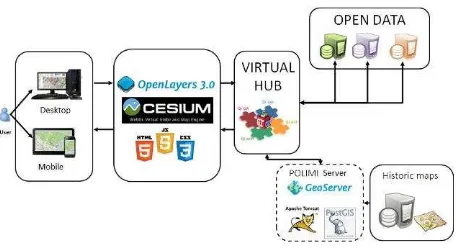
One of the application studied and developed upon Virtual Hub approach is GeoPan Atl@s that deals with multi-temporal and multi-source geospatial data query, visualisation and consultation using a webGIS geo-portal concept as a gateway to information. During the development of the web application, choices were made by paying attention to the needs and peculiarities of the project: (i) visualization and management of large dimension raster maps, (ii) organization of cartographic resources for easy consultation, and (iii) interface with a visual impact able to attract and to clearly communicate the information requested. Different FOSS (Free/Open Source Software) solutions were considered for both server and client-side implementation. The general architecture of the GeoPan Atl@s APP is presented in Figure 4.
In particular, the Virtual Hub is used to collect and access different services and cartographic information provided by local SDI and Historic maps provided by the POLIMI Server. An architecture with the VH gives a simpler access to geographic OD giving a single point of access with a standard protocol and interface. The server-side software used is GeoServer, which allows publishing spatial data and interactive mapping applications on the web and the visualization of georeferenced historic maps through the use of an OGC standard interfaces.
To develop the client-side of the system of the Geopan Atla@s, different FOSS libraries were used. In particular, front-end/interface is developed as a classic HTML/CSS/JS approach. It uses WebGL for hardware-accelerated graphics, and is cross-platform, cross-browser, and tuned for dynamic-data visualization. Cesium is supported by Android, iOS and Window tablet. In addition, the application will be released also as an .apk file developed by using the Apache Cordova technology (Phonegap). The Geopan Atla@s was developed using a set of Open Libraries (delivered under the Apache 2.0
license, which means they are free for commercial and non-commercial uses):
Phonegap (Apache Cordova): PhoneGap is a free and open source framework that allows to create mobile apps using standardized web APIs for a very wide range of mobile platforms.
jQuery: the jQuery 1.10.2 library is used to develop the front-end (UI and application behaviour). Some jQuery plugins are added such as blockUI, numeric, and zebra datepicker in order to enhance the user experience.
OL3-Cesium: OL3-Cesium is a JavaScript library for creating 3D globes and 2D maps in a web browser without a plugin. This library is used as a support to manage layers returned from queries performed by users.
giapi-1.2.9-beta: Virtual HUB javascript library. Required to interface the application with the Virtual HUB. License information can be found at http://api.eurogeoss-broker.eu/
a.
b.
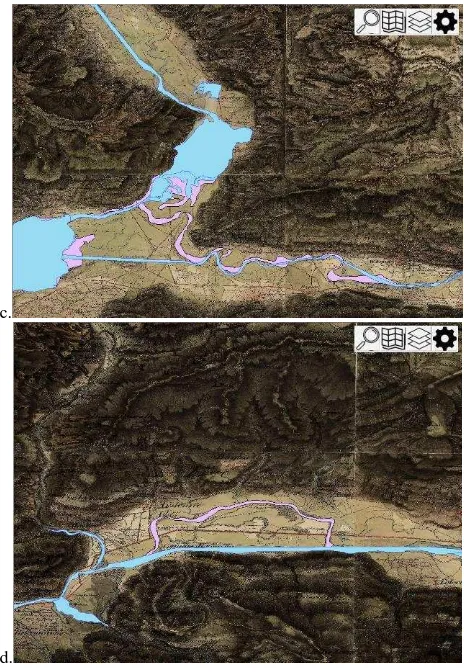
c.
d.
Figure 5. Examples of data brokered by the GeoPan Atl@s APP: (a) Theresian Cadaster for the city of Gongorzola, (b) Theresian Cadaster for the city of Gongorzola with overlaid actual Topographic Database, (c-d) actual riverbed (blue) and historical one (purple) derived from historical map (base map)
the for the Adda river.
The GeoPan Atl@s web client consists of two parts: a layer menu and a main map panel. The layer menu itself is additionally divided into two parts: the first one allows users to view and select all the georeferenced historical maps which are ordered in two separate trees, where the second one will be developed to interact with the Virtual Hub formulating queries and displaying results. Some examples of queries results are reported in Figure 5.
In particular, Figure 5a shows the Theresian Cadaster for the city of Gorgonzola (MI) and the overplayed actual Topographic Database (Figure 5b). Figures 5c-d show two different cases of changes in the Adda riverbed (SO), the actual riverbed is represented in blue while the historic riverbed derived from the base map is represented in purple. GeoPan Atl@s represents a new unique point of access of such data and possible enriched information to end-users regarding the use of land and the modifications of surrounding landscape.
5. CONCLUSION
This paper aimed to describe two HGIS case studies/projects and their implementation (at different stage of completion) in the ENERGIC OD VH framework. Many of the technical issues that have been addressed concerned the interoperability between data, in particular spatial and geographic data, gathered from different data providers, with different features and referred to different historical periods. It is important to
highlight how the interaction between various data sources and cartographical products gives more value to the analysis of the territory and the possibility of enlarging the knowledge about it. The capability to integrate different informative layers, both historical and modern, can be an important opportunity of development with application areas still largely unexplored. The analysis of historical cartography represents an important test in which is mandatory to engage experts not only from geomatics but also historians, architects, urban planners, geologists, restores, etc.
In a so complex context, it is evident how the possibility of having an architecture - i.e. the Virtual Hub - which ensures the easy interoperability between so different sources and the connection of data and knowledge gathered from different disciplines, becomes crucial.
The article summarized and exemplified how, starting from projects grown up independently, the interoperability is possible in the framework of the ENERGIC OD project. The applications explained are at two different level of development. The case of Parma, starting from HGIS realization and production of thematic vector maps, shows how these contents can be accessed and interoperated on the web.
GeoPan Atl@s APP, concerning a project already published on the web, gives users the possibility to access and consult the maps through an application. In this way the access is easier and even more immediate, considering the diffusion of smartphones and tablets.
It is possible to state that the dissertation describes a process in continuous evolution, which leads to increase diffusion, interoperability and ease of access the information.
Data can be produced independently from one another, with the only requirements to be accessible and conform to OGC standards, in order to be discovered, catalogued and used. Moreover, thanks to brokering architectures, such as the Virtual Hub, their interaction is a problem that does not involve neither the providers nor the final users, since solving interoperability problems lies with the intermediate level represented by the Virtual Hub. This component, levelling out different protocols, standards, formats etc. for discovery and access, increases the opportunity to access and integrate multiple sources for the development of new applications. Reducing indeed the interoperability problems between data providers and users, the VH lowers the entry barriers for the development of multidisciplinary applications, as the GeoPan Atl@s APP shows.
However, as seen before, easy interoperability is possible not only for the current cartography but also for the historical one. This possibility further demonstrates the potentialities of the VH approach, since it is able to manage data that are not encoded, standardized and compliant with modern rules and conventions of cartography.
This capability is particularly significant for the improvement of spatial data consultation: having the possibility to relate maps belonging to different historical periods and provided by various operators or disciplines, the dissemination of geo-data is expected to grow continuously. In this way, the hope is that the in-depth knowledge of the territory will grow too and, then, will address the design and protection choices, so that they are adequate and enhance our important heritage.
ACKNOWLEDGEMENTS
6. REFERENCES
Atl@nte dei Catasti Storici e delle Carte Topografiche della Lombardia, 2015. http://www.atlas.polimi.it/. (06 Apr. 2016)
Baiocchi, V., & Lelo, K., 2005. Georeferencing the historical maps of Rome between the seventeenth and eighteenth centuries. CIPA 2005 XX International Symposium-International cooperation to save the world's cultural heritage. Torino. September 2005, Vol. 26, pp. 114-118.
Brovelli, M. A., Minghini, M., Giori, G., & Beretta, M., 2012. Web geoservices and ancient cadastral maps: the Web CARTE Project. Transactions in GIS, 16(2), 125-142.
Bruno, N., 2014. Prime esperienze per la realizzazione di una piattaforma HGIS della città di Parma. Bollettino SIFET, 2014, pp. 13-23.
Bruno, N., Bianchi, G., Zerbi, A., & Roncella, R., 2015. An open-HGIS project for the city of Parma: database structure and map registration, In: Free and Open Source Software for Geospatial - Open Innovation for Europe. GEOMATICS WORKBOOKS, Como, Italy, vol. 12, p. 189-203.
Carrion, D., Migliaccio, F., Minini, G., & Zambrano, C., 2013. Rappresentazione cartografica e condivisione di dati storici in ambiente GIS. Atti 17a conferenza nazionale ASITA, 5-7 novembre 2013, Riva del Garda – Italy, pp. 379-384
CatMDEdit. http://catmdedit.sourceforge.net/ (06 Apr. 2016)
ENERGIC-OD Consortium. Virtual hubs - system architecture - D5.1 (2015).
Farruggia, A., 2009. Cartografia tematica e analisi diacroniche: casi di studio del Catasto antico sabaudo ai SIT contemporanei. In Panzeri M., & Farruggia, A., Fonti, metafonti e GIS per
l’indagine della struttura storica del territorio, Celid, Torino,
pp. 71-78.
Gauthiez, B., & Zeller, O., 2009. Espace costruit, espace social à Lyon aux XVII-XIXe seècles: l'apport du SIG. In M. Panzeri, & A. Farruggia, Fonti, metafonti e GIS per l'indagine della struttura storica del territorio, Celid, Torino, pp. 39-49.
Gauthiez, B., & Zeller, O., 2014. Lyons, the Spatial Analysis of a City in the 17th and 18yh Centuries. Locating and Crossing Data in a GIS Built from Written Sources. In Mapping Spatial Relations, Their Perceptions and Dynamics, Lecture Notes in Geoinformation and Cartography, pp. 97-118.
Geoserver. http://geoserver.org/ (06 Apr. 2016)
Gregory, I. N., Bennett, C., Gilham, V. L., & Southall, H. R., 2002. The Great Britain Historical GIS Project: from maps to changing human geography. The Cartographic Journal, 39(1), 37-49.
Heere H., 2006. The use of GIS with property maps. e-Perimetron, vol.1, n.4, pp. 297-307
Lelo, K., & Travaglini, M., 2005. The GIS-based historical atlas of Rome. In XXth International CIPA Symposium, September 2005, Vol. 26.
Micalizzi, P., Magaudda, S., Buonora, P., & d’Elia, L. S., 2012. A GIS for the city of Rome: archives, architecture, archeology. e-Perimetron, 7(1), 28-35.
Nativi, S., Khalsa Siri Jodha, D. B., Craglia, M., Pearlman, J., Mazzetti, P., Rew, R., 2011. The Brokering Approach for Earth Science Cyberinfrastructure. EarthCube White Paper.
Nativi, S., Craglia, M., Pearlman, J., 2013. Earth science infrastructures interoperability: the brokering approach. Selected Topics. Applied Earth Observations and Remote Sensing, IEEE Journal of, 6(3), 1118-1129.
Panzeri M., 2008. Fonti catastali e spazi digitali: il Cattastro della Molto Magnifica Communità di Cumiana (1738-1755) da documento storico a risorsa per il territorio. In Longhi A.,
Catasti e territori. L’analisi dei catasti storici per
l’interpretazione del paesaggio e per il governo del territorio,
Alinea Editrice, Firenze 2008, pp. 199-211.
QGis. http://www.qgis.org/ (06 Apr. 2016)
Signori M., 2002. I lavori del Catasto Lombardo-Veneto nei territori lombardi. In Ricci G. and D’Amia G. (eds). La cultura
architettonica nell’età della Restaurazione. Milano, Mimesis
Edizioni, pp. 85-100.