OPTICAL REMOTE SENSING IMAGE OPTIMIZED DEHAZING ALGORITHM BASED
ON HOT
Zhou Yang a,Xu Qing a,Xu Jiwei a, Jin Guowang a a Institute of Surveying and Mapping, ZhengZhou 450052, China
Commission III, WG III/5
KEY WORDS: Haze Thickness Map, Dark Pixel Map, Texture and Edge Information, Texture Elemination
ABSTRACT:
Due to the significantly effect of clouds in the near-earth space environment to remote sensing satellite images, some satellite images can not be utilized normally, resulting in large limitation of their application fields. For the background suppressed haze thickness index (BSHTI) and improvement background suppressed haze thickness index (IBSHTI) have the characteristics of thoroughly cloud correction and badly deficiency of the tone and texture information, we propose to first adopt IBSHTI to calculate the cloud thickness image of different bands, then the dark-pixel images are obtained by down sampling, and the texture is eliminated by introducing Texture and edge information (TEI). Experiment results show that our method can well retain the ground tone and texture information while removing the effect of clouds, especially in urban areas.
1. INTRODUCTION
The interference of clouds largely reduces the available area of satellite images, which will hinder the real-time update of map structure data badly. With the improvement of image resolution, clouds occlusion has become a serious problem that cannot be ignored. Thus, the research of cloud eliminating problem plays a crucial role in image correction.
Current cloud correction methods are divided into two kinds. Now cloud correction algorithms based on frequency and spatial are two main methods for clouds correction. Algorithms based on frequency always weaken the low frequency information representing clouds, which will lead to local blur and texture deficiency, and the representative ones are Fourier transform(Anuta, 1970), homomorphic filter(Wu, 2013), wavelet transform(Zhou, 2011). There are many cloud eliminating algorithms based on spatial, among them are dark-object subtraction (DOS) (Chavez, 1988)and dark channel prior method(He,2011)(Lan, 2013), they separate the effect mainly caused by clouds by detecting the pixels with zero surface reflectance rate or zero radiation rate on the original image. HOT(Zhang, 2002) and its extended algorithms have a relatively wide applications, they separate clouds with ground through establishing clear lines based on the highly correlation between blue and red wavelengths. Due to the complexity of materials classes, this correlation can be very low in some specific situations, thus, BSHTI algorithm proposes to decrease the effect of the low correlation by retrieving the thickness image under the combined action of red, green and blue wavelengths. However, there are still some problems, such as dark tone, texture deficiency. Through introducing the near infrared wave band, IBSHTI algorithm can obtain the cloud thickness image basing on the near infrared wave and visible band together, then the image tone and texture information are both improved. But the image tone deviation and texture deficiency problem are still existed in satellite images obtained from different sensors, what’s more, the deficiency of roof
colour information is more obvious when the building is in blue or red colour.
Short wave synthesis algorithm (Makarau, 2014) first uses short wavelengths (band range between
0.4430
m
and0.4825
m
) image to synthetic image with the range of 0.370.49m, then the cloud area is localized by mean-shiftalgorithm. The cloud thickness images in visible band are got orderly by the correction of the cloud area in blue, green and red bands and the band synthetic results. Its main thought is to highlight the cloud information in cloud thickness image and decrease the ground reflectance information, then the real contribution of cloud is simulated and the improved result is obvious. Furthermore, there are also a few methods aiming to distinguish cloud with ground, such as fitting function (Liang, 2014), principal component analysis (Li, 2014) and multi-scale spatial analysis algorithms (Zhan, 2012).
Therefore, the existed cloud correction algorithm obtain a relatively precise cloud thickness image mainly through limiting ground reflection information, highlighting cloud effect to a lager extent and taking full advantage of bands correlation. In general, there are two common problems, the first one is that the image quality is too bad when the effect of the cloud is serious, resulting in a large difference of cloud thickness; the second is that the corrected image always comes with a dark tone and badly local texture deficiency. Above all, this paper proposes to eliminate the texture of the cloud thickness image basing on the improved HOT algorithm BSHTI and IBSHTI, which can retain image tone and texture information well and achieve the goal of restoration of the real surface.
In this paper, the remaining sections are organized as follows. Section 2 describes the BSHTI ,IBSHTI and Optimized HOT method. Section 3 presents experimental results and quantitative analysis. Finally, some conclusions are given in section 4.
2. METHODOLOGY
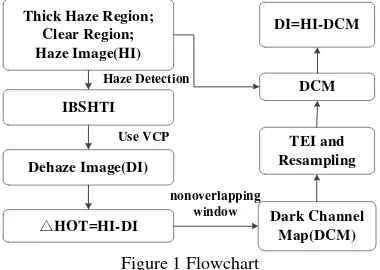
Based on the defects of the methods of BSHTI and IBSHTI ,our method is aimed at the optimized of haze thickness image. A nonoverlapping window and down sampling based on the difference image HOTare used for reducing surface targets. and the TEI is used for the retention of texture details. The main methodological diagram is in figure1. and
l
3) together, the basic equations are as follows:1 1 2 2 3 3 4
Mean(cloud), Mean(clear)= respectively the BSHTI average of the cloud region and clear region
SD(clear) = the BSHTI standard deviation of the normal region
In order to get the minimum value of equation (2), the calculated BSHTI value need to satisfy two conditions: (i) the cloud thickness difference between the cloud region and clear region should be as large as possible; (ii) the variance of no cloud areas (assuming normal background features) should be as small as possible. Therefore,
k
1,k
2andk
3can be obtainedBSHTI algorithm is designed to avoid low correlation between blue and red wavelengths, but the performance of BSHTI is not good enough because there will be darker tonality and fewer texture details after correction; Therefore, the cloud effect of the near infrared wave band is taken into account in IBSHTI algorithm to solve these problems, which can improve the tonality and texture information of the earth’s surface. For hyperspectral satellite images, it may have more than four bands between visible and near infrared bands. So its basic principle
MeanTR, MeanCR= respectively the mean grey value of thick clouds and normal region from the first band and the n
the theoretical value of
Mean
CR IBSHTI_ should be close to zero,which is the constrained condition to calculate
k
n1.Both methods above adopt virtual cloud point method (VCP) to correct haze. Firstly, hierarchical segmentation is carried out on the haze thickness image HOT, Secondly, the maximum and the minimum values of each layer are calculated, Thirdly, linear
fitting is carried out combining the HOT with the
i
bandseparately to get the intersection point
(
HOT
iVCP,
DN
iVCP)
. At last, based on equation (8), correct processing is performed:
'
(
)
where
DN
i,DN
i' = the grey value ofi
band imagebefore and after the correction
2.3 Algorithm principle in this paper
According to the principles of the above two algorithms and the applicable conditions, this article uses the cloud thickness map of the results of IBSHTI to eliminate texture, which can avoid the texture details missing in the process of calibration and improve the whole tonality of image at the same time, the principle of proposed algorithm is as follows:
'
i i i
HOT
DN
DN
9where
HOT
i= the difference image between the originalimage and the result of preliminary correction, namely the haze
thickness image of each band.
The haze thickness image mainly contains two pieces of information: the terrain texture details and interference factors of cloud and haze. In order to reduce the texture information of
i
HOT
, here we take the method proposed by (Makarau, 2014) to get dark pixels image through nonoverlapping window. that is as the following equation.' ' ' ' region and normal region, further processing for texture details
is needed to the dark pixels image. Defining
Median
( )( )
I
(window size is set to ) as the images after executing median filter, Optimization processing is as follows:
dark pixel image (Tarel, 2009), namelyTEI
i, it is equivalent to some earth's surface information, including the outline and edge of the earth's surface. Median filtering is carried out to avoid excessive correction for buildings in image, and the cubic convolution interpolation resampling method is used to get back to the original image size, named as
HOT
i', At last, we define'
i
DN
as the final correction results:' ' followed by Landsat8 OLI 30m resolution multispectral satellite images, high-resolution and wide-field GF1-WFV2 16m resolution satellite images, GF1-PMS1 8m multispectral images and ZY-3 5.8m resolution satellite images. Landsat 8 images have size of 4800×4800 from Dengfeng, Henan Province on April 4, 2014; GF1-WFV2 images have size of 6000×6000 from Poyang lake area in the city of Wuxi, Jiangsu Province on August 9, 2013; GF1 - PMS1 images have size of 4548×4596 from Shanghai on July 12, 2013; ZY - 3 images have size of 8000×8000 from Beijing on October 11, 2012, as shown in Table 1.
Data Size Region Time Spatial resolution(m)
Landsat8 OLI 4800×4800 Dengfeng 2014-04-04 30
GF1-WFV2 6000×6000 Wuxi 2013-08-09 16
GF1-PMS1 4548×4596 Shanghai 2013-04-12 8
ZY-3 8000×8000 Beijing 2012-10-11 5.8
Table 1 Basic information of experimental data
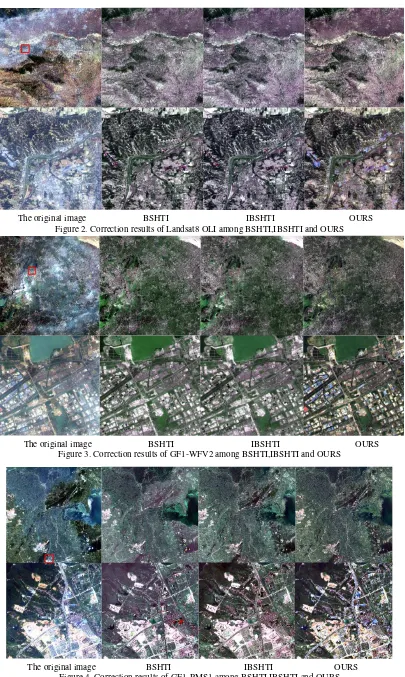
As shown in figure 2 to figure 5, the global and local images are listed in sequence of original data, BSHTI, IBSHTI and OURS.
Among them, the red rectangle marked in the global image is corresponding to the local area image.
The original image BSHTI IBSHTI OURS Figure 2. Correction results of Landsat8 OLI among BSHTI,IBSHTI and OURS
The original image BSHTI IBSHTI OURS Figure 3. Correction results of GF1-WFV2 among BSHTI,IBSHTI and OURS
The original image BSHTI IBSHTI OURS Figure 4. Correction results of GF1-PMS1 among BSHTI,IBSHTI and OURS
The original image BSHTI IBSHTI OURS Figure 5. Correction results of ZY-3 among BSHTI,IBSHTI and OURS
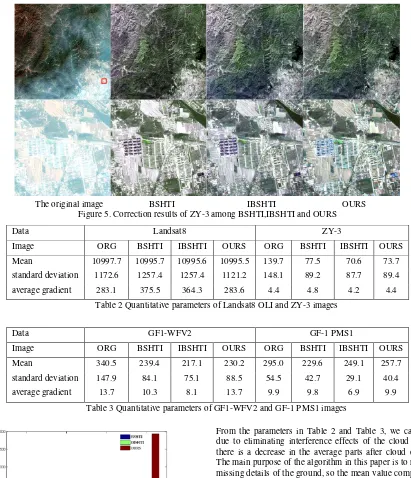
Data Landsat8 ZY-3
Image ORG BSHTI IBSHTI OURS ORG BSHTI IBSHTI OURS
Mean 10997.7 10995.7 10995.6 10995.5 139.7 77.5 70.6 73.7
standard deviation 1172.6 1257.4 1257.4 1121.2 148.1 89.2 87.7 89.4
average gradient 283.1 375.5 364.3 283.6 4.4 4.8 4.2 4.4
Table 2 Quantitative parameters of Landsat8 OLI and ZY-3 images
Data GF1-WFV2 GF-1 PMS1
Image ORG BSHTI IBSHTI OURS ORG BSHTI IBSHTI OURS
Mean 340.5 239.4 217.1 230.2 295.0 229.6 249.1 257.7
standard deviation 147.9 84.1 75.1 88.5 54.5 42.7 29.1 40.4
average gradient 13.7 10.3 8.1 13.7 9.9 9.8 6.9 9.9
Table 3 Quantitative parameters of GF1-WFV2 and GF-1 PMS1 images
Figure 6. The running time of image data
3.2 Results analysis
Related experiments show that the algorithms of BSHTI and IBSHTI can relatively completely rectify cloud and haze, while the defects are darker tonality and fewer texture details. Features cannot be effectively distinguished, and the algorithm in the paper can restore the real surface features better. From the overall image, because this method is optimized on the basis of BSHTI and IBSHTI, the correction effect has also a certain constraints, which the tone of the image has an improvement in total, but is not obvious. And through the contrast observation of the surface details in local area, the effect has a large improvement in ground objects such as red or blue houses (see the results in Figure 3 and Figure 5).
From the parameters in Table 2 and Table 3, we can see that due to eliminating interference effects of the cloud and haze, there is a decrease in the average parts after cloud correction. The main purpose of the algorithm in this paper is to restore the missing details of the ground, so the mean value compared with the former increased; The standard deviation of three methods is lower than original image, which illustrates each pixel grey level becomes concentrate and the difference is reduced. Similarly, the average gradient shows the clarity of image, we can see three methods are similar and have enhanced the resolution of the original image. The processing time is shown in Figure 6. As the method in this paper is based on IBSHTI algrithom, it takes a lot of time in sampling excepting for the prepare time of choosing normal and thick cloud region image. So the efficiency of algorithm needs to be improved in the future.
(3 3)
(
)
i i
DCM
Median
DCM
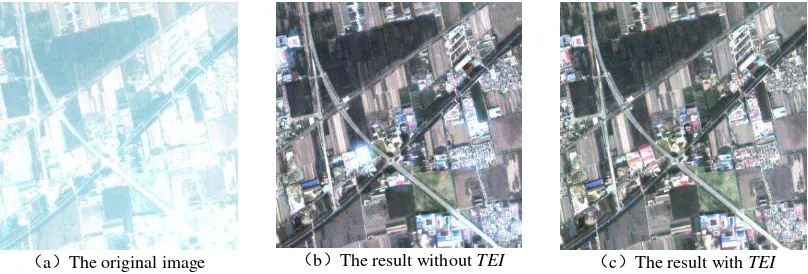
is surface texture and edge information of haze thickness image. This parameter helps recover the ground objects such as buildings blurred by the haze thickness image. ZY-3 image is introduced as an example to show the correction effect after importing the parameter. Figure 7(a) is the original image. As shown in Figure 7(b), when theparameter is not introduced, the surface buildings (see Figure 7(b)) such as the red roof at the bottom of haze area will appear exposure phenomenon, which is mainly due to the homogenization of haze thickness image after the sampling and the terrain outline surroundings and edge details of the building
are not separate. The information of
TEI
i is extracted alone, which is equivalent to filtering out the above surface details of haze thickness after resampling and can restore the surface features in the beneath of cloud(see Figure 7(c)).a The original image b The result without TEI c The result with TEI
Figure 7. The correction results of the image before and after the introduction of
TEI
4. CONCLUSION
Based on the strengths and weaknesses of BSHTI and IBSHTI algorithm, this paper optimizes the thickness of haze image optimization. Using thoroughness results of haze correction, features of the texture are eliminated by calculating the dark channel map through sampling. In addition, in order to fully restore the surface contour and edge of the ground objects such as buildings, the texture and edge information is introduced to eliminate clouds thoroughly and also preserve the real characteristics of the earth's surface at the same time. This paper has the following conclusions:
(1) With the purpose of making the damaged image restore its using value, this algorithm has great improved the recovery of surface features, especially the buildings at the urban area, enhancing the visibility of the image. And the introduction of texture and edge information improve the phenomenon that the ground targets in cloud is not recovered thoroughly and overexposure.
(2) The paper has carried on the comparison and verification of the algorithm with several groups of data from different sensors and different spatial resolution images respectively. The experimental results show that the algorithm has strong generality and ground objects can be restored well.
(3) The main purpose of this paper is to restore the real features of ground objects, and the basic haze thickness image is obtained from IBSHTI method. While cloud and haze correction algorithm are inevitably revise normal objects like clouds (such as the waves produced along the coastal zone, shaped like a cloud, etc.), it has also been restricted to a certain extent. With the increase of spatial resolution, for highlight targets with large area the effect is very poor. And for practical applications, even if the resulting images are visually improved, it does not mean that they are usable for remote sensing ,we need to transform the haze images to usable resource, like clear images which can be used in practical, this needs to be studied in the future.
ACKNOWLEDGMENTS
The experimental data in this paper was provided by China Centre For Resources Satellite Data and Application.
REFERENCES
Anuta, P. E., 1970. Spatial registration of multispectral and multitemporal digital imagery using fast fourier transform techniques. Geoscience Electronics IEEE Transactions on, 8(4), pp. 353-368.
Wu X P, Yang W N, Li G M., 2013. Thin Cloud Removal of ZY-3 Image Based on Improved Homomorphism Filtering Method. Geoinformatics (GEOINFORMATICS), 21st International Conference on. IEEE, pp. 1-4.
Zhou L Y, 2011. Research on Information Compensation Theory of Visible-Spectrum Cloudy Remote Sensing Imagery, Zhengzhou: Institute of Surveying and Mapping, pp. 16-24.
Chavez P S, 1988. An Improved Dark-Object Subtraction Technique For Atmospheric Scattering Correction Of Multispectral Data. Remote Sensing of Environment, 24(88), pp. 459- 479.
He K, Sun J, Tang X, 2011. Single Image Haze Removal Using Dark Channel Prior. Pattern Analysis & Machine Intelligence IEEE Transactions on, 33(12), pp. 2341-2353.
Lan Xia,et al., 2013. Single image haze removal considering sensor blur and noise. Eurasip Journal on Applied Signal Processing, 1, pp. 1-13.
Zhang Y, Guindon B, Cihlar J., 2002. An image transform to characterize and compensate for spatial variations in thin cloud contamination of Landsat images. Remote Sensing of Environment, 82(2), pp. 173-187.
Hu J B, Liu C B, Wang Z Y, et al., 2010. Improvement on the three-step haze removal technique with the aid of one clear image partly overlapped. Geoinformatics, 2010 18th International Conference on. IEEE, pp. 1-4.
Zheng Y, Li H, Gu H, et al., 2010. Research on the Haze Removal Method and Parallel Implementation for HJ -1 Satellite Data. Multimedia Technology (ICMT), 2010 International Conference on. IEEE, pp. 1-4.
Makarau A, Richter R, Muller R, et al., 2014. Haze Detection and Removal in Remotely Sensed Multispectral Imagery. IEEE Transactions on Geoscience & Remote Sensing, 52(9), pp. 5895-5905.
Liang G, Li Y., 2014. Removing thin cloud from remote sensing digital images based on robust kernel regression. Orange Technologies (ICOT), 2014 IEEE International Conference on. IEEE, pp. 209-211.
Li H, Zhang L, Shen H., 2014. A Principal Component Based Haze Masking Method for Visible Images. Geoscience & Remote Sensing Letters IEEE, 11(5), pp. 975-979.
Zhan Y, Zheng S, Wei L, et al., 2012. Image Haze Detection and Removal Based on Multiresolution Spatial Analysis. Remote Sensing, Environment and Transportation Engineering (RSETE), 2012 2nd International Conference on. IEEE, pp.1-5.
Tarel J P, Hautière N., 2009. Fast visibility restoration from a single color or gray level image. Computer Vision, 2009 IEEE 12th International Conference on. IEEE, pp. 2201-2208.