Influence of simulated rain on dispersal of rust spores
from infected wheat seedlings
L. Geagea
a,b, L. Huber
a,∗, I. Sache
b, D. Flura
a, H.A. McCartney
c, B.D.L. Fitt
c aInstitut National de la Recherche Agronomique, Unité de recherche en Bioclimatologie, BP 01, 78850 Thiverval-Grignon, FrancebInstitut National de la Recherche Agronomique, Laboratoire de Pathologie Végétale, BP 01, 78850 Thiverval-Grignon, France cIACR-Rothamsted, Harpenden, AL5 2JQ, UK
Received 15 March 1999; received in revised form 29 October 1999; accepted 6 November 1999
Abstract
Spores of both Puccinia recondita f. sp. tritici and P. striiformis (brown rust and yellow rust of wheat) are thought to be primarily dispersed by wind. The results of experiments, using a rain simulator with uniform drop sizes (2.5, 3.4, 4.2 or 4.9 mm), on the effect of rain on dispersal of brown (leaf) rust and yellow (stripe) rust spores are reported. Experiments on both pathogens were done in still air; additional experiments were done on brown rust with simulated wind and rain. Spore dispersal was estimated by trapping spores on wheat plants and assessing the disease symptoms which subsequently developed under optimum conditions. Simulated rainfall of each the four drop sizes tested dispersed spores of both pathogens. In still air spore dispersal patterns were similar to those usually found for pathogens which are characteristically splash-dispersed. Rain exhausted the source of spores in about 20 min for the four drop sizes. When the plants were kept under optimal conditions for sporulation, the source of brown rust spores available for dispersal was restored to its initial numbers in about 2 h after depletion. For yellow rust, spore numbers in the source had not been restored to their original value after 6 h, even under optimal conditions. In the wind tunnel experiments, simulated rain did not inhibit the dispersal of brown rust spores by wind. Large incident drops dispersed more spores of both pathogens than small drops. A simulation study based on the experimental relationships obtained was done. Although these experiments clearly show that rainfall has the potential to spread both brown rust and yellow rust of wheat, the understanding of the exact role of rain dispersal in the epidemiology of both diseases requires further investigation. ©2000 Elsevier Science B.V. All rights reserved.
Keywords: Rain; Simulation; Wheat; Rust; Spore; Dispersal
1. Introduction
Rain-splash is an important mechanism for disper-sal of spores of plant pathogens (Fitt et al., 1989). When a raindrop strikes an infected plant, splash droplets can entrain and disperse spores and thus can introduce inoculum into areas where the pathogen
∗Corresponding author. Tel.+33-1-30-81-5555;
fax:+33-1-30-81-5563.
E-mail address: [email protected] (L. Huber).
is not present (Fitt and McCartney, 1986). The use of rain towers has provided a tool for understand-ing the dispersal of plant pathogenic fungi with spores which are usually splash-dispersed (Fitt et al., 1986b; Madden et al., 1996). Although it has been shown that typically wind-dispersed spores (e.g. those of Botrytis cinerea, Madden, 1992) can be re-moved from host tissues by impact of single incident drops, rain simulators have not been used to study the role of splash in dispersal of wind-dispersed spores.
Spores of Puccinia recondita f. sp. tritici and P. striiformis (brown and yellow rust of wheat) are known to be dispersed by wind (Nagarajan and Singh, 1990; Hau and de Vallavieille-Pope, 1998), but they have been shown to be released from host tissue by the impact of water drops, and subsequently dry-dispersed (Rapilly, 1979), and, in wheat crops, the dispersal of these spores has been linked to occurrence of rain (Rowell and Romig, 1966; Park, 1990). Geagea et al. (1999) have shown that spores of P. recondita and P. striiformis can be entrained by rain-splash droplets and dispersed with them, and that dry-dispersal and rain-splash dispersal occurred and were not mutually exclusive.
The potential for rain splash to disperse plant pathogen spores depends largely on the characteris-tics of natural rain (Reynolds et al., 1987; Fitt et al., 1989), since the size and velocity of individual inci-dent raindrops and rain duration affect the splash dis-persal process (Yang et al., 1991; Ntahimpera et al., 1997). However, little is known about the influence of rain drop characteristics on the removal and dispersal of spores which are usually wind dispersed.
This paper reports the effects of rain on dispersal of P. recondita and P. striiformis spores. The main aim was to study the influence on dispersal of rain param-eters such as drop diameter and rain duration. The ex-periments were done using a rain simulator and dis-persal was measured by assessing disease severity on wheat ‘trap’ plants. Rain simulation experiments were also done in the presence of wind to evaluate the ef-fect of a horizontal wind flow on rain-splash disper-sal. Knowledge of physical properties of rain, such as drop size distribution and total kinetic energy of rain were used in an attempt to quantify the influence of natural rain on spore dispersal from infected plants to healthy trap plants.
2. Materials and methods
2.1. Experiments with simulated rain in still air
2.1.1. Rain simulator
A rain simulator similar to that used at IACR-Rothamsted (Mann et al., 1995) was made at INRA, Grignon. It consisted of a 1 m square frame
contain-ing ten 1 m long plastic tubes (20 mm in diameter) in parallel rows. Hypodermic needles were inserted 11.5 cm apart along the length of each tube, giving an array of 80 drop sources. This array was supplied by a peristaltic pump linked to a reservoir of sterile water. Used as a linear source, the simulator pro-duced a uniform distribution of drops over an area of about 0.2 m2. Drop size depended on the gauge of the hypodermic needles; four needle sizes were used to produce drops of 2.5, 3.4, 4.2 or 4.9 mm in diameter. Drop diameter was estimated from the mea-sured volume of a known number of drops. The drops were allowed to fall 9 m and should have reached speeds close to their terminal velocity before hitting source plants (Fitt et al., 1986b). Released drops were protected from air turbulence by vertical thin plastic walls. The intensity of simulated rain was measured by placing 12 collectors (180 ml capacity) in a ran-dom pattern under the rain simulator for 5 min periods and measuring the volume of water collected.
2.1.2. Measurement of dispersal gradients
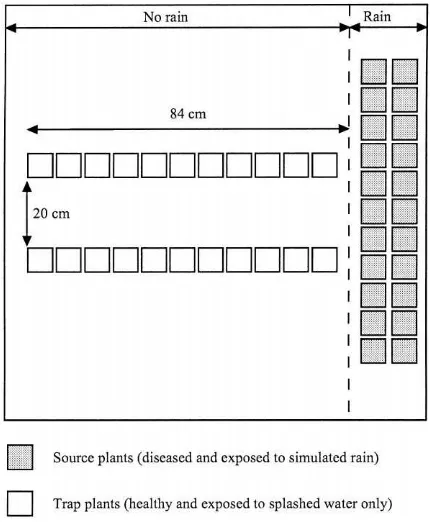
Spore dispersal gradients (Gregory, 1973) resulting from rain splash were studied by measuring the hori-zontal dispersal of spores from infected source plants placed under the rain generator (Fig. 1). The source plants were exposed to simulated rain consisting of drops of uniform size. Spore dispersal was assessed by trapping the spores on ‘trap plants’ placed at differ-ent distances from the source and measuring disease symptom development (see further).
The inoculum source consisted of infected wheat seedlings in 22 pots (diameter 7 cm), filled with soil-less compost with added nutrients. Each pot contained up to six wheat seedlings (cv. Michigan Amber) which had been grown in a growth room until the unfolding of the second leaf (Fig. 1). The source plants were inoculated in a settling tower, using a density of 540±60 spores cm−2of either P. recondita f. sp. tritici or P. striiformis, and placed in a growth room at 17◦C and light intensity of 250
mE m−2s−1 (Geagea et al., 1997). The plants usually developed sporulating lesions after 10–12 days.
Fig. 1. Schematic layout of source and trap plants in the exper-iments in still air. Shaded boxes: source plants with sporulating lesions, clear boxes: trap plants.
20 cm apart) at right angles to the source plants; the nearest pots were 14 cm from the source plants (Fig. 1). After each experiment, the pots were removed, placed in closed polyethylene bags and incubated in darkness for 24 h at the optimal temperatures for in-fection by each fungus; 15◦C for brown rust (Clifford and Harris, 1981) and 8◦C for yellow rust (Rapilly, 1979). The pots were then placed in the growth room (at the same conditions) to allow the lesions to de-velop. Symptom development was monitored at regu-lar intervals by visual examination of four leaves per pot. The number of brown rust lesions was counted after 10 days and the number of yellow rust chloroses was counted after 8 days on 2 cm2 areas per leaf. For yellow rust, the rapid growth of the lesions and their coalescence did not allow a precise assessment of the number of successful infections. Therefore, the pale yellow chloroses that precede the appearance of individual lesions were counted and sporulation was used to confirm that the spots were yellow rust. The number of brown rust lesions or yellow rust chloroses
recorded per unit area gave a measure of the number of spores deposited at each distance from the source. Horizontal dispersal gradients were quantified by fitting an exponential equation to the relationship between disease symptoms and distance (Fitt et al., 1987):
y = aexp(−bd) (1)
where y was the number of either brown rust lesions or yellow rust chloroses cm−2, recorded at the distance d (cm) from the source. The coefficients a and b were estimated by linear regression from the linearised form of Eq. (1) (ln(y)=ln(a) −bd). The exponent b can be expressed as a ‘half-distance’α(=0.693/b), that is the distance in which y decreased by half (Fitt et al., 1987). The ‘half-distance’ was calculated only if the coefficient of determination (r2) of the regression was
≥0.8 and the coefficient of variation (cv) was≤0.3.
2.1.3. Effect of drop size and rain duration on total numbers of spores dispersed
Simulated rain was allowed to fall for periods of 5, 10 or 15 min onto source wheat plants with sporulating P. recondita f. sp. tritici (brown rust) or P. striiformis (yellow rust). In each experiment, drops with diame-ters 2.5, 3.4, 4.2 or 4.9 mm were used. At the end of each rain period, both source plants and trap plants were replaced by new ones (Table 1). As an estimate of the total number of spores dispersed, the numbers of lesions or chloroses found were summed over all distances observed. There were five tests with a du-ration of 10 min for the drops of 3.4, 4.2 and 4.9 mm diameter and two tests with drops of 2.5 mm diameter.
2.1.4. Source depletion
Table 1
Summary of the experimental conditions used in the experiments at Grignon and Rothamsteda
Location Physical Biological Incident drop Rain Source Spore
parameters variables diameter (mm) duration plants trapping Grignon, France Rain duration Disease dispersal 2.5, 3.4, 4.2,
4.9
5, 10 or 15 min Changed for each rain period
Plants changed for each rain period Grignon, France Rain duration Source exhaustion 2.5, 3.4, 4.2,
4.9
Source restoration 4.9 periods of 30 min with
bSets of source plants were placed in controlled conditions (temperature 17◦C and light intensity 250
mE m−2s−1) for interruptions between rain periods.
2.1.5. Source recovery
Six sets of source plants were used in this exper-iment; they are referred to as A, B and C when in-fected with brown rust and D, E and F when inin-fected with yellow rust. Each set was exposed to 30 min of rain with a drop diameter of 4.9 mm. After exposure to the rain, each set of plants was placed in a growth room at 17◦C and a light intensity of 250mE m−2s−1 for different times. Sets A and D were kept in the growth room for 2 h, sets B and E for 4 h and sets C and F for 6 h. The range of rain interruptions from 2 to 6 h was chosen so as to obtain a variation in the bi-ological responses to rain interruption change. After these time intervals, rain was allowed to fall on each set of plants for 30 min and any spores released were detected on trap plants as before. New pots of trap plants were used for a second 30 min period of rain (Table 1).
2.2. Experiments with simulated rain and wind
Experiments were done in the rain tower and wind tunnel complex at Rothamsted (Fitt et al., 1986b). The rain tower was 11 m high and linked to the horizontal open ended wind tunnel; both the rain tower and the wind tunnel had 1 m square cross-sections. Air was drawn through the wind tunnel by an axial fan located 12 m upwind of the rain tower. The rain simulator was
of a similar design to that used in the experiments with simulated rain only (Mann et al., 1995).
2.2.1. Source plant, inoculation procedure and spore trapping
tape on each arm was cut into four sections, removed and mounted on microscope slides (McCartney and Lacey, 1990). Spores were counted in five horizon-tal traverses of each slide at a magnification of 200. The spore samplers were placed 2 m downwind of the source plants and 50 cm from the floor of the wind tunnel, at about the same height as the infected plants. As the fall speeds of the brown rust spores were likely to have been in the order of 1 cm s−1(Gregory, 1973), the vertical line of the spore plume at the spore trap would only have varied by about 3–4 cm over the wind speeds used. The spore traps sampled air from a vol-ume several times the diameter of the arms. Therefore, it was unlikely that variations in the position of the spore plume, caused by different wind speeds, would have affected the proportion of the plume sampled by the spore trap.
2.2.2. Combined effect of rain and wind
An experiment was done to measure the effect of wind alone in removing spores from infected leaves. Infected plants were placed at the base of the wind tunnel and exposed to successive 5 min periods wind of different speeds (0.5, 1, 2, 2.5, 3, 4 and 5 m s−1). The rotating-arm traps were changed after each 5 min period. The experiment was repeated three times with different source plants each time.
In a second experiment, source plants were exposed for 20 min to simulated rain of drop size 4.9 mm and a constant wind of either 1 or 4 m s−1. During the tests, the rotating-arm traps were changed every 5 min. The change in concentration with time reflected the changes in spore removal rate from the source. The tests were replicated three times at each wind speed (Table 1).
2.3. Kinetic energy of simulated rain drops
The relationship between fall speed of drops and vertical travel from rest given by Huber et al. (1998) suggests that the water drops in these experiments would have reached close to their terminal velocities before impact. The terminal velocity of a water drop was calculated from V (=386.6 D0.67m s−1, where D is the drop diameter in m; Ulbrich, 1983), and the ki-netic energy EK (D) (=1/2ρπ(D3/6) V2J, whereρ is the drop density in kg m−3) of the drop is given by:
EK(D) = 391 ×105D4.34 (2) Eq. (2) gives EK in J when D is measured in m. This equation was used to investigate the relationship be-tween rain drop kinetic energy and the potential for splash dispersal of the two pathogens.
3. Results
Disease symptoms developed on trap plants in all the experiments, showing that spores of P. recondita f. sp. tritici and P. striiformis were dispersed from infected wheat seedlings by simulated rain alone.
3.1. Dispersal gradients
Because of the time required to assess symptom development, a preliminary experiment was done to assess the variability between individual tests. Sets of source plants were exposed to 10 min of simu-lated rainfall and the dispersal gradients were mea-sured. Three drop diameters, 3.4, 4.2 or 4.9 mm, were used and each test was replicated three times (Fig. 2). Slopes and intercepts of the linear regressions (b in Eq. (1)) for each drop size test were compared using an analysis of position and parallelism (Payne et al., 1993), and the coefficients of determination (r2) and the coefficient of variation (cv) were determined.
Fig. 2. Numbers of brown rust lesions or yellow rust chloroses recorded on trap wheat plants at different distances from infected source plants exposed to simulated rain for 10 min. Incident drop diameters used were 2.5, 3.4, 4.2 or 4.9 mm. Means and standard errors of four replicates are presented (see Section 3).
Table 2
Different regression parameters and half-distances obtained after fitting the linear form of the exponential model (Eq. (1)) to the data of the Fig. 2
Rust Drop diameter aa ba(m−1) Half-distance (m) r2b
Brown 2.5 13.7 4.0 0.17 0.65
3.4 36.6 5.2 0.13 0.92
4.2 49.4 2.9 0.23 0.91
4.9 55.1 2.0 0.34 0.96
Yellow 2.5 7.8 5.5 0.12 0.91
3.4 14.4 3.6 0.19 0.93
4.2 44.7 5.7 0.12 0.93
4.9 75.9 6.7 0.10 0.95
aa and b are the intercept and slope parameters of the linear regression.
br2 is the coefficient of determination.
rust lesions or yellow rust chloroses for the smaller drops were relatively small, especially for the yellow rust, making the gradients more uncertain (Fig. 2). In general, few lesions or chloroses cm−2 were found by distance 84 cm from the source. The number of brown rust lesions or yellow rust chloroses at a given distance from the source depended on both the rain duration and the drop diameter. For a given drop diameter and for both pathogens, spore dispersal in-creased with increasing rain duration. For example, for a drop diameter of 2.5 mm, after 5 min of rain, brown rust lesions were recorded on plants up to 49 cm from the source, whereas after 15 min, they were found on plants up to 63 cm from the source. The increase in distance that the spores travelled was due mainly to dispersal of more spores. For a drop diameter of 4.9 mm, lesions were recorded on plants at distance 84 cm after 5, 10 or 15 min of rain.
3.2. Effect of rain duration on disease severity
Table 3
Effect of increasing drop diameter and rain duration on total numbers of yellow rust and brown rust spores dispersed by simulated rain as estimated by number of lesions and chloroses produced on trap plants at different distancesa
Fungus Rain duration Diameter Total number lesions/chloroses r2b cvc SEDd dfe
Brown rust 5 min 2.5 15 0.96 0.16 0.12 10
3.4 16 0.79 0.21 0.39 14
4.2 28 0.81 0.66 0.40 20
4.9 54 0.77 0.27 0.26 20
10 min 2.5 35 0.65 0.76 0.62 17
3.4 59 0.92 0.26 0.32 18
4.2 156 0.91 0.09 0.22 20
4.9 247 0.96 0.03 0.10 20
15 min 2.5 25 0.93 0.13 0.33 17
3.4 57 0.95 0.31 0.32 19
4.2 100 0.95 0.07 0.15 31
4.9 199 0.78 0.18 0.26 20
Yellow rust 5 min 2.5 3 0.89 0.24 0.28 11
3.4 6 0.87 0.37 0.18 8
4.2 15 0.85 0.78 0.14 16
4.9 41 0.76 0.26 0.17 19
10 min 2.5 11 0.92 0.22 0.25 12
3.4 37 0.93 0.24 0.22 20
4.2 32 0.93 0.34 0.36 20
4.9 81 0.95 0.24 0.3 18
15 min 2.5 22 0.72 0.16 0.27 15
3.4 31 0.81 0.25 0.16 20
4.2 36 0.71 0.31 0.21 17
4.9 52 0.81 0.13 0.15 9
aValues of r2 are from the regression of number of lesions or chloroses over the distance. br2 is the coefficient of determination.
ccv is the coefficient of variation. dSED is the standard error. edf is the degree of freedom.
35 with a drop diameter of 2.5 mm. Generally, the number of brown rust lesions was greater than the number of yellow rust chloroses; e.g. after 15 min of rain with drop diameter of 4.9 mm, the total number of brown rust lesions was 200 compared to 52 yellow rust chloroses. This difference could be partially at-tributed to differences in infection efficiency between the two rusts.
3.3. Effect of rain duration on source depletion
Except for P. striiformis with 2.5 mm incident drops, the total number of brown rust lesions or yellow rust chloroses was always greatest on plants exposed to an initial 10 min period of rain, but decreased for plants exposed to subsequent 10 min periods of rain (Fig. 3). For P. striiformis with 2.5 mm incident drops, the
num-ber of chloroses increased and then decreased with sequential exposure periods. Between 83 to 98% of brown rust lesions or yellow rust chloroses which de-veloped on all the trap plants used in each test were initiated during the first 20 min of rain. Few lesions or chloroses were found on the trap plants exposed to 10 min after 30 min of rain and almost none were recorded after 40 or 50 min, even with 2.5 mm diam-eter incident drops, suggesting that all spores on the source plants had been removed.
3.4. Effect of interrupted rain on restoration of sporulation
Fig. 3. Decrease in numbers of brown rust lesions or yellow rust chloroses produced on the trap plants with continuous exposure of source plants to rain. The Y-axis shows disease symptom pro-duction on trap plants exposed to splashed inoculum for 10 min periods. Trap plants were changed every 10 min. The number of lesions or chloroses is the sum of lesions or chloroses recorded on plants at all distances. The diameters of incident drops used were 2.5, 3.4, 4.2 or 4.9 mm.
first 30 min of rain were used to estimate experimen-tal variability. The standard errors of the toexperimen-tal number of lesions or chloroses produced at all distances were equal to 3.73 and 0.26 for brown and yellow rusts, re-spectively. These estimates were used to test the dif-ferences between the unreplicated treatments after the period allowed for restoration of sporulation.
For the brown rust, the total number of lesions recorded on trap plants exposed to 30 min of inoculum was roughly similar before and after an interruption in rain of 2 h, suggesting that a 2 h time interval be-tween periods of rain was almost sufficient to restore the sporulation rate of the lesions (Fig. 4). The number of spores dispersed tended to increase with increasing length of the interruption period; after a 6 h interrup-tion the disease severity on the trap plants was almost twice of that before the interruption in rain (90 com-pared to 174 lesions). Although the post interruption tests were not replicated (see Section 2), the likely
variability in measurements can be estimated from the variability of the three pre-interruption tests (as de-scribed earlier). The total number of lesions after a 6 h interruption was different from the pre-interruption value (the differences were significant if the variabil-ity is assumed to be the same as for the uninterrupted experiment). In contrast, the total number of chloroses recorded on trap plants after the 2 and 4 h interruption treatments was much smaller than pre-interruption (59 before, 6 after 2 h, 15 after 4 h). This suggests that these interruption times were not long enough to re-store sporulation on the yellow rust lesions. It was only after the 6 h interruption that the number of yel-low rust chloroses recorded on trap plants increased slightly, indicating that the lesions had begun to sporu-late again, although the numbers were about half of those before the interruption (25 compared to 59).
3.5. Combined effect of wind and rain
The flux of spores (number m−2s−1) passing the rotating-arm traps was estimated by multiplying the spore concentration by the wind speed. This gave a measure of the rate of loss of spores from the source plants. In the absence of rain, the flux averaged over 5 min periods increased monotonically with wind speed (Fig. 5a). Although no specific wind speed threshold for spore removal was found, faster wind speeds were more effective at removing spores than slower ones (i.e. the mean flux at 5 m s−1was nearly 10 times that at 1 m s−1). However, spores were re-leased at mean wind speeds as low as 0.5 m s−1. When the source was exposed to simulated rain with 4.9 mm drops and a wind speed of 1 m s−1, the spore flux density initially increased with increasing time of exposure before declining (Fig. 5b). The greatest 5 min average flux was observed after 10 min. In con-trast, at a wind speed of 4 m s−1, the 5 min average spore flux decreased over the 20 min exposure period (Fig. 5b), but spores were still being released after exposure to rain for 20 min.
3.6. Simulated rainfall parameters
Fig. 4. Restoration of spore populations on brown rust (4a and b) and yellow rust (4c and d) lesions after a rain event. Infected source plants were exposed to simulated rain consisting of 4.9 mm diameter drops for 30 min, then incubated under optimal conditions for spore development for 2 h (d), 4 h (j) or 6 h (m), before being exposed to simulated raindrops again for another 30 min. Numbers of lesions or chloroses produced on trap plants at all distances observed from the source before (4a and c) and after (4b and d) the incubation periods are presented.
source plants, Kt, was estimated for each drop size and the three exposure periods (5, 10 and 15 min, see Sec-tion 2.1.3). The relaSec-tionships between the total num-ber of brown rust lesions or yellow rust chloroses, Y, and total kinetic energy Kt of the rainfall is plotted in Fig. 6. For both pathogens, Y was almost proportional to the total kinetic energy; for brown rust, Y=0.70 Kt1.09 (r2=0.8) and for yellow rust, Y=0.24 Kt1.15 (r2=0.8). These relationships mask the decrease in the rate of spore dispersal with longer rain exposures. However, they suggest that for short durations of rain the potential for dispersal of rust spores may be re-lated to the total kinetic energy of incoming splash, assuming all rain droplets can contribute to splash.
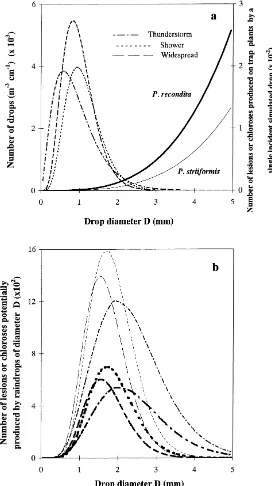
The kinetic energy of drops falling at their termi-nal velocity is proportiotermi-nal to their diameter raised to the power 4.34 (Eq. (2)). As the size distribution of raindrops depends on the type of rain (Ulbrich, 1983), the potential for disease spread may be influenced by the type of rain, as well as its duration. The relation-ship for N(D) given by Ulbrich (1983) (see Huber et al., 1998) and the above relationships between Y
and Ktwere used to evaluate the number of lesions or chloroses potentially produced by raindrops of a given diameter D (Fig. 7b) for a 5 min duration of rain of a given type (thunderstorm, shower and widespread rain) of intensity of 10 mm h−1(Fig. 7a).
4. Discussion
Fig. 5. (a) Change in the flux of brown (Puccinia recondita) rust spores (measured 2 m downwind of infected source plants) with increasing wind speed. Wind speed was increased in seven successive steps of 5 min each. (b) Change in flux of brown rust spore measured 2 m downwind of infected source plants with duration of ‘rain’ and wind speeds of 1 m s−1 (open squares, dotted lines) or 4 m s−1 (filled squares, solid lines). The rotating arm spore traps were changed every 5 min. Means and standard errors of three replicates are presented.
associated with very small splash drops. It is possible that the water drops removed some of the spores by dislodging them on impact. Dry dispersed spores of Passalora personata (late leaf spot of groundnut) have been shown to be removed from lesions by the action of rain splash (Wadia et al., 1997), and Savary and Janeau (1986) concluded that air-borne dispersal of Puccinia arachidis (groundnut rust) spores was asso-ciated with rain. Furthermore wind has been shown to
enhance dispersal of characteristically rain-splashed pathogens such as Colletotrichum acutatum (Yang et al., 1990) and Ascochyta fabae f. sp. lentis (Peder-sen et al., 1994). Although no wind tunnel experiments were done with plants infected with P. striiformis, it is likely that this fungus would have exhibited similar behaviour to P. recondita.
Fig. 6. The relationship between the total kinetic energy of incident drops, Kt (Ln transformed) and the numbers (Ln transformed) of brown rust lesions or yellow rust chloroses subsequently produced on trap plants. Data for rain durations of 5, 10 and 15 min are combined. The regression line equations are given in the text.
Srivastava et al. (1987) also found that these spores could be released at this wind speed. However, in ex-periments using a miniaturised wind-tunnel, Geagea et al. (1997) found that no spores were removed by winds of less than 0.7 m s−1, although they were ap-plied for a much shorter time (10 s compared to 5 min). There was no apparent threshold velocity needed to remove the spores, in contrast to spores of some other wind-dispersed fungi such as Helminthosporium may-dis (Aylor, 1975) and Erysiphe graminis (Hammett and Manners, 1974). Geagea et al. (1997) found that the retention force of brown and yellow rust of spores is lognormally distributed, which could explain why spores were released over a range of wind speeds. It
may be noted that wind speed U affects the horizontal flux density Q (=UC) of spores not only directly (lin-early) but also indirectly by altering the source strength and therefore the concentration C.
The decline in the rate of spore dispersal with time (Fig. 5) for both rusts suggests that the source of spores may quickly become depleted when exposed to rela-tively short periods of ‘heavy’ rain. Thus the decline in source ‘strength’ with rain duration implies that short showers are likely to be particularly effective in spreading brown rust and yellow rust as they are for barley leaf blotch (Fitt et al., 1986a). Exhaustion of spore sources with time has been observed by other workers (Madden et al., 1992).
The time needed to restore the spore source after spore removal by rain was different for brown rust and yellow rust. For brown rust, spore populations recov-ered in 2–4 h under optimal conditions, but for yel-low rust spore numbers had not fully recovered by 6 h after depletion. Rapilly et al. (1970) found that 5 h was necessary to restore spore numbers in yellow rust chloroses. In the experiment with brown rust, after 6 h in the growth room, spore availability (indicated by the number of lesions which developed on the trap plants) was about double than that before depletion. This increase may have occurred because 6 h under favourable conditions would have induced new spores and also allowed spores located at the bottom of the sorus to mature and detach their pedicels and so be easily removed. Thus a series of short showers sep-arated by a few hours may encourage the spread of brown rust, but not yellow rust.
Fig. 7. Simulated variation in potential disease severity as a function of drop diameter for three types of rain (thunderstorm, shower and widespread rain): (a) distribution of drop sizes and number of lesions or chloroses produced on trap plants by a single drop of diameter
D, (b) simulated number of lesions or chloroses potentially produced by raindrops of diameter D. Rain duration and rain intensity were
The experimental results suggest that large drops dispersed more spores (numbers of lesions and chloroses found on trap plants were greater) than small drops and that these spores travelled greater distances. Other studies have also shown that large drops are more effective in dispersing splash-borne inoculum (Huber et al., 1996). Thus rain drop size distribution may play an important role in potential dispersal of these two pathogens as well as its ki-netic energy. Simulations, based on the relationship between rain kinetic energy and disease symptom development show a compensation effect between number of drops of a given diameter and their kinetic energy. Small drops are very numerous but they have reduced kinetic energy and they do not contribute to disease spread at large scales. Large drops are rare in a natural rainfall but they have great kinetic energy and thus lead to more spore dispersal (Fig. 7a and b).
5. Conclusions
This study has demonstrated that rain has the po-tential to remove and disperse spores of both brown rust and yellow rust of wheat. Distances travelled by dispersed spores were greater in the wind tunnel ex-periments than in still air exex-periments. Exex-periments in still air showed that spore sources were exhausted with time and that short showers separated by at least 4 h could enhance the spread of brown rust. However, the exact role of rain dispersal in the epidemiology of both diseases is not fully understood. Further work, particularly in wheat crops, is needed to clarify the re-lationship between wind and rain dispersal in brown rust and yellow rust development.
Acknowledgements
The project was supported by funds from the Insti-tut National de la Recherche Agronomique (INRA, EcoPath program, France), the Biotechnology and Biological Sciences Research Council (BBSRC, UK), the European Union (COST program, 8.17), the British Council (UK) and the Ministère des Affaires Etrangères (France).
References
Aylor, D.E., 1975. Force required to detach conidia of
Helminthosporium maydis. Plant Physiol. 55, 99–101.
Clifford, B.C., Harris, R.G., 1981. Controlled environment studies of the epidemic potential of Puccinia recondita f. sp. tritici on wheat in Britain. Trans. Br. Mycol. Soc. 77, 351–358. Fitt, B.D.L., McCartney, H.A., 1986. Spore dispersal in splash
droplets, pp 87–104. In: Ayres, P.G., Boddy, L. (Eds.), Water, Fungi and Plants. Cambridge University Press, Cambridge, 413 pp.
Fitt, B.D.L., Creighton, N.F., Lacey, M.E., McCartney, H.A., 1986a. Effects of rain fall intensity and duration on dispersal of Rhynchosporium secalis conidia from infected barley leaves. Trans. Br. Mycol. Soc. 86, 611–618.
Fitt, B.D.L., Walklate, P.J., McCartney, H.A., Bainbridge, A., Creighton, N.F., Hirst, J.M., Lacey, M.E., Legg, B.J., 1986b. A rain tower and wind tunnel for studying the dispersal of plant pathogens by rain and wind. Ann. Appl. Biol. 109, 661–671. Fitt, B.D.L., Gregory, P.H., Todd, A.D., McCartney, H.A.,
Macdonald, O.C., 1987. Spore dispersal and plant disease gradients; a comparison between two empirical models. J. Phytopathol. 118, 227–242.
Fitt, B.D.L., McCartney, H.A., Walklate, P.J., 1989. The role of rain in dispersal of pathogen inoculum. Ann. Rev. Phytopathol. 27, 241–270.
Geagea, L., Huber, L., Sache, I., 1997. Removal of urediniospores of brown (Puccinia recondita f. sp. tritici) and yellow (P.
striiformis) rusts of wheat from infected leaves submitted to a
mechanical stress. E. J. Plant Pathol. 103, 785–793.
Geagea, L., Huber, L., Sache, I., 1999. Dry-dispersal and rain-splash of brown (Puccinia recondita f. sp. tritici) and yellow (P. striiformis) rust spores from infected wheat leaves exposed to simulated raindrops. Plant Pathol. 48, 472–482. Gregory, P.H., 1973. Aerobiology of the Atmosphere. Leonard
Hill, Aylesbury, 377 pp.
Hammett, K.R.W., Manners, J.G., 1974. Conidium liberation in
Erisiphe graminis III: wind tunnel studies. Trans. Br. Mycol.
Soc. 62, 267–282.
Hau, B., de Vallavieille-Pope, C., 1998. Wind-dispersed diseases. In: Gareth Jones, D. (Ed.), The Epidemiology of Plant Diseases. Kluwer Academic Publishers, Dordrecht, pp. 323–347. Huber, L., Fitt, B.D.L., McCartney, H.A., 1996. The incorporation
of pathogen spores into rain-splash droplets: a modelling approach. Plant Pathol. 45, 506–517.
Huber, L., Madden, L.V., Fitt, B.D.L., 1998. Rain-splash and spore dispersal: a physical perspective. In: Jones, D.G. (Ed.), The Epidemiology of Plant Diseases. Kluwer Academic Publishers, Dordrecht, pp 348–370.
Madden, L.V., 1992. Rainfall and the dispersal of fungal spores. Adv. Plant Pathol. 8, 39–79.
Madden, L.V., Wilson, L.L., Yang, X., Ellis, M.A., 1992. Splash dispersal of Colletotrichum acutatum and Phytophthora
cactorum by short-duration simulated rains. Plant Pathol. 41,
427–436.
Mann, J.A., Tatchell, G.M., Dupuch, M.J., Harrington, R., Clark, S.J., McCartney, H.A., 1995. Movement of apterous Sitobion
avenae (Homoptera: aphididae) in response to leaf perturbations
caused by wind and rain. Ann. Appl. Biol. 126, 417–427. McCartney, H.A., Lacey, M.E., 1990. The production and release
of ascospores of Pyrenopeziza brassicae Sutton and Rawlinson on oilseed rape. Plant Pathol. 39, 17–32.
McCartney, H.A., Fitt, B.D.L., Schmechel, D., 1997. Sampling bioaerosols in plant pathology. J. Aerosol. Sc. 28, 349–364. Nagarajan, S., Singh, D.V., 1990. Long-distance dispersion of rust
pathogens. Ann. Rev. Phytopathol. 28, 139–153.
Ntahimpera, N., Madden, L.V., Wilson, L.L., 1997. Effect of rain distibution alteration on splash dispersal of Colletotrichum
acutatum. Phytopathol. 87, 649–655.
Park, R.F., 1990. The role of temperature and rainfall in the epidemiology of Puccinia striiformis f. sp. tritici in the summer rainfall area of eastern Australia. Plant Pathol. 39, 416–423. Payne, R.W., Lane, P.W., Dighy, P.G.N., Harding, S.A., Leech,
P.K., Morgan, G.W. et al., 1993. Genstat 5 Release 3 Reference Manual. Clarendon Press, Oxford, 796 pp.
Pedersen, E.A., Morall, R.A.A., McCartney, H.A., Fitt, B.D.L., 1994. Dispersal of conidia of Aschochyta fabae f. sp. lentis from infected lentil plants by simulated wind and rain. Plant Pathol. 43, 50–55.
Rapilly, F., Fournet, F., Skajemmikoff, M., 1970. Etudes sur l’épidémiologie et la biologie de la rouille jaune du blé Puccinia
striiformis. Westend. Ann. Phytopathol. 2, 5–31.
Rapilly, F., 1979. Yellow rust epidemiology. Ann. Rev. Phytopathol. 17, 59–73.
Reynolds, K.M., Bulger, M.A., Madden, L.V., Ellis, M.A., 1987. New methods using simulated rain to study the splash dispersal of plant pathogens. Phytopathol. 77, 921–926.
Rowell, J.B., Romig, R.W., 1966. Detection of urediospores of wheat rusts in spring rains. Phytopathol. 56, 807–811. Savary, S., Janeau, J.L., 1986. Rain-induced dispersal in Puccinia
arachidis, studied by means of a rainfall simulator. Neth. J.
Plant Pathol. 92, 163–174.
Srivastava, K.D., Joshi, L.M., Nagarajan, S., 1987. Liberation of uredospores of Puccinia recondita tritici under varying wind speeds. Ind. Phytopathol. 40, 474–477.
Ulbrich, C.W., 1983. Natural variations in the analytical form of the raindrop size distribution. J. Climate Appl. Meteorol. 22, 1764–1775.
Wadia, K.D.R., McCartney, H.A., Butler, D.R., 1997. Dispersal of conidia of Phaeoisaropsis personata from groundnut by wind and rain. Mycol. Res. 102, 355–360.
Yang, X., Madden, L.V., Wilson, L.L., Ellis, M.A., 1990. Effects of surface topography and rain intensity on splash dispersal of Colletotrichum acutatum. Phytopathol. 80, 1115–1120.