SPACE BASED INFORMATION SUPPORT FOR DECENTRALISED PLANNING (SIS-DP) - A
CASE STUDY OF BALANGIR DISTRICT, ODISHA, INDIA.
P Kumar1, S.K.Dash1, R.R. Thakur1, S.Jonna2 and S.Tripathi1 1
Odisha Space Applications Centre (ORSAC), Bhubaneswar-751023,[email protected] 2
National Remote Sensing Centre (NRSC), ISRO, Hyderabad.
KEY WORDS: Remote Sensing, GIS, Ortho-rectified Image, Decentralized Planning,
ABSTRACT:
The state government is now focusing on decentralized planning and created administrative infrastructure for Gram Panchayat (Village Community) level planning in participatory way. The people are now opening up and started taking part in planning process at grass root level. In order to involve the people and make planning exercise more effective, National Remote Sensing Centre(ISRO), Dept. of Space(DOS) have begun activities using GIS and Communication Technology(Geo-Ict). Considering the potential of Geo-Ict a project titled “Space Based Information Support for Decentralized Planning (SIS-DP)” was launched by NRSC/ISRO under PC-NNRMS, DOS, Govt. of India. Odisha Space Applications Centre as a partner institution, have ful-filled the commitment of generating thematic information on 1:10K from High resolution satellite data (Ortho-Rectified Cartosat-1 & LISS-IV data) for the state of Odisha. Thematic information on Land use, Settlements, Infrastructure and drainage have been generated and started dissemination to the users. The attribute information available from line department have also been linked to spatial framework of the SIS-DP layers. In the present study Bolangir, a drought prone and backward district is taken up. Total 285 thematic maps have been prepared at Gram Panchayat level keeping a buffer of 1.5k.m to locally adjust any discrepancies in the boundary. User workshop and awareness campaigns were conducted and feed backs have been collected on Land Utilization Types (LUT). It is felt that extension of these services to the entire State have a strong bearing on improved strategy and planning process by the State.
1. INTRODUCTION:
1.1 Decentralised planning:
Annual planning processes followed in India in earlier years ignored the role of local bodies such as Panchayat, Municipalities, Blocks, Districts. These processes were not participatory in nature and lacked scientific approach which resulted in total failure. Hence the concept of Decentralized Planning emerged. The decentralized planning at local level was introduced in the Eleventh Schedule of the 73rd Constitutional Amendment. The 73rd and 74th a Amendment led to the establishment of Panchayat at village and local self government at block and district levels. It envisaged planning units to operate their budgets exercise their skills and take holistic initiative in the development of that local area. The first pre-requisite of a successful local area planning is up-to date and near real -time information on natural resources, infrastructure, population etc. in integrated spatial format. The information should be organized in such a way that these can be scientific, low cost, integrated and up-to date. Such database can be scientifically analyzed and various development scenarios can be displayed.
1.2 Geo-ICT Solutions to Decentralized Planning:
Innovations in Satellite Remote Sensing, Global Positioning System, Information Technology and Geographical Information System have the capabilities of generating, capturing, integrating and analyzing spatial and non-spatial information of a local area. These base line data can be stored, manipulated and displayed on computer screen so that decision makers at all level can plan and manage their localities in integrated and inclusive ways. Remote Sensing and GIS technologies enable the local area planners to create various natural resources information in shortest possible time and repeatedly allow further analysis in systematic, compatible and quantitative manner. This will considerably enhance the quality of decentralized planning on the outset.
With these things in mind the project titled “Space Based Information Support for Decentralized
Planning” (SIS-DP) had been launched by the National Remote Sensing Centre (NRSC)/Indian Space Research Organization (ISRO) and enables local bodies for carrying out developmental activities in a decentralized, timely and transparent manner. Under this project the Odisha Space Applications Centre (ORSAC) has undertaken the task of generating natural resources, infrastructure, settlement and drainage information at 1:10, 000 scale for the entire state of Odisha.
1.3 Study Area:
The district of Balangir lies between 20008’53” and 21004’13”North latitudes and 82041’40” and 83039’15”East longitude. The district is flanked by Bargarh district on the north, Subarnapur district on north east, Boudh district on the east, Kalahandi district on the south-east and
Nuapada district on the west. The district has a geographical area of 6,575 Sq.k.m and its population as per 2011 census is 1, 648, 574 with literacy rate of 64.72%. There is an increase of 23.29% in the population compared to 2001. The density of population is 251 in 2011 compared to 203 in 2001. The tribes such as Binjhal, Dal, Gond, Kondha, Mirdhas, Munda, Sabara, Lodhas together constitute 97% of the tribal population. The caste such as Bariki, Chamar, Dhoba, Dom, Ganda,Ghasi, Mehra constitute 96.6% of Schedule Caste population. The economy of Balangir is agriculture which is not developed. Though Rice is the principal crop in the low land, Pulses, cotton and sugarcane occupy the uplands. Forestry is the secondary occupation of people. The district has a low agricultural productivity of which more than 2/3rd population depend for their livelihood. There are many landless labourers. Due to acute poverty every year the people from Balangir migrate to others states of India in pursuit of their livelihood. There are a few small industries and disorganized cottage industries. Mineral resources of the district are too in-adequate to provide large scale development. However there is considerable scope of agro-based industries. The great famine of 1899-2000 cost considerable loss of population in the district. The district comprises of 1794 Villages, 285 Gram Panchayats, 14 Blocks, 3 Sub-divisions, 1 Municipality and 3 NAC. The western part of the district is an undulating plain, rugged and isolated, with hill ranges running in various directions. A lofty irregular range called Gandhamardhan hills forms the natural boundary to the north-west. The soil in this area is light and sandy. The main forest area stretches along the western boundary bordering the Nuapada those flow inside the district of Balangir are Undar, Lanth, Sungad and Suktel.Balangir constitute a portion of peninsular India. There are a number of large tanks which are utilized for irrigation and drinking water. It has a largely remained a table land, a mass of great rigidity and has not been affected by the inner movement of Earth. The district has ores of Graphite, Galena(Lead), Manganese and Bauxite. The district has an average temperature of 30C to 460C and the average rainfall of 1443 mm. The forests of Balangir are Sal, Teak, Bamboo and other mixed forest. Certain parts of Gandhamardhan hills abound in medicinal plant.
The International Archives of the Photogrammetry, Remote Sensing and Spatial Information Sciences, Volume XL-8, 2014
ISPRS Technical Commission VIII Symposium, 09 – 12 December 2014, Hyderabad, India
This contribution has been peer-reviewed.
2. SATELLITE DATA USED & METHODOLOGY
The study was made utilizing High Resolution Ortho-Rectified Satellite data Cartosat-1(PAN) and Resourcesat-1(LISS-IV Mx) on 10,000 scale. The PAN sensor has spatial resolution of 2.5m and the LISS-IV Mx has a resolution of 5.8m.
Ortho photo was prepared by the following methods. Cartosat-1 stereo –image of the period 2008-2011 was used for Block preparation using Leica Photogrammetry Suite. Control points (provided by NRSC) were added to the Block and Block Triangulation was under taken. Then, DEM editing was under taken by manual method. Ortho-photo and mosaic were generated subsequently. Then Resolution Merged data was prepared using the Cartosat Ortho-Rectified images and Resourcesat LISS-IV data.The Ortho-rectified satellite data was interpreted by onscreen visual interpretation using ARC-GIS software in 10,000 scale. The following layers were generated viz.,(i)Land use/Land cover (Polygon),(ii)Drainage (Line),(iii)Infrastructure (Roads & Rails), (Line),(iv)Settlement (Polygon).These layers were overlaid on Gram Panchayat boundary and linked with GP wise socio-economic data resulting in GP wise GIS database. All administrative boundaries such as village, GP, Block and Assembly constituency have been super imposed with the space input maps.
The following Legacy Data available in 1:50,000 scale were registered with Ortho-rectified Cartosat Data and integrated with the GIS Database viz.,1. Adiministrative details-District, Block, Gram Panchayat, Village & Asseembly/Parliament constituency boundaries,2. Land use/Land cover,3. Geomorphology,4. Soil,5. Litho logy,6. Ground Water,7. Drainage (polygon),8. Drainage (line),9. Canal,10. Slope,11. Wasteland,12. Watershed,13. Land degradation,14. Settlement,15. Transportation (Railway/Road lines)
The following stake –holder’s data(point data) collected for the entire district of Balangir were also inked to the GIS database of the district. ,viz., Census, Village level organization, Agricultural service facilities, Fisheries service facilities, Commercial centres, Educational facilities, Health facilities, Industries, Public utilities, Women & child care facilities, Banking facilities, Communication facilities, Drinking water facilities, Livestock facilities
3. RESULTS AND DISCUSSION
GP wise maps on landuse/land cover, infrastructure, settlement and drainage were provided to all Block Development Officers of the Balangir district as PDF files (Figures 1-3).This enabled the local people and planning officials for grass root planning.
(i)The land use/ land cover breakup of Balangir district is given in Table-1. The GP wise wastelands, which were identified were earmarked for agriculture and plantation purposes. Water bodies were identified for programmes in aquaculture/pisciculture. Gullied and ravenous lands could be now taken for soil conservation measures. The local people and line department officials could now plan the development of the GP in an inclusive way.
(ii)The Infrastructure layer identified National Highway, State Highway, District roads, Village roads, City roads, Cart tracks and Foot paths (Table-2). This helped the local people and planners to make connectivity studies and propose new roads or up gradation of existing
Table-1 Land Use /Land cover Area break up of Balangir district
Built-up land Area (in hectare) and distributary canals. By use of the drainage map the local people and the planners could plan
The International Archives of the Photogrammetry, Remote Sensing and Spatial Information Sciences, Volume XL-8, 2014
ISPRS Technical Commission VIII Symposium, 09 – 12 December 2014, Hyderabad, India
This contribution has been peer-reviewed.
water harvesting structures and check dams. Proposed canals could be taken up.
Figure 1. Landuse Landcover Map
The spatial information helped Integrated Watershed Management Programmes in constructing Water Harvesting Structures(WHS), conservation plans and linked poverty alleviation programmes.
Table-2 Infrastructure Network
Types of Road Length in k.m
National Highway 190.24
State Highway 157.12
City roads 7.13
District roads 489.96
Village road Pucca 7596.73
Village road Kachha 6379.9
Cart track 0.14
Footpath 4516.36
Total 19337.58 Rail line 176.53
(iv)The settlement map helped in transport planning exercises.
(v) The GIS database of the district now holds all information as points, line & polygons in an integrated manner and can be analyzed in various ways. Thus the local people and planners could now display and analyse various information on computer screen. The site suitability, correlation studies and future projections could now be under taken. Thus it became possible to address querries such as: Where should I plant tree? Which crop I should cultivate and where? Where should I construct Water Harvesting Structures? Where should I build School, Health
centre, Agriculture/Fisheries/Livestock’s service facilities? Where should I locate Drinking water
facilities? Which Roads I should develop further? etc. It also became possible to site and link various poverty alleviation programmes of the Government .
Figure 2. Infrastructure Map
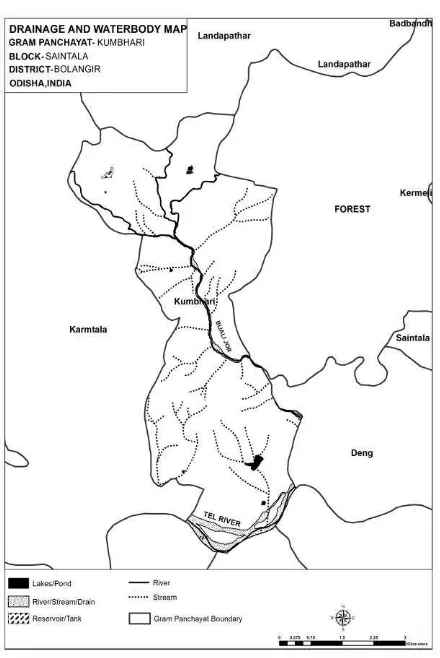
Figure 3. Drainage Map
The International Archives of the Photogrammetry, Remote Sensing and Spatial Information Sciences, Volume XL-8, 2014
ISPRS Technical Commission VIII Symposium, 09 – 12 December 2014, Hyderabad, India
This contribution has been peer-reviewed.
4. CONCLUSION
The above studies demonstrated how Remote Sensing & GIS technology could generate low cost, up-to date, integrated information required for decentralized planning exercises where the planning officials and local people could work together in planning, monitoring, management of all aspects of locality in quantitative, time bound and transparent manner.
5. REFERENCES
NRSC, 2011, Preparation of Geo-Spatial Layers using High Resolution(Cartosat-1 PAN+ LISS-IV Mx) Ortho-rectified Satellite Images. NRSC, ISRO, Issue No 02.Rev.Ver.201.PP-206. Pattanaik P. and others. Odisha Reference Year book 2013, B.K. Publication Pvt.Ltd. Senapati N & Sahu N.K, 1968, Odisha District Gazetteer, Balangir, Govt. press, Cuttack. Sinha B.N, Geography of Orissa, Published by National Book Trust, India, ed.1999