Semi-automated Technique to Extract Boundary of Valley/mountain Glaciers using
Glacio-morphological Information from Digital Elevation Model
Manab Chakrabortya*, Sushma Panigrahyb, Sanchayita Kundua
a
Geo-Science Applications Group, Space Applications Centre, Indian Space Research Organisation, Ahmedabad 380 015, India bFormerly with Space Applications Centre, Indian Space Research Organisation, Ahmedabad 380 015, India
*Corresponding Author: Email: [email protected], (Tel) +91-79-26914141
Keywords:Glacial boundary, Digital Elevation Model (DEM), morphology, slope, terrain curvatures, Himalayas
ABSTRACT:
A semi automated technique has been developed to extract the spatial extension of valleys and mountain glaciers. The method is based on morphological properties of glaciated area extracted from Digital Elevation Model (DEM). Identification of glacial boundary based on spectral information from optical remote sensing imageries produces errors due to misclassification of debris-covered ablation area with surrounding rocky terrain and perennially snow-covered slope with debris free glaciated area. Elevation information DEM of Shuttle Radar Topography Mission (SRTM), CartoDEM and ASTER DEM have been used. A part of western Himalayas was selected as the study area that contains large glaciated basins, e.g., Bhagirathi, Baspa, Chandra basin. First order derivatives, slope aspect, and second order derivatives like, profile and plan curvatures are computed from the DEM. The derivatives are used to quantify and characterise the morphological aspects of the glaciated area and used in the decision rule models to generate the glacial boundaries. The ridge lines of the study areas are also generated from the plan curvature and used in the model to delineate the catchments areas of the glaciers. The slope based boundary is checked for consistency with the boundary from profile curvature and combined manually to generate the final glacier boundary. Area and length under the derived boundary of Gangotri glacier of Bhagirathi catchments are 90.25 sq km and 30.5 km. The result has been checked with high resolution optical data. This objective approach is important to delineate glaciated area, measure the length, width and area and generate glacial hypsometry, concentration factor of the glaciers. Accuracy of the result depends up on the quality of the DEM. DEM generated by SAR interferometric technique is found superior over DEM generated from other interpolation techniques.
1. INTRODUCTION
Glaciers are important dynamic part of the environment. It is the
largest storage of fresh water over the earth’s surface.
Requirement of glacier melt water during the lean season has been increased. Rivers of northern India, originated from glacier melt water, affect the quality of life of millions of people and are the source of hydro-electric power at higher altitude. Retreat of Himalayan glaciers is one of the major concerns of glaciologists to understand the glacial response to climate change. To quantify the changes, it is important to have correct glacial boundaries. Extensive field surveys to mark the boundary of mountain glaciers, especially Himalayan or other high altitude glaciers are difficult. Remote sensing techniques by interpreting air borne or space borne imageries have become popular as a substitute of this.
Present day’s optical satellite data are mostly used for either
generation and updating of glacial inventories. Delineation of glacial boundaries based on spectral information from optical images often suffers from misinterpretation of debris covered ice at the ablation area with surrounded rocks and glacial debris. Accumulation area of the glaciated region also produces error due to similar spectral signature of glacier and perennially snow
covered slopes. To minimise the discrepancies in identification of glacial boundary with subjective approach, an objective technique is required to be developed. Independent from spectral information, this initiative is to develop a semi-automated objective technique to extract the boundary of valley or mountain glacier using the glacio-morphological characteristics derived from Digital Elevation Model (DEM).
in contact with lateral moraines. This information is used to identify the glacial boundary (Bishop et. al. 2000). Optical remote sensing data combining with geomorphological information has also been applied as another approach to differentiate the debris covered ice of the glacier from surrounding rocky sidewall or depositional features like lateral moraine (Paul, Huggel and Kaab, 2004, Bishop et. al., 2001).
Boundary of accumulation zone of the glacier is delineated by visual interpretation from multi-temporal images. Spectral separation of snow covered glacier and snow covered side slopes of the mountains is difficult and leads to errors in delineation of glaciated area. Use of geomorphological information also helps to identify the glaciated area even in the accumulation region. In this context, delineation of complete glacial boundary using DEM is proposed as an objective and robust approach.
2. STUDY AREA & DATA USED
Glaciated region of western Himalayans has been selected as study area. The area covers many important glaciated basins of the Himalayas, namely, Alaknanda, Bhagirathi, Baspa, Chandra, Bhaga, Bhut etc. The area is situated between 30° N - 35° N latitude and 75° E - 80° E longitude (figure 1). Gangotri glacier system of Bhagirathi catchment area is studied in detail.
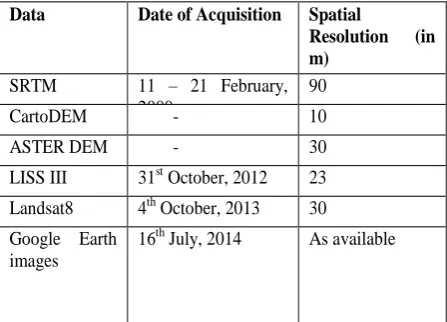
Digital Elevation Models (DEM) from Shuttle Radar Topography Mission (SRTM), CartoDEM and ASTER data have been used. Gangotri glacier has been studied in detail. Optical remote sensing data from LISS III sensor of IRS and Landsat8 satellites have also employed to check the consistency of the derived boundary with optical data. High resolution optical data available from free earth explorer browser, Google earth, is used for validating the boundary and identifying geo-morphic features of the glacier, especially at accumulation area. PCI Geomatica 9.0 software is used for the entire processing of the work. Table 1 describes the details of the data used for the study.
Data Date of Acquisition Spatial
Resolution (in
Table 1: Details of the data used for extraction of glacial boundary over the Himalayan region
Figure 1: Location map of the study area. Colour boxes are representing the extent of the DEMs of the corresponding data as given in the legend. Black lines are showing state boundaries of India.
3. METHODOLOGY
Glacial valleys are developed or modified according to the force and mechanism applied by the glacial mass, like abrasion, plucking and polishing. Coarse debris carried by the glacier erodes the valley at the time of flow (Singh, 1998). The rate of erosion and deposition is controlled by terrain characteristics.
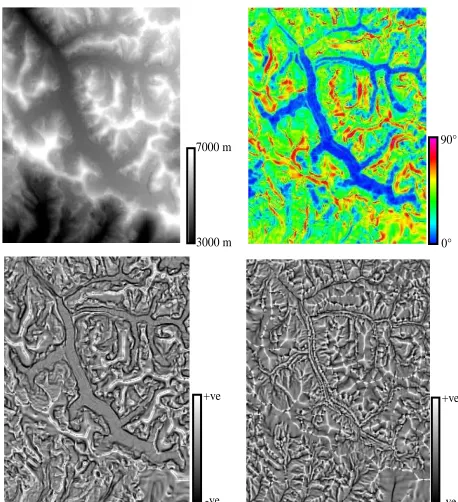
The rate of change of the surface in the horizontal (dz/dx) and vertical (dz/dy) directions from the center cell determines the slope (figure 2). The basic algorithm used to calculate the slope is:
slope_radians = ATAN (√ ([dz/dx] 2 + [dz/dy] 2)) (1) Slope is commonly measured in degrees and values between 0° - 90° (figure 3a, 3b), which uses the algorithm:
Figure 2: 3 x 3 gridded raster DEM having altitude information, Z1, Z2, …Z9.
The average slope of the alpine glacial surface lies around 10°-12° (figure 3a, 3b). The slope mostly remains below 20° (Bishop et al. 2001; Paul, Huggel and Kaab, 2004; Bolch et al. 2007; Negi et al. 2012; Racoviteanu and Williams 2012). In the case of mountain glaciers slope of the glacier surface sometimes exceed 20°. According to the definition of glacial flow, the viscous movement of the mass discontinues if the slope increases above 30°. Above this slope, mass wastes under the impact of gravity which does not follow plastic flow mechanism (Barnard, et. al., 2001).
Mass flow is also affected by the terrain curvature. From an applied viewpoint, the output of the derived curvature can be used to understand the types and stages of denudational process. The profile curvature of the terrain is the derivative of slope in the vertical direction. In profile curvature, changes of slope are clearly identifiable where glacier surface contacts with rocky side wall (figure 3c). The plan curvature of the terrain contour is the derivative of slope in the horizontal direction is used to delineate mass flow lines. The plan curvature influences convergence and divergence of flow (figure 3d; Moore, Grayson and Landson, 1991; Zeverbergen and Thorne, 1987).
The curvature of a surface is calculated on cell-by-cell basis. The fourth-order polynomial equation is given below:
Z = Ax²y² + Bx²y + Cxy² + Dx² + Ey² + Fxy + Gx + Hy + I (2)
Where,
A = [(Z1 + Z3 + Z7 + Z9) / 4 - (Z2 + Z4 + Z6 + Z8) /2 + Z5] / L4
B = [(Z1 + Z3 - Z7 - Z9) /4 - (Z2 - Z8) /2] / L3
C = [(-Z1 + Z3 - Z7 + Z9) /4 + (Z4 - Z6)] /2] / L3
D = [(Z4 + Z6) /2 - Z5] / L2
E = [(Z2 + Z8) /2 - Z5] / L2
F = (-Z1 + Z3 + Z7 - Z9) / 4L2
G = (-Z4 + Z6) / 2L
H = (Z2 - Z8) / 2L and I = Z5
Figure 3a: Altitude information of Gangotri glacier from SRTM DEM (90 m spatial resolution). Slope, profile and plan curvature are derived from DEM and shown in Figure 3b, 3c, 3d respectively. The bluish tone is representing area having low slope (< 20°). Red colour in the image is associated with mountain ridges. The dark black areas in figure 3c have negative profile curvature and ridges have positive slope in the image. In figure 3d, the valleys are showing negative plan curvature and the ridge lines have positive. River channels are well detected by the single dark line in the plan curvature image.
The plan and profile curvatures can be used to describe the physical characteristics of a drainage basin. Changes in the slope are identified by the curvature information. The terrain has positive profile curvature if it is convex in vertical direction and vice versa. It affects the acceleration and deceleration of flow to down slope. Sudden changes in profile curvature within the glaciated region can bring changes in ice flow mechanism. The terrain slope has positive plan curvature if it is convex outside in horizontal direction and vice versa. The figure 4 describes how the profile curvature changes when glacier bed contacts with rocky side slopes.
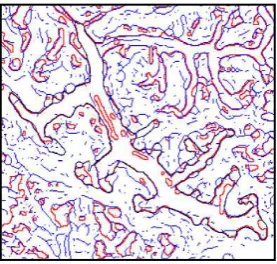
The decision rule has been developed for identification of the area having slope <25° and profile curvature having values between -0.001 to --0.0019. Figure 5 is showing the outputs of the model. The red lines have been generated surrounding the pixel patches classified under the slope class (<25°). Another boundary has been generated from curvature thresholds. The two output lines are overlapped and manually traced to obtain the glacier boundary. In some area, where one of the line layers is discontinued, another will guide to delineate the boundary.
7000 m
3000 m 0°
90°
-ve
+ve +ve
Figure 4: The transverse profile of the Gangotri glacier near 5300 m altitude. The profile shows how the slope changes suddenly when glacier bed contacts with rocky sidewall. The profile curvature observed at this point varies between -0.001 to -0.0019.
Figure 5: Model based automated glacial boundary from profile curvature (blue) and slope (red). Manually digitized glacial boundary is shown by black line. The boundary has been digitized using the two automated boundaries from curvature and slope.
4. RESULT & DISCUSSION
The boundary of the Gangotri glacier has been delineated using the developed model based on glacio-morphological information. The model derived outputs are overlapped over the optical remote sensing data from LISS III of 31st October 2012 (Figure 6). The resulted boundary of Gangotri glacier shows a consistency with optical imagery.
Figure 6: Boundary delineated from the morphological information of valley glacier is overlaid on optical remote sensing image acquired by LISS III sensor (31st October 2012; false colour combination: Red- Band 5, Green- Band 4 and Blue- Band).
Figure 7: Google earth image (date of the image 15th June 2014) of Mandani peak, situated at south bank of Gangotri glacier. North facing slope of the ridge is often included as glaciated region whereas, clear scar of avalanche is visible. Bergschrund defining the boundary of the glacier is also identified at the base of the ridge.
Area and length under the derived boundary of Gangotri glacier are 90.25 sq km and 30.5 km respectively. The snout position identified at 3993 m. The boundary generated from SRTM DEM and its derivatives, represents glaciated area of the year 2000 (acquisition period of the input data). Therefore, changes in glaciated region may be quantified using multi-temporal DEMs.
The boundary of Gangotri glacier composed by Sharma and Owen, 1996 are also used for comparison. The published boundary is matched with the current derived results in most of the areas. The previous boundary was demarcated considering different glacio-morphological characteristics, like lateral moraines, Bergschrund etc. Bergschrund looks like cracks and develops at the head part of glacier due to the changes in flow mechanism. It indicates the head of glacier. In higher resolution data the published boundary is matched with the Bergschrund lines at accumulation zone and negative profile curvature line at ablation region.
High resolution optical data has also been used for identifying glacio-morphological features. The Bergschrund is observed near the headwall of the glaciers. Sun shadowed north facing slope of
Scar of Avalanche Scar of Avalanche
Crevasses Crevasses
Mandani Peak
Ridge Line Gangotri Glacier
Bergschrund
Mandani Peak has perennial snow on it. In many cases, this slope has been included within the glacial boundary. However, the scar marks, visible in the high resolution optical data over the snow covered slope, indicate the avalanche type mass wasting to downslope (figure 7). The slope of this sidewall of Gangotri glacier is more than 35°. This area acts as a catchment area of the glacier which accumulates and supplies snow by down wasting the mass through avalanche mechanism. Mass movement of the glacier is, however, completely different from avalanche mechanism. The ice mass of the glacier is transported by plastics flow mechanism and generated over region having slopes less than 25° as stated earlier.
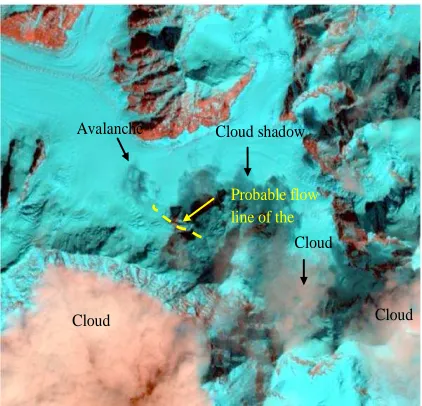
Figure 9: Incidence of an avalanche has been captured by Landsat8 satellite on 4th October, 2013(false colour combination: Red- Band 6, Green- Band 5 and Blue- Band 4). The probable snow mass from the north facing slope of Chaukhabma IV peak. In many cases, this area has been included as glaciated region which is only a part of catchment region of Gangotri glacier.
5. CONCLUSION
The developed methodology is based on the only glacio-morphologic characteristics. The glacio-morphological features are not identifiable directly from the DEM. The derivatives of DEM produce the information and can be used for demarcation of glaciated area. Optical images are widely used for glacial boundary delineation. The process often excludes debris covered ablation area and includes snow covered sidewall of the glacier. The new method is independent from spectral signatures of the target objects and therefore similar types of errors are avoidable.
Being primarily dependent on particular fixed range of slope and profile curvature, the model is consistent for any part of glaciated the region. Human interpretation is required only to digitize the final boundary using the two model-derived outputs. The model takes less time to classify the boundary than manual digitization. The accuracy of the result is however depending on quality of the DEM. It is also important to check the date of the source data which is used for generating the DEM. Use of old DEM will produce glacial boundary of that particular time and deviate from from the current glacial boundary. The limitation of the model is that it is unable to detect the ice divides where slope is too low at head part. The curvature of the contour line is required to delineate the head part of the glacier. The deglaciated valleys are also identified by the model associating with optical remote sensing image. The model derived result is suitable for hypsometrical studies of glacier valley and other related glaciological analysis.
References
Barnard, P. L., Owen L. A., Sharma M. C., Finkel R. C. 2001. Natural and human-induced landsliding in the Garhwal Himalaya of northern India, Geomorphology, Vol 40, pp. 21–35.
Bishop, M. P., Bonk, R., Kamp, U. and Shroder, J. F., 2001. Terrain analysis and data modelling for alpine glacier mapping.
Polar Geography, Vol 25, pp. 182-201.
Bishop, M. P., Kargel, J. S., Kieffer, H. H., MacKinnon, D. J., Raup, B. H., & Shroder Jr., J. F., 2000. Remote-sensing science and technology for studying glacier processes in high Asia.
Annals of Glaciology, Vol 31, pp. 164– 170.
Bolch, T., Buchroithner, M. F., Kunert, A. and Kamp, U., 2007. Automated delineation of debris-covered glaciers based on ASTER data. 27th EARSel Symposium, "Geoinformation in Europe", Bozen, Italy .
Burrough, P. A. and McDonell, R.A., 1998. Principles of Geographical Information Systems, Oxford University Press, New York, pp. 190.
Knap, W. H., Brock, B. W., Oerlemans, J., & Willis, I. C. 1999. Comparison of Landsat-TM derived and ground-based albedo of
Haut Glacier d’Arolla. International Journal of Remote Sensing, Vol 20(17), pp. 3293– 3310.
Koelemeijer, R., Oerlemans, J., & Tjemkes, S. 1992. The surface reflectance of the Hintereisferner from Landsat 5 TM imagery. Terrain Modelling: A Review of Hydrological,
Geomorphological, and Biological Applications. Hydrological Processes, Vol 5, pp. 3–30.
Negi, H. S.; Thakur, N. K.; Gangu, A. and Snehmani, 2012. Monitoring of Gangotri glacier using remote sensing and ground observation. Journal of Earth System Science, Vol 121(4), pp. 855-866.
Paul, F., Huggel, C and Kaab, A., 2004. Combining satellite multispectral image data and a digital elevation model for mapping debris-covered glaciers. Remote Sensing of Environment, Vol 89(4), pp. 510-518.
Racoviteanu, A. and Williams, M. W., 2012. Decision Tree and Texture analysis for Mapping Debris-Covered Glacier in the Kangchenjunga Area, Eastern Himalaya. RemoteSensing , Vol 4, pp. 3078-3109.
Sharma, M. C. & Owen, I. A., 1996. Quarternary glacial history of NW Garhwal, Central Himalaya. Quarternary Science Review, Vol. 5, 335-365.
Singh, S., 2002. Geomorphology. Prayag Pustak Bhawan, Allahabad, India. pp. 479-480.


