ESTIMATING MIXED BROADLEAVES FOREST STAND VOLUME USING DSM
EXTRACTED FROM DIGITAL AERIAL IMAGES
H. Sohrabi a, *
a
Dept. of Forestry, Natural resources and Marine Science Faculty, Tarbiat Modares University, Iran
[email protected]
Commission VIII, WG VIII/7
KEY WORDS: Forest Volume, Digital Surface Model, Aerial Image, Regression Method, Hyrcanian Forests
ABSTRACT:
In mixed old growth broadleaves of Hyrcanian forests, it is difficult to estimate stand volume at plot level by remotely sensed data while LiDar data is absent. In this paper, a new approach has been proposed and tested for estimating stand forest volume. The approach is based on this idea that forest volume can be estimated by variation of trees height at plots. In the other word, the more the height variation in plot, the more the stand volume would be expected. For testing this idea, 120 circular 0.1 ha sample plots with systematic random design has been collected in Tonekaon forest located in Hyrcanian zone.
Digital surface model (DSM) measure the height values of the first surface on the ground including terrain features, trees, building etc, which provides a topographic model of the earth's surface. The DSMs have been extracted automatically from aerial UltraCamD images so that ground pixel size for extracted DSM varied from 1 to 10 m size by 1m span. DSMs were checked manually for probable errors. Corresponded to ground samples, standard deviation and range of DSM pixels have been calculated. For modeling, non-linear regression method was used.
The results showed that standard deviation of plot pixels with 5 m resolution was the most appropriate data for modeling. Relative bias and RMSE of estimation was 5.8 and 49.8 percent, respectively.
Comparing to other approaches for estimating stand volume based on passive remote sensing data in mixed broadleaves forests, these results are more encouraging. One big problem in this method occurs when trees canopy cover is totally closed. In this situation, the standard deviation of height is low while stand volume is high. In future studies, applying forest stratification could be studied.
* Corresponding author
1. INTRODUCTION
Generally, forest stand volume is estimated using ground based measurements, but, many studies showed that remotely sensed data have large capacity for such purposes. Several studies (e.g. St-Onge and Achaichia, 2001; Watt and Donoghue, 2005) revealed that using traditional methods of field survey or aerial photograph interpretation to gain information on exact forest area and stand volume is not feasible for large programs because of costs and time constraints.
Based on previous studies, accuracy of volume estimations using only spectral information from 2D imagery obtained with optical sensors is limited, especially for high volume (Patenaude et al, 2005; Sohrabi, 2008). Because, these data are relatively insensitive to canopy height and additional data about canopy height such as digital surface model is crucial.
Digital surface models (DSMs) are an important basis for many tasks of environmental analysis and environmental science, such as analysis of erosion and runoff dynamics or vegetation and infrastructure changes (Altmaier and Kany, 2002). Waser et. al. (2008) used logistic regression models and CIR aerial images, DSM derived from them to assess increase and decrease (2002– 1997) of forest area and other wooded areas in a mire biotope. DSMs can be achieved from various sources like radar (Kellndorfer et al., 2003), laser scanning (Maltamo, et al., 2005), aerial images (Gruber and Schneider, 2007) and stereo satellite images (Altmaier and Kany, 2002). DSMs can be generated automatically by image matching methods, whereby
most commercial packages use cross-correlation or matching of interest points (Waser et. al. 2008).
In Iran, Airborne Laser Scanning (ALS) as the most precise source of canopy height data is not available and in the case of availability, it is too expensive. Instead, DSMs which derived from aerial imagery could be used as a source of DSM. But in mountainous forests, with the lack of precise digital terrain model for deriving canopy height (by subtracting DSM and DTM) they have limited uses.
Here I presented a method based on statistical parameters (range and standard deviation) of DSM derived from aerial images at plot level for estimating standing volume of old growth Hyrcanian forests.
2. MATERIAL AND METHODS
2.1 Study area, aerial images and DSM extraction
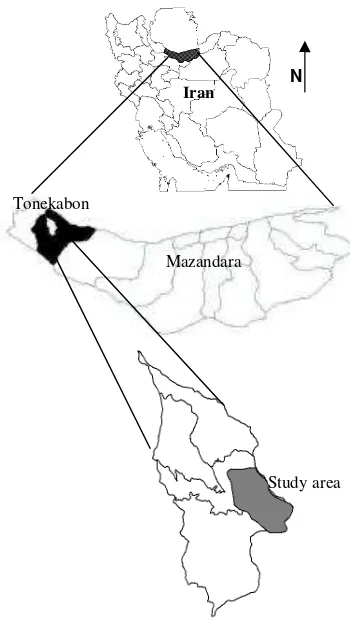
The test site was placed in a forest area of approximately 2240 ha in Lirehsar forest, north of Tonekabon city, Mazandaran Province, Iran. The terrain elevation in the study area ranges from 600 to 1360 m above sea level.
The test sites were selected to provide variability of standing volume range and stand conditions that are typical of north Iranian forests. Forest stands in the test sites were largely composed of beech (Fagus orientalis), hornbeam (Carpinus betulus) trees with the presence of other species such as Oak (Quercus castaneifolia), Alder (Alnus subcordata), velvet International Archives of the Photogrammetry, Remote Sensing and Spatial Information Sciences, Volume XXXIX-B8, 2012
XXII ISPRS Congress, 25 August – 01 September 2012, Melbourne, Australia
maples (Acer velutinum), Persian Ironwood Tree (Parrotia persica) and few other species, which is typical for the region. Data set consist of 76 ortho-rectified CIR images of UltraCamD which has been in 19.8.2006. Focal length, mapping scale, ground pixel size and radiometric resolution were 101.4 mm, 1:15000, 14 cm and 8 bit, respectively.
Digital surface models (DSMs) were generated automatically using an image matching approach from CIR aerial images with a spatial resolution of 1 to 10 m size by 1m span. All DSMs were checked manually for probable errors.
Figure 1. The location of study area
2.2 Ground data and statistical methods
120 ground circular sample plot were located at study area and diameter, species and height of three random trees were recorded and standing volume in each plot were calculated. Also, corresponding to each ground sample plot, standard deviation of DSM pixels was calculated. 80 percent of samples were used for constructing regression equations and 20 percent for validating the equations. Non-linear regression analysis was used for modelling. Bias, relative bias, RMSE and relative RMSE of estimating standing volume were calculated using following equations: : mean of true observations
i i
y y
y
3. RESULTS
Results showed that at 5 to 7 m pixel size, the correlation coefficient of standard deviation of pixels and standing volume of sample plots are higher than other pixel sizes (figure 2). So, 5 m resolution DSM (which was the most correlated pixel size) was used for further analysis.
0.00
Figure 2. Correlation of standard deviation of different pixel size of DSM and forest standing volume at sample plots
Table 1. Results of regression analysis, y: stand volume in sample plot and x: standard deviation of DSM pixels of sample
plot
Model Equation r Sig.
Power Model y=17.334x1.529 0.58 ***
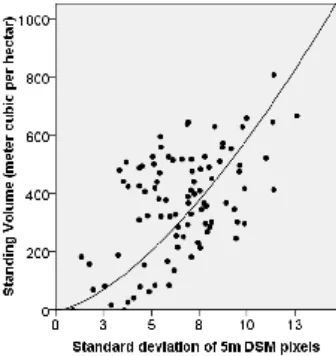
Different regression models were fitted and the most suitable one based on correlation coefficient and standard error of model was power regression model (table 1 and figure 3).
Iran
Mazandara
Studyarea Tonekabon
N
International Archives of the Photogrammetry, Remote Sensing and Spatial Information Sciences, Volume XXXIX-B8, 2012 XXII ISPRS Congress, 25 August – 01 September 2012, Melbourne, Australia
Figure 3. Scatter plot and fitted curve
After constructing the equation, those samples which have been holding out (20 percent) were used for calculating bias and root mean square error. Relative bias and RMSE were -5.8 and 49.8 percent, respectively (table 2).
Table 2. Bias, relative bias, RMSE and relative RMSE of stand volume estimation stand volume at plot level were presented and examined. It has been found that the most proper pixel size for modelling stand volume was 5 to 7 meter. Maybe, this is a consequence of this fact that the average size of tree crowns at study area was approximately 7 m. The smaller sizes contain some variation of crown surface and larger sizes cause a smoothing in height variation.
Many researches have been conducted for estimating stand volume by remotely sensed data. When looking at accuracy expressed as a relative RMSE of stand volume estimation, using sattelite images, 45% (Mäkelä and Pekkarinen, 2004), 48% and 79% (Mäkelä and Pekkarinen, 2001), 51% (Labrecque et al., 2006), 64% to 295% (Katila and Tomppo, 2001), 56% (Hyyppä et al., 2000), 36% (Holmgren et al., 2000), 83% (Franco-Lopez et al., 2001), 41% (Wallerman et al., 2002), 36% (Hall et al., 2006) and using aerial photographs, 57.8% (Tuominen and Pekkarinen, 2005), the present result is satisfactory.
Tuominen and Pekkarinen (2004) achieved 66.1% RMSE, using modified colour-infrared aerial photographs and Sohrabi (2008) using colour infrared aerial images of UltraCamD reported 66.1 – 76.9 % RMSE at plot level. Here, we achieved 49.8% RMSE which is a good improvement in precision of volume estimation of forest stands.
One big problem in this method occurs when trees canopy cover is totally closed. In this situation, the standard deviation of height is low while stand volume is high. In future studies, applying forest stratification could be studied.
5. REFERENCES
Altmaier, A., Kany, Ch. 2002. Digital surface model generation from CORONA satellite images. ISPRS Journal of Photogrammetry & Remote Sensing, 56: pp.221– 235.
Franco-Lopez, H., Ek, A.R., Bauer, M.E., 2001. Estimation and mapping of forest stand density, volume, and cover type using the k-nearest neighbors method, Remote Sensing of Environment, 77: pp.251–274.
Gruber, M., Schneider, S., 2007. Digital surface models from UltraCam-X images, Photogrammetric Image Analysis, Munich, Germany, 36 (3/W49B), pp.47-52.
Hall, R.J., Skakun, R.S., Arsenault, E.J., Case, B.S., 2006. Modeling forest stand structure attributes using Landsat ETM+ data: application to mapping of aboveground biomass and stand volume, Forest Ecology and Management, 225: pp.378–390 Holmgren, J., Joyce, S., Nilsson, M., Olsson, H., 2000. Estimating stem volume and basal area in forest compartments by combining satellite image data with field data, Scandinavian Journal of Forest Research, 15 (1): pp.103–111.
Hyyppä, J., Hyyppä, H., Inkinen, M., Engdahl, M., Linko, S., Zhy, Y.H., 2000. Accuracy comparison of various remote sensing data sources in the retrieval of forest stand attributes, Forest Ecology and Management, 128: PP.109–120.
Katila, M., Tomppo, E., 2001. Selecting estimation parameters for the Finnish multisource National Forest Inventory, Remote Sensing of Environment, 76: PP.16–32.
Kellndorfer, J.M., Dobson, M.C., Vona, J.D., Clutter, M., 2003. Toward precision forestry: plot-level parameter retrieval for slash pine plantations with AIRSAR, IEEE Transactions on Geoscience and Remote Sensing, 41(7): pp.1571-1582. Labrecque, S., Fournier, R.A., Luther, J.E., Piercey, D., 2006. A comparison of four methods to map biomass from Landsat-TM and inventory data in western Newfoundland, Forest Ecology and Management, 226: PP.129–144.
Mäkelä, H., Pekkarinen, A., 2001. Estimation of timber volume at the sample plot level by means of image segmentation and Landsat TM imagery, Remote Sensing of Environment, 77: pp.66–75
.
Mäkelä, H., Pekkarinen, A., 2004. Estimation of forest stand volumes by Landsat TM imagery and stand-level field-inventory data, Forest Ecology and Management, 196: pp.245– 255
.
Maltamo, M., Packalen, P., Yu, X., Eerikainen, K., Hyyppa, J., Pitkanen, J., 2005. Identifying and quantifying structural characteristics of heterogeneous boreal forests using laser scanner data, Forest Ecology and Management, 216: pp. 41–50. Patenaude. G., Milne, R., Dawson, T.P., 2005. Synthesis of remote sensing approaches for forest carbon estimation; reporting to the Kyoto Protocol. Environmental Science and Policy, 8, pp.161-178.
Sohrabi, H., 2009. Application of Visual and Numerical Interpretation of Aerial Images in Forest Inventory, PhD thesis in Tarbiat Modares University, 114 pp.
Tuominen, S., Pekkarinen, A., 2004. Local radiometric correction of digital aerial photographs for multi source forest inventory, Remote Sensing of Environment, 89: 72–82. Tuominen, S., Pekkarinen, A., 2005. Performance of different spectral and textural aerial photograph features in multi-source forest inventory, Remote Sensing of Environment, 94: pp.256– 268.
Wallerman, J., Joyce, S., Vencatasawmy, C.P., Olsson, H., 2002. Prediction of forest stem volume using kriging adapted to detected edges, Canadian Journal of Forest Research, 32: pp.509–518.
International Archives of the Photogrammetry, Remote Sensing and Spatial Information Sciences, Volume XXXIX-B8, 2012 XXII ISPRS Congress, 25 August – 01 September 2012, Melbourne, Australia
Waser, L.T., Baltsavias, E., Ecker, K., Eisenbeiss, H., Feldmeyer-Christe E., Ginzler, C., Küchler, M. Zhang, L., 2008. Assessing changes of forest area and shrub encroachment in a mire ecosystem using digital surface models and CIR aerial images, Remote Sensing of Environment, 112: pp.1956–1968.
International Archives of the Photogrammetry, Remote Sensing and Spatial Information Sciences, Volume XXXIX-B8, 2012 XXII ISPRS Congress, 25 August – 01 September 2012, Melbourne, Australia