FOREST RESOURCE MANAGEMENT SYSTEM
BY STANDING TREE VOLUME ESTIMATION USING AERIAL STEREO PHOTOS
T. Kamiya a, H. Koizumi a, J. Wang a, A. Itaya b
a
System Technologies Laboratories, NEC System Technologies, Ltd., 8916-47, Takayama, Ikoma, Nara 630-0101,
Japan - (kamiya-hxa, koizumi-hxa, wang-jxb)@necst.nec.co.jp
b
Faculty of Bioresources, Mie University, 1577, Kurimamachiya, Tsu, Mie 514-8507, Japan - [email protected]
Commission VIII, WG VIII/7
KEY WORDS: Forestry, GIS, DSM/DTM, Aerial Photo, Stereo
ABSTRACT:
Forest resource management usually requires much human labour for the field survey to keep the data up-to-date especially for the mountainous area. Furthermore, forest resources start to draw more and more attention not only as lumber resources but also as bio-mass resources in terms of alternative energy. This paper describes a novel system for forest resource management based on three-dimensional data acquired from stereo matching of aerial photographs. The proposed system consists of image analysis of aerial photograph for forest resource estimation, and a GIS system aiming at better management of the forest resources. We have built a prototype GIS system and applied it to the experiment forest in Mie prefecture, Japan.
1. INTRODUCTION
Forest resource management usually requires much human labour. In Japan, local governments maintain the forest base map based on the reports of private sectors or their own field survey. It costs much to keep the data up-to-date especially for mountainous area. Furthermore, forest resources start to draw more and more attention not only as lumber resources but also as bio-mass resources in terms of alternative energy.
Remote sensing technologies, such as aerial and satellite photographs, are effective for forest resource management because photographs can grasp the current status of forest in a wide area immediately, especially meaningful for the places where it is difficult to step in. But photographs can only show two-dimensional information such as tree position. In consideration of bio-mass resources, information related to forest volume such as tree height is also necessary.
This paper describes a novel system for forest resource management based on three-dimensional data acquired from stereo matching of aerial photographs. The system aims to reduce human labour for the field survey by resource estimation from aerial photographs.
2. BACKGROUND
Up to now, there have been many researches related to forest information estimation by image analysis in forestry field, such as satellite image analysis for land cover classification (Colstoun, 2003), or analysis of thinning effect on a forest based on forest canopy density information (Itaya, 2007). But most of the researches only implement 2D image analysis, so it is hard to widely estimate the tree volume by them. Some other researches estimate the tree volume from the crown area estimated by 2D image analysis (Hirata, 2008). But these researches use relational expression between the crown area and the tree height obtained from the field survey to estimate the
tree volume. In the practical case, only one relational expression can hardly reflect the condition of the whole vast forest. Thus, utilization of 3D data is essential to estimate the tree volume.
There are also some researchers using LIDAR to acquire tree height for estimating forest information. The research of Means et al. shows the possibility of estimating the tree volume from the tree height and the tree crown by LIDAR (Means, 2000). Though LIDAR can acquire the tree height in high accuracy, it is hard to estimate the tree species and tree density in LIDAR data. In this sense, it is hard to expect accurate estimation of forest resource by LIDAR. Furthermore, LIDAR has a problem of high cost.
3. FOREST RESOURCE MANAGEMENT SYSTEM
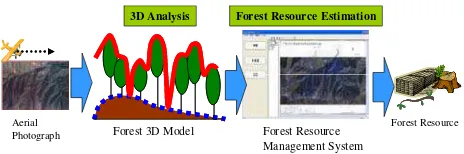
This paper proposes the forest resource management system using 3D data. Figure 1 shows the conceptual diagram of the system.
Forest 3D Model Forest Resource
Management System
Forest Resource Estimation
Forest Resource
3D Analysis
Aerial Photograph
Figure 1. Conceptual Diagram of Forest Resource Management System
The proposed system consists of two stages. The first stage is image analysis of aerial photograph for forest resource estimation and the second stage is a GIS system aiming at better management of the forest resources including the function of road planning.
In the first stage, with the aerial photographs covering the surveyed area as the input data, our stereo processing system produces a dense digital surface model (DSM) of the area. Based on this, the digital terrain model (DTM) or bare-earth is estimated based on the DSM, ortho-rectified colour image, and ortho-rectified infra-red image through our novel DEM estimation algorithm. Then we obtain the average tree height of the area by comparing the DSM and DEM, thus acquire the tree height map for the forest management GIS system.
Then the proposed GIS system takes the tree height map as its basic input data. It is possible to display the following data in the proposed GIS system, such as DSM, orthophoto and forest base map that includes the area boundary data, tree species, land owner and etc. The proposed GIS system also provides interactive interface to estimate the stand density of tree and then further to get forest resource based on the stand density and the tree height map. Users of the system can easily estimate the forest resources such as the volume of lumbers or that of lumber remnants along newly built road. The estimation of the forest resources helps to assure the stable supply of lumbers and the effective utilization of forest resources without wastes.
3.1 Image Analysis of Aerial Photograph for Forest
Resource Estimation
The information of tree species, height and density is necessary for forest resource estimation.
3.1.1 Tree Height Estimation using Aerial Stereo Photos
It is possible to estimate tree height using aerial photo by subtracting the height of the ground (DTM) from the height of the top of the tree (DSM) in the forest.
We have developed a stereo processing system (Koizumi, 2009). The system, mainly applied to urban area, can generate DSM including building height pixel by pixel using stereo matching from plural aerial photographs. That is, in the case of 20cm ground resolution of aerial photograph, DSM is generated on every pixel in the same resolution of 20cm. But in forest area, DSM doesn’t necessarily have comparable accuracy to in urban area for the following special factors in the forest images, for example, existence of texture, complex shape shadow, different contrast caused by various direction of slopes, steep height change similar to buildings.
Then, we analyze the reason of the deterioration of the matching accuracy and further improve the stereo processing system to deal with geographical steep undulations in forest and also reduce the error of relative orientation on stereo images due to the error of aerial triangulation. As a result, compared with conventional system, for the input forest area data having y-parallax, the matching noise in DSM caused by geographical steep undulations and y-parallax is reduced in the improved system (figure 2).
(a) 3D model by conventional system (b) 3D model by improved system Figure 2. Concept Image of DTM Estimation
Next, we estimate the tree height in forest based on the DSM, ortho-rectified colour image and ortho-rectified infra-red image generated from aerial stereo photographs (Wang, 2011). At first, bare-earth regions such as road and vacant land in the surroundings or inside of the forest are automatically extracted from images by judging vegetation using Normalized Difference Vegetation Index (NDVI, Equation(1)) from ortho-rectified colour and infra-red images. Then, tree height is estimated from the difference between the heights of extracted bare-earth region and the surrounding tree regions. At last, height of trees inside the forest is estimated from the formerly obtained tree height of the trees near bare-earth region as a clue (Figure 3).
RED NIR
RED NIR NDVI
+ −
= (1)
where NIR = the spectral reflectance measurements acquired in the near-infrared channel
RED = the spectral reflectance measurements acquired in the red channel
known
unknown
known
Height of ground (known)
Height of ground in forest (unknown)
Estimation
Figure 3. Concept Diagram of DTM Estimation
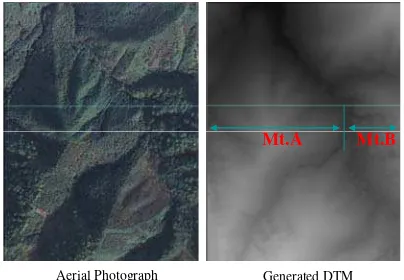
For the accuracy evaluation of DSM and DTM obtained from aerial images, we compare them with DSM and DTM generated from LIDAR, and also with DSM and DTM generated by stereoscopic vision in the Mie University experiment forest (Figure 4, Figure 5). The result of evaluation shows that the average difference of DSM with that from LIDAR is almost zero and the root mean square error is 4.8 meter. And the average difference of DTM with that from LIDAR is less than one meter and that accuracy is almost same as stereoscopic vision. Considering the cost, our system provides a much cheaper way than LIDAR to acquire the same ground resolution level of data. And the aerial photographs can also provide information of tree species and information necessary for density estimation. We conclude that DSM and DTM generated from aerial photograph provide enough accuracy for practical purposes of forest resource management.
Aerial Photograph Generated DTM
Mt.A Mt.B
Figure 4. Result of DTM Estimation
Mt.A
Mt.B
Figure 5. Comparison of DSM and DTM
3.1.2 Tree Species and Density Estimation using Image
It is important to estimate tree species and density for forest resource estimation. For example, in the beginning of tree planting in the artificial forest, single species such as Japanese cedar or Japanese cypress is planted. But after a long time, surrounding broad-leaved forest intrudes into the sub-compartment. In this case, the single species described in the forest registration is not correct any more. Similar problem exists for the tree density. For some sub-compartments under frequent investigation, the forest density information is kept updated. But due to the increase of tree un-thinning area in these days, tree density is not accurate at all and also becomes not uniform inside the sub-compartments.
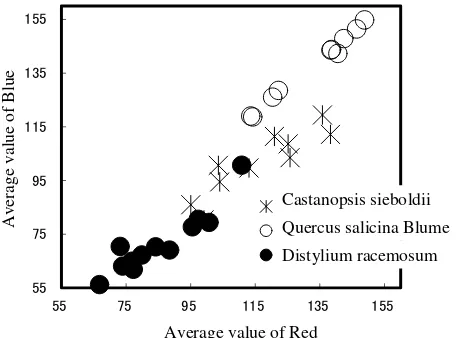
Therefore, we make experiments to examine the possibility of estimating tree species and density from images. At first, we conduct a field survey in the natural forest in Tatera Mountain in Tsushima, and then we investigate the possibility of tree species classification based on 3D shape and colour distribution of tree crown using aerial photograph in this area. Figure 6 shows that tree species is able to be classified based on R and B value of the images.
Next, we compare the number of trees acquired by photographic interpretation with that from object-based image analysis. The result shows that there is strong correlation between these two numbers obtained from different methods.
平均R値
Figure 6. Result of Species Classification by Colour
3.2 GIS system
As described in chapter 3.1, it is proved that estimation of tree height, density and species has reached certain accuracy level for practical use. But next problem is what kind of system
should be provided for the practical work like the work in the tree farm. In many cases, the GIS systems owned by forest owner’s cooperative and so on are equipped with various general functions but users usually only use the simple function like map viewing.
Then, we divide the whole system into two stages, firstly to generate basic data, and then to estimate resources by using the basic data. In the first stage, that is, the stage to generate DSM and DTM from aerial photograph, it is better to conduct aerial photography and data processing in a large scale considering the cost. So, not individual forest owner’s cooperative, but prefecture or federation of forest owner’s cooperative association or service vender should carry out this stage for all the concerned forest area. On the other hand, resource management including the lumber volume estimation in certain sub-compartment is useful for various planning trials of tree thinning in helping the individual forest owner’s cooperative to carry out a massive work plan.
Therefore, in the proposed forest management GIS, we provide a simple interface targeting estimation of forest resource harvested from a sub-compartment for the end users (Figure 7).
The input of the system is the compartment data (shape format), that include tree species, forest age, site class, area, and so on, forest base map as a background image, ortho-photo generated from aerial photographs, DSM and DTM generated by stereo processing. These input data is managed in layer level and also displayed as layers on the display similar to common GIS system.
Tree Density Estimation Database
・Compartment data ・Forest road, Loading area ・Forest base map ・volume of timber remnants ・cost
Figure 7. Forest Resource Management GIS
With the proposed forest resource management GIS system, it is possible to carry out estimation of tree density and then forest resource in each sub-compartment. Operation procedures are described as follows.
3.2.1 Tree Density Estimation
The processing unit of this system is sub-compartment. At first, user selects the target sub-compartment and click “density” button. Then, the window of tree density estimation appears, shown as the left figure of Figure 8. In this window, the selected sub-compartment is wholly displayed. Then user sets the plot region inside the sub-compartment. The area of plot region can be selected from 5 candidates, 0.04ha, 0.05ha, 0.1ha, 0.2ha and 0.25ha, similar to the conventional method of tree density estimation on photographic surveying. For example, when 0.1ha is selected, rectangle that corresponds to 0.1ha is automatically displayed on the screen, obtained on the basis of ground resolution of orthophoto. User sets the location of the plot region in the target sub-compartment by dragging the rectangle by mouse on the screen. Then magnified view is
displayed, shown as the right figure in Figure 8. In this view, the image is magnified to better visibility for the user to decide the trees one by one in the selected plot rectangle region. User clicks the mouse in the range of individual tree crown and counts the number of trees in the selected plot region. In this way, the number of trees per unit area in the sub-compartment, that is, tree density can be estimated. At this time, the system estimates tree height at each selected point in the tree crown region based on the height of DSM and DTM. The average value of tree height on these selected points is used as average tree height in the sub-compartment.
Tree Density Estimation UI Number : 73
Area : 0.10ha
Click Tree Position by Human
Figure 8. Estimation UI of Tree Density
3.2.2 Forest Resource Estimation
The proposed system estimates resource volume automatically using estimated tree density and average tree height of the target sub-compartment. The estimation is carried out under the existing “system yield table”, based on the forest age and site class acquired from forest registration, average tree height, tree density and the area of the sub-compartment. When user clicks the “harvest” button, the window to set the thinning rate appears. After user sets the thinning rate (0 – 100%), the estimation results such as the number of timber and tree volume in every diameter class, income expected from unit price set in advance and volume of lumber remnants are output in excel format, shown in Figure 9.
In this way, by using the proposed forest management GIS system, user can obtain the volume of lumber acquired from thinning in certain sub-compartment very easily by himself.
林班番号 木材量 本 材積 ㎥ 収入 円 端材量 ㎥
径級 ㎝ 木材量 本 材積 ㎥ 収入 円
に 本 ㎥ 円 ㎥
㎝ 本 ㎥ 円
㎝ 本 ㎥ 円
㎝ 本 ㎥ 円
㎝ 本 ㎥ 円
㎝ 本 ㎥ 円
㎝ 本 ㎥ 円
㎝ 本 ㎥ 円
㎝ 本 ㎥ 円
㎝ 本 ㎥ 円
㎝ 本 ㎥ 円
㎝ 本 ㎥ 円
㎝ 本 ㎥ 円
㎝ 本 ㎥ 円
㎝ 本 ㎥ 円
㎝ 本 ㎥ 円
㎝ 本 ㎥ 円
㎝ 本 ㎥ 円
Number of Timber
Tree
Volume (m3)
Income (yen)
Lumber
Remnants (m3)
Diameter Class (cm) Compartment Number
Figure 9. Result of Forest Resource Estimation
4. EXPERIMENT
We build the proposed GIS system and apply it to the experiment forest of Mie University (East to West : 4km, North to South : 1.5km, Area : 460ha ). We select 82 sub-compartments as experimental area where Japanese cedar and Japanese cypress grow. We experiment to estimate volume of lumber and lumber remnants after acquiring tree density and height of each sub-compartment.
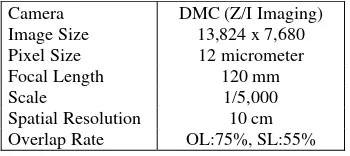
DSM is generated from digital aerial photograph (3 courses, 72 photographs) by stereo processing. As DTM, ground height data generated from LIDAR is used. The information of tree species, forest age, site class and area of sub-compartment is obtained from the forest registration. Table 10 shows the specification of aerial photograph and Figure 11 shows the image overlaying orthophoto and sub-compartment map used in this experiment.
Camera DMC (Z/I Imaging)
Image Size 13,824 x 7,680 Pixel Size 12 micrometer
Focal Length 120 mm
Scale 1/5,000 Spatial Resolution 10 cm
Overlap Rate OL:75%, SL:55%
Table 10. Specification of Aerial Photograph
Figure 11. Aerial Photograph used for Experiments
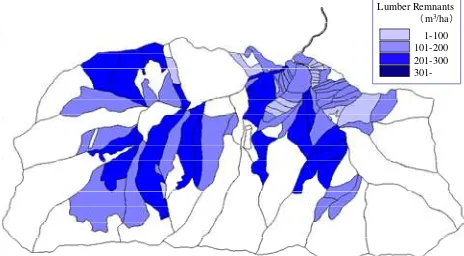
In this experiment, volume of lumber and that of lumber remnants are estimated. The result is shown in Figure 12 and Figure 13. The result indicates that the forest resource management system can estimate the forest resource volume. Furthermore, because it takes only almost 2 hours for estimating resource volume of target sub-compartments on the second stage, the result indicates that the system succeeds in cost reduction.
1-200 201-400 401-600 601-800 801-Lumber Volume
m3/ha
Figure 12. Result Map of Lumber Volume
1-100 101-200 201-300 301-Lumber Remnants
m3/ha
Figure 13. Result Map of Lumber Remnants Volume
5. USER EVALUATION
Currently, we have introduced the developed prototype of the forest resource management GIS to the person in charge of forest management of local autonomy and forestry company, and got high evaluation about the basic concept of the system. On the other hand, some practical problems are revealed. For example, in tree density interface, user counts the number of trees by visual interpretation. But density is not uniform even in the same sub-compartment. So, it is necessary to count the number of trees in separated regions on the basis of density or to estimate density automatically by image analysis for better accuracy. Furthermore, the information of tree species and sub-compartment shape information recorded in the forest registration sometimes is not accurate. Due to the change of the forest in each sub-compartment as time goes by, for example the intrusion by the broad-leaved tree, there are possible problem to the estimated resource volume and income may be larger than the real case. To solve this problem, we want to introduce the function of tree species estimation to the system in the future.
Moreover, though we have already carried out resource estimation in the experiment forest of Mie University, it is still necessary for us to examine the estimation accuracy in some practical cases related to forest production industry.
6. CONCLUSION
In this paper, we proposed the forest resource management system that estimates forest resources using aerial stereo photographs. In this system, by using 3D data generated from aerial photograph by image analysis and by providing interactive interface, it is possible to easily estimate forest resources such as the volume of lumber and lumber remnants. The system shows the possibility of forest resource management with low cost and high accuracy. The estimation of forest resources in this system is effective to assure stable timber supply and efficient forest resource utilization without waste.
In the future, we aim to build a system that automatically estimates tree species and density to reflect the current status of forest more accurately. Further, we aim to develop a more practical system for the tree farm with the consideration of cost during the practical work like road planning and construction related to the tree thinning.
References:
Colstoun, E.C.B., Michael H. Story, M.H., Thompson, C., Commisso, K., Smith, T.G., Irons, J.R., 2003. National Park vegetation mapping using multitemporal Landsat 7 data and a decision tree classifier. Remote Sensing of Environment, pp. 316–327.
Itaya, A., Shiba, M., 2007. Object-based image analysis applied for detection of forest canopy density. Journal of the Japan Forest Engineering Society, pp.315-318.
Hirata, Y., 2008. Estimation of stand attributes in Cryptomeria japonica and Chamaecyparis obtusa stands using QuickBird panchromatic data. Journal of Forest Research, pp.147-154.
Means, J.E., Acker, S.A., Fitt, B.J., Renslow, M., Emerson, L., Hendrix, C.J., 2000. Predicting Forest Stand Characteristics with Airborne Scanning Lidar. Photogrammetric engineering and remote sensing, pp.1367-1371.
Koizumi, H, Yagyu, H., Hashizume, K., Kamiya, T., Kunieda, K., Shimazu, H., 2009. Metropolitan Fixed Assets Change Judgment using Aerial Photographs. Proceedings of the Twenty-First Innovative Applications of Artificial Intelligence Conference, pp.17-24.
Wang, J., Koizumi, H., Kamiya, T., 2011. Stereo Aerial Images Based DTM Extraction in Forest Region. Proceedings of the Annual Conference of the Japan Society of Photogrammetry and Remote Sensing. pp.51-52.