LARGE AREA LAND COVER CLASSIFICATION WITH LANDSAT
ETM+ IMAGES BASED ON DECISION TREE
Liang ZHAI, Jinping SUN, Huiyong SANG, Gang YANG, Yi JIA
Key Laboratory of Geo-Informatics of NASG, Chinese Academy of Surveying and Mapping, Beijing, China [email protected]
Commission VII, WG VII/6: Remote Sensing Data Fusion KEY WORDS: land cover classification, decision tree, C5.0, MLC
ABSTRACT:
Traditional land classification techniques for large areas that use LANDSAT TM imagery are typically limited to the fixed spatial resolution of the sensors. For modeling habitat characteristics is often difficult when a study area is large and diverse and complete sampling of environmental variables is unrealistic. We also did some researches on this field, in this paper we firstly introduced the decision tree classification based on C5.0, and then introduced the classification workflow. The study results were compared with the Maximum Likelihood Classification result. Victoria of Australia was as the study area, the LANDSAT ETM+ images were used to classify. Experiments show that the decision tree classification method based on C5.0 is better.
1. INTRODUCTION
Detailed and accurate land cover data are widely used by various organizations, such as national, regional, local governments and private industries, as well as educational and research organizations because they are the basis for many environmental and socioeconomic applications (Perera and Tsuchiya, 2009; Heinl et al., 2009). The suitability of remote sensing for acquiring land cover data has long been recognised and land cover mapping with using satellite data has received growing attention in the last 20 years., but the process of generating land cover information from satellite data is still far from being standardised or optimised (Foody, 2002; Lu and Weng, 2007; Heinl et al., 2009).
Currently, particularly in times of global change, global land cover mapping has drawn much attention to many countries or organization. Till now, there are a number of global land cover products exist, such as IGBP DISCover, the MODIS land cover product, UMD land cover product, Global Land Cover 2000 (GLC2000, Bartholomé & Belward, 2005) and GLOBCOVER (Loveland et al., 2000; Friedl et al., 2002; Hansen et al., 2000; Herold et al 2008). These maps have been developed in response to the need for information about land cover and land cover dynamics. They all have been produced from optical, moderate resolution remote sensing and thematically focused on characterizing the different vegetation types worldwide (Herold et al 2008).Large area land cover classification still has many difficulties.
There are three key problems of classification: 1) given a set of example records, 2) build an accurate model for each class based on the set of attributes, 3) use the model to classify future data for which the class labels are unknown. Common classification models are: neural networks, statistical models, Decision tree and genetic models. Decision tree has many great advantages in the remote sensing classification, which has been successfully used in
many situations. Liu Zhongyang adopted the decision tree classification method based on LANDSAT TM image to present coverage situation of Zhengzhou city and proved that the decision tree classification method has obvious advantages, such as exact classification, efficient, definite classification criterion, intuitive classification structure controllable classification precision automated classification, etc (Liu Zhongyang, 2010). There are also many researches on C5.0, for example, this algorithm used in NLCD 2000 to do land cover classification (Homer, Collin, 2000), to estimate tree canopy density (Chengquan Huang, 2000), and so on, these applications all got good results.
This paper introduced the C5.0 algorithm, and provided a C5.0 land cover classification platform, this platform also been used to classify the images of Victoria. Further, the classification result was been compared with MLC classification result, it proved that the C5.0 classification method is excellent. 1.1StudyAreaandData
Figure 1. The location of Victoria in Australia LANDSAT ETM+ images were used in this study, there are 18 scenes image that covered Victoria, the cover information is as shown in figure ii. The classified images are mostly around in 2000, and the months of the classified images are distributed between August and December.
Figure 2. Study images information
1.2Datapreprocessing
1.2.1 Geometric correction
It would be wonderful if every remote sensed image contained data that were already in their proper geometric x,y locations. Unfortunately, this is not the case. Instead, it is usually necessary to preprocess the remotely sensing data and remove the geometric distortion so that individual picture elements are in their proper geometric locations this process is called geometric correction (John R.Jensen, 2007). In this study, the spatial positioning accuracy can meet the requirement of 1:1000000 mapping, and the registration error between two periods’ images was controlled in 2 pixels.
1.2.2 Radiometric correction
Even when the remote sensing system is functioning properly, radiometric error maybe introduced into the remote sensing data (John R.Jensen, 2007). Sometimes it is unnecessary to atmospherically correct the remote sensing data, but in other case, if we are going to extract information from the remote sensing data, it is very necessary to do radiometric correction.
1.2.3 Scene Mosaicing
Land cover classification of an area larger than one scene can benefit from image mosaicing. While scenes of the same date (i.e. the same Landsat path) can be mosaiced, provided they are first radiometrically calibrated, joining scenes of different dates requires additional consideration. We used a linear regression technique for the overlap area between two adjacent Landsat rows, from which clouds and cloud shadows were masked, to adjust the individual band data to a common value among adjacent scenes in the path. In order to normalize imagery for time differences only scene elements representing the same land cover in both dates were sampled.
2. METHODS
2.1DecisionTreeclassification
2.1.1 Decision tree classification
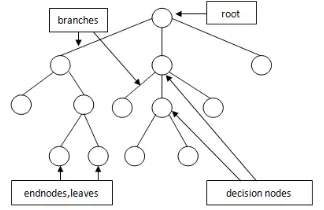
The basic concepts of the decision tree are described by Swain and Hauska(1977), Bauret al. (1981), Kurzynski (1983) and Quing-Yun and Fu(1983). A decision tree structure is made of root, internal and leaf nodes. The tree structure is used in classifying unknown data records. At each internal node of the tree, a decision of best split is made using impurity measures (Quinlan, 1993). The tree leaves is made up of the class labels which the data items have been group. Decision tree classification technique is performed in two phases: tree building and tree pruning. Tree building is done in top-down manner. It is during this phase that the tree is recursively partitioned till all the data items belong to the same class label (Hunts etal, 1966). Figure iii shows the structure of decision tree.
Figure 3. The structure of decision tree
Decision tree classifier has been successfully used in many researchers. It is recognized that decision tree classifier has these following advantages: 1) Relatively fast compared to other classification models; 2) Obtain similar and sometimes better accuracy compared to other models; 3) Simple and easy to understand; 4) Can be converted into simple and easy to understand classification rules.
A decision tree is created in two phases: 1) Tree Building Phase
2) Tree Pruning Phase
This phase should remove dependency on statistical noise or variation that may be particular only to the training set.
Decision tree algorithm is a data mining induction techniques that recursively partitions a data set of records using depth-first greedy approach (Hunts et al, 1966) or breadth-first approach (Shafer et al, 1996) until all the data items belong to a particular class. The decision tree modeling comes in two main branches: Breiman's Classification and Regression Trees (CART) and Quinlan's See5/C5.0 (and its predecessors, C4.5 and ID3). This study we mainly introduce the C5.0 model.
2.1.2 C5.0 algorithm
C5.0 is one of the most classic algorithms in decision tree models, which increased boosting technology on the basis of C4.5. According to C5.0 algorithm, the original training sample set is considered the root node of the decision tree, and then the gainratio of every feature attribute are calculated. Some definitions were put forward:
Information entropy: suppose S is the set of n data samples. The category attribute C has m different values, and it divides the sample set into m different category C i = , , … , m . Suppose n is the amount that the samples belong to C in S. then the information entropy E(s) of S is defined as,
E S = − ∑ p log p (1)
Where p is a proportion, can be calculated by p = , which the samples belongs to C in the total sample. (|s| is the total number of sample set S, here |s| = n).
The conditional entropy of attribute A: suppose A has v different value {a , a , … , a }, the attribute A divides the set S into v subsets {S,S , … S }. n is the sample number of C. so the conditional entropy E S|A of the attribute A is:
The GainRatio of attribute A:
GainRatio A = (4) Where SplitI A = − ∑ p log p .
C5.0 splits the training samples according to the biggest information gain. The first split can define the
sample subset. Then the second split is according to the other field, this procedure will repeat until the sample subset can’t split. At last, check the lowest-level split, these sample subsets that has non-significant will be eliminated or cut. The key to construct decision tree using C5.0 is the training samples, choosing a certain number of sample is very important. While the number of samples is not the more the better, after a lot of experiments we found that it is more important for the samples’ Uniformity and representative. The other important procedure is the feature extraction. The feature mainly include spectral and texture feature. The feature’s selection should according to the classification system and the land cover type. The common feature may contain the value of TC, the NDVI, the texture, and so on. 2.2Landcoverclassificationworkflowbasedon
C5.0
Remote sensing classification depends on the theory called statistical pattern recognition, means to extract one team statistical feature value of patterns to be recognized, and then make the classification decision according to one certain rule. The land cover classification workflow based on C5.0 has the five following procedures:
1) Establish a classification system
A suitable classification system is prerequisites for a successful classification. Cingolani etal. (2004) identified three major problems when medium spatial resolution data are used for vegetation classifications: defining adequate hierarchical levels for mapping, defining discrete land-cover units discernible by selected remote-sensing data, and selecting representative training sites. In this case, a hierarchical classification system is adopted to take different conditions into account mainly based on the users’ needs. This classification system includes ten ‘level 1’, while each ‘level 1’ has some ‘lever 2’. Details could be seen in (Higher resolution Global Land Cover Mapping Project, 2011). The ten ‘level 1’ includes 1.artificial, 2.bareland, 3.cropland, 4.forest, 5.grass, 6.shrub, 7.tundra, 8.water, 9.wetland, 10.Perennial snow or ice.
2) The establish of multiple files
After remote sensing images were preprocessed firstly, and then done the band math, we can get feature images, for example, NDVI image, TC image. These feature images and the preprocessed images were input into the spatial database together, and other spatial data can compose one or more multi-band file. Selecting what features will depend on the precision of result, so the selection of feature images is very important. Normally we features present on the image have three types of features:
a. Spectral feature
b. Spatial feature
Spatial features are the shape, size and the edge of the target.
c. Texture feature
Textures provide important characteristics for the analysis of many types of images including natural sensing data and biomedical modalities.
In this study, we mainly used the NDVI and TC feature images, these feature images and the preprocessed TM image were input into the C5.0 classification platform together.
3) Extract samples and create sample database A sufficient number of training samples and their representativeness are critical for image classifications (Hubert-Moy etal.2001, Chen and Stow 2002, Landgrebe 2003, Mather 2004). Training samples are usually collected from fieldwork, or from fine spatial resolution aerial photographs and satellite images. To grantee the precise of the training samples, we did some fieldwork. The information of the sample area is:
Location: southeast coast of Australia
Latitude and longitude: 33°03'00''~34°47'00''S, 149°23'00''~152°01'00''E
Climate: wet climate
Ecoregions: Southeast Australia temperate forests, and Eastern Australian temperate forests
Some of the training samples were collected from the LANDSAT TM images. This process can implement on remote sensing or GIS softwares. The features displaying on the image are inflected by many factors, such as climate, terrain. According to ecoregions and months, the 18 scenes images were
divided into three teams. We chose three or four scenes images to select samples, and guaranteed every scene’s sample points were no less than 500 points. 4) The creation of the classification rules
When we have sufficient training samples and good feature files, the next procedure is to get classification rules. Here, the C5.0 classification platform can be adopted. According to the grouping of the above procedure this study can get three decision rules.
5) Classification
The last procedure is to use the decision rule to classify. In the study, every scene of the 18 scenes images of Victoria used one of three rules to implement classification. When every scene image was classified, the classification results were mosaiced, and then we got the classification result of Victoria.
3 EXPERIMENTAL RESULTS AND ACCURACY ASSESSMENT
3.1ExperimentalResults
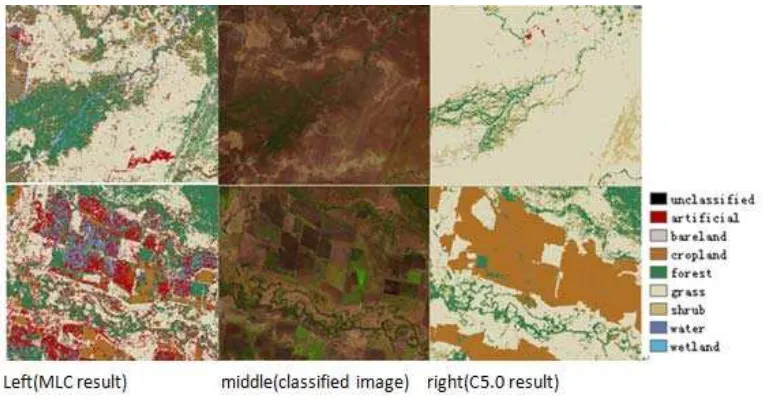
Maximum likelihood classifiers are frequently available and widely used for land cover classification from multispectral imagery. In the study, MLC classification was also used to classify the images of Victoria. Also, the same training data was used to classify one scene by using C5.0 classification method and MLC.
Figure 4. Some comparisons of MLC result and C5.0 result Figure 4 shows some visual comparisons of MLC
result and C5.0 result, we can easily found that the C5.0 result is closer to the actual classified image.
Figure 5. The classification result based on C5.0 3.2Accuracyassessment
One test samples were used to test the C5.0 and the MLC classification results, and got an assessment result: the overall accuracy of C5.0 classification result is 78.8716%, and kappa coefficient is 0.7538. While the overall accuracy of MLC classification result is 74.6884%, Kappa Coefficient is 0.7080. Table I and table II show the confusion matrix for the two classification results separately.
TABLE I. CONFUSION MATRIX FOR C5.0
CLASSIFICATION RESULT
TABLE II. CONFUSION MATRIX MLC
CLASSIFICATION RESULT
To compare the accuracy of the two classification result, we can conclude that the C5.0 method is more excellent than MLC. We can see from table I and II, artificial, cropland, forest and water can get a higher precision, while the precisions of bareland, grass, shrub are much lower. And compared the two tables above, we can see, the misclassification phenomenon in MLC result is very serious. For example, the misclassification between artificial and forest, 7.4% of the pixels of forest were classified to artificial.
4 CONCLUSIONS
Study shows that using C5.0 classification method
can get a higher precision than MLC classification method. At the same time, in the process of classification, it needn’t to select training samples on every image when using C5.0 method, while we should select training samples on every image to be classified, and it will waste too much time. Compared with MLC method, C5.0 classification method increased image features information, which increased discrimination between categories, so we can get better result. Furthermore, in the analysis of data with high dimensionality such as multi temporal LANDSAT data, the computational speed of the maximum likelihood classifier is reduced because the classification time increases as the square of the number of bands.
In all, we can conclude that decision tree based on C5.0 classification method is suitable for large area land cover classification for its automation, high-speed, and high precision.
Acknowledgement
This work was funded by National High Technology Research and Development Program of China (2009AA122003) and the National Key Technology R&D Program (2012BAH28B01). We thank the anonymous reviewers for their helpful comments. We also would like to acknowledge every member of the GLC project team at CASM.
References
Liang ZHAI, Wenhan XIE, Huiyong SANG , Jinping SUN. Land cover mapping with Landsat data: The Tasmania case study. The 2011 International Symposium on Image and Data Fusion, 9-11 August 2011, Tengchong, Yunnan, China.
S. M. JOY, A non-parametric, supervised classification of vegetation types on the Kaibab National Forest using decision trees. International Journal of Remote Sensing, 2003, vol.24, NO.9, 1835-1852.
Perera, K. and Tsuchiya, K., 2009. Experiment for mapping land cover and it’s change in southeastern Sri Lanka utilizing 250m resolution MODIS imageries. Advances in Space Research, 43 (9). pp. 1349-1355. Heinl, M., Walde, J., Tappeiner, G., and Tappeiner U., 2009. Classifiers vs. input variables—The drivers in image classification for land cover mapping. International Journal of Applied Earth Observation and Geoinformation, 11(6). pp. 423-430.
Foody, G. M., 2002. Status of land cover classification accuracy assessment. Remote Sensing of Environment, 80(1). pp. 185-201.
Lu D. and Weng Q., 2007. A survey of image classification methods and techniques for improving classification performance. International Journal of Remote Sensing, 28(5). pp. 823-870.
Herold, M., Mayaux, P., Woodcock, C.E., Baccini, A., and Schmullius, C., 2008. Some challenges in global land cover mapping: An assessment of agreement and accuracy in existing 1 km datasets. Remote Sensing of Environment, 112(5). pp. 2538-2556.
characteristics database and IGBP DISCover from 1 km AVHRR data. International Journal of Remote Sensing, 21 (6-7). pp. 1303−1330.
Friedl, M.A., McIver, D.K., Hodges, J. C. F., Zhang, X. Y., Muchoney, D., Strahler, A. H., et al. (2002).Global land covermapping from MODIS: Algorithms and early results. Remote Sensing of Environment, 83(1-2). pp. 287−302.
Hansen, M.C., DeFries, R.S., Townshend, J.R.G., and Sohlberg, R., 2000. Global land cover classification at 1 km spatial resolution using a classification tree approach. International Journal of Remote Sensing, 21(6-7), 1331−1364.
Liu Zhongyang, Du Zixuan, Chen Huailiang. Study on the Land Use and Cover Classification of Zhengzhou Based on Decision Tree. 2010 International Conference on Remote Sensing(ICRS).
Homer, Collin, Chengquan Huang, and Limin Yang. DEVELOPMENT OF A CIRCA 2000 LANDCOVER DATABASE FOR THE UNITED STATES. Science for a changing world.
Chengquan Huang, Limin Yang, and Bruce Wylie. A STRATEGY FOR ESTIMATI NG TREE CANOPY DENSITY USING LANDSAT 7 ETM+ AND HIGH RESOLUTION IMAGES OVER LARGE AREAS. Science for a changing world.
John R.Jensen. IntroductoryDigital image processing. Science Press. 2007: 467-491.
PANG Su-lin,GONG Ji-zhang. C5.0 classification algorithm and its application on individual credit score for banks, Systems Engineering—Theory& Practice. Dec.2009: 94-104.
Higher resolution Global Land Cover Mapping Project. http://www.globallandcover.com/, July, 1, 2011.
Changqing Zhu, Xiaomei Yang. Study of remote sensing image texture analysis and classification using wavelet. International Journal of Remote Sensing, 1998, VOL .19, n o .16, 319 7-3203.
TOM, C. H., and MILLER, L. D.An automated land use mapping comparison of the bayesian maximum likelihood and linear discriminant analysis algorithms. Photogram. Engng remote Sensing, 50, 193.