Michio Hada, Bernice Porjesz, Henri Begleiter, and John Polich
Background: P3a amplitude differences between
alco-holic and control groups have not been well defined.
Because event-related potential (ERP) differences
be-tween these groups appear to be influenced by task
difficulty, the present study employed a new auditory ERP
paradigm, in which target/standard tone discriminability
was difficult, with infrequent nontarget stimuli used to
elicit the P3a.
Methods: A total of n
5
27 male alcoholics and n
5
25
male controls were assessed using a three-tone
discrimi-nation paradigm, in which the discriminability between
the target and standard was difficult, with easily
discrim-inable infrequent nontarget tones also presented. A P3a
component with a centro-frontal maximum to the rare
nontargets and a P3b with a parietal maximum amplitude
to the target stimulus were obtained. Current Source
Density (CSD) maps were derived from the potential data
and employed to assay topographical differences between
subject groups.
Results: Alcoholics produced smaller P3a amplitudes
than control subjects to the rare nontargets with no peak
latency differences observed. The most prominent current
sources are apparent more anteriorly for the nontarget
compared to the target stimulus in both groups. There
were more sources and sinks in the alcoholics than in the
control subjects for P3a. A bootstrap analysis method
showed that P3a CSD maps evinced distinct topographic
distributions between alcoholics and control subjects in
all brain regions.
Conclusions: The lower P3a amplitude and weaker
sources in alcoholics coupled with less topographic
spec-ificity in their CSD maps, suggests disorganized inefficient
brain functioning. This global electrophysiological
pat-tern suggests cortical disinhibition perhaps reflecting
underlying CNS hyperexcitability in alcoholics. Biol
Psychiatry 2000;48:276 –286 © 2000 Society of
Biologi-cal Psychiatry
Key Words: P300, P3a, P3b, alcoholics, auditory
event-related potential, Current Source Density, frontal cortex,
cortical disinhibition
Introduction
E
vent-related brain potentials (ERPs) can be used to
assess the cognitive deficits in alcoholism by
provid-ing spatial and temporal assays of neural function from
scalp recordings. In particular, the P300 ERP component
is often employed, because it is a sensitive index of
stimulus evaluation and attentional allocation processes
(Donchin et al 1986; Polich 1986). The P300 is often
elicited using a simple discrimination task, the so-called
“oddball” paradigm, in which two stimuli are presented in
a random series with one of the two occurring relatively
infrequently (i.e., the oddball). The subject is required to
distinguish between the two tones by responding to the
target (e.g., mentally counting, pressing a button, etc.) and
not responding to the standard (Duncan-Johnson and
Donchin 1977; Polich 1986, 1987); a variety of
psycho-logical factors affect P300 amplitude and latency, such as
target probability, stimulus size/intensity, and ease of
standard/target discriminability (Johnson 1988; Polich
1998).
An important aspect of P300 is that intrusive or “novel”
stimuli (e.g., dog barks, abstract color forms, etc.) can
produce an earlier, positive potential called “P3a” that
appears to be distinct from the later P300 or “P3b” peak
(Squires et al 1975). P3a is typically larger in amplitude
than the P3b over the frontal and central electrode sites
and is thought to reflect an alerting process that originates
in the frontal cortex (Courchesne et al 1975; Ebmeier et al
1995; Friedman and Simpson 1994; Friedman et al 1993;
Knight 1984). Recent reports, however, indicate that P3a
amplitude is directly affected by the discrimination
diffi-culty between the target and standard stimuli and not by
novel stimulus characteristics (Comerchero and Polich
1998, 1999; Katayama and Polich 1998). These studies
suggest that the P3a reflects attentional processes related
to signal evaluation, because it is elicited by rare deviant
stimuli presented when selective attention is engaged in
the absence of a response, appears to originate from the
frontal lobe, and readily habituates (Knight 1996; Potts et
From the Department of Psychiatry, SUNY Health Science Center at Brooklyn,Brooklyn, New York (BP, HB), the Department of Neuropsychiatry, Nippon Medical School, Tokyo, Japan (MH), and Cognitive Electrophysiology Labo-ratory, Department of Neuropharmacology, The Scripps Research Institute, La Jolla, California (JP).
Address reprint requests to Bernice Porjesz, Ph.D., SUNY Health Science Center at Brooklyn, 450 Clarkson Avenue, Box 1203, Brooklyn NY 11203-2098. Received July 19, 1999; revised December 27, 1999; accepted December 31, 1999.
© 2000 Society of Biological Psychiatry 0006-3223/00/$20.00
al 1996). When memory processes store the incoming
stimulus information, the central/parietal P3b is generated
(Knight 1990; McCarthy et al 1997). Thus, P3a reflects the
initial response to an incoming signal, and P3b indexes the
attentional and mnestic operations invoked to process the
stimulus.
Alcoholism, P3a, and P3b
P3b amplitude is smaller in abstinent alcoholics compared
to control subjects (Pfefferbaum et al 1991, Porjesz et al
1980, 1987); it is also reduced in long-term abstinent
alcoholics (for reviews, see Begleiter and Porjesz 1995;
Porjesz and Begleiter, 1996). Recent evidence suggests
that callosal size may be a factor; the size of callosal fiber
tracts are correlated with P300 in normal subjects
(Alex-ander and Polich 1995; Polich and Hoffman 1998), and
smaller corpus callosal areas have been observed in
alcoholics based on magnetic resonance imaging (MRI)
recordings (Pfefferbaum et al 1996). These results suggest
that cognitive impairment in alcoholics (Eckardt et al
1988; Goldman and Goldman 1988; Sanders et al 1989;
Tamkin and Dolenz 1990; Tarbox et al 1986) may stem
from fundamental neuroanatomical variables that
contrib-ute to P300 generation.
The majority of ERP studies in alcoholics have used
paradigms that elicit only the P3b, with the general finding
that amplitude deficits in alcoholics are more pronounced
in visual stimulus tasks and are less consistently observed
in easy auditory paradigms (e.g., Porjesz et al 1980, 1987).
The few reports using P3a paradigms to evaluate
alcohol-ism have obtained mixed results: Alcoholics produced
smaller P3a amplitudes in an auditory passive paradigm
(Pfefferbaum et al 1991; Realmuto et al 1993), but no
group amplitude differences were found for an easy novel
visual stimulus paradigm (Biggins et al 1995). In contrast,
a difficult target/standard visual discrimination task did
obtain substantial P3a deficits to easy-to-detect rare
non-targets in alcoholics compared to control subjects, with
major group differences observed over frontal areas
(Ro-driguez-Holguı´n et al 1999). Taken together, these results
indicate that P3a deficits in alcoholics may exist, but the
nature of these effects is not yet clear.
P3 and Gender Difference
Given that the P3a reflects initial signal evaluation and the
P3b reflects subsequent attention resource and memory
processes that store stimulus information (Knight 1990;
Polich and Margala 1997), it is reasonable to suppose that
communication between the frontal hemispheres would
occur via the corpus callosum (cf. Baudena et al 1995;
Satomi et al 1995). Following this inter-hemispheric
communication, parietal attention, activation, and
subse-quent hippocampal operations would be engaged to
incor-porate the incoming stimulus information into memory
(Halgren et al 1995a, 1995b; Posner 1992). Indeed,
indi-viduals with inherently larger callosal fiber tracts, such as
left- compared to right-handers (Driesen and Raz 1995),
demonstrate larger P3b amplitudes, perhaps because of
increased inter-hemispheric communication (Alexander
and Polich 1995, 1997; Polich and Hoffman 1998).
Sim-ilarly, several researchers found gender differences in the
corpus callosum size in postmortem morphological studies
(Witelson 1989; Steinmetz et al 1995), and gender
differ-ences have been observed in P3b studies of normal control
subjects (Johnson 1989; Polich et al 1990; Segalowitz and
Barnes 1993; van Beijsterveldt et al 1998). Although the
studies of gender differences in P3a have not been
con-ducted, it is suggested that because P3a reflects initial
signal evaluation during communication between the
fron-tal hemispheres via corpus callosum, female subjects who
have larger corpus callosums would manifest larger P3a
than males. Thus, in the present study, we tested only male
subjects, thus excluding the possible gender effect on P3a.
Present Study
A critical factor for delineating P3a amplitude effects in
alcoholics appears to be the nature and modality of the
discrimination task. The present study was therefore
con-ducted to ascertain whether P3a from a difficult auditory
three-tone paradigm would be affected by alcoholism.
This issue is important, because it is suggested that P3a
reflects frontal lobe function. Alcoholics and control
subjects were assessed, and both ERP and Current Source
Density (CSD) analyses were performed to define
topo-graphic as well as possible source/sink group differences.
Methods and Materials
Subjects
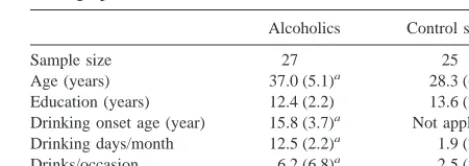
Table 1 presents demographic descriptions of the alcoholic and control subjects, all of whom were right-handed and male. All subjects provided informed consent and received pecuniary remuneration for their participation. Exclusionary criteria for Table 1. Subject Group Statistical (Mean and SD),
Demographic, and Clinical Information
Alcoholics Control subjects
Sample size 27 25
Age (years) 37.0 (5.1)a 28.3 (6.2)
Education (years) 12.4 (2.2) 13.6 (2.2) Drinking onset age (year) 15.8 (3.7)a Not applicable
Drinking days/month 12.5 (2.2)a 1.9 (2.0)
Drinks/occasion 6.2 (6.8)a 2.5 (2.3)
both groups included major medical problems, a current require-ment for central nervous system (CNS)-sensitive medication, and history of psychiatric problems. None of the subjects in either group met DSM III-R criteria for drug dependence; however, 39% of the alcoholics met criteria for polysubstance abuse secondary to alcoholism. Alcoholics met both DSM-III-R hol dependence and Feighner “definite” criteria to define alco-holism. Alcoholics were undergoing 30 days of alcoholism treatment at a local hospital. Some individuals in this program were on a regimen that included vitamin and nutritional therapy, and all were monitored closely for any signs of drug and/or alcohol abuse. Alcoholics were assessed with the ERP paradigm on their 28th day in the program, or as close as possible to their release. Exclusionary criteria included history of psychiatric disorder, intravenous drug use, treatment medication (e.g., An-tabuse), psycho- or CNS-active drugs, seizures unrelated to withdrawal, retardation, hearing, or visual impairments and liver damage (e.g., cirrhosis). Control subjects were recruited with newspaper advertisements or notices posted in the State Univer-sity of New York Health Science Center. The initial screening required completion of a questionnaire detailing alcohol/drug use and the medical and psychiatric histories for himself and his relatives. Exclusion criteria included specific responses about alcohol/drug use and that none of the control candidates’ first- or second-degree relatives were diagnosed alcoholics.
After the initial screening, subjects came to the laboratory and were given a detailed psychiatric interview focusing on questions of drug and alcohol use (quantity/frequency), with the medical and psychiatric histories for himself and first- and second-degree relatives obtained. Some subjects (both alcoholic and control) were members of families participating in a large-scale study on the genetics of alcoholism (Collaborative Study on the Genetics of Alcoholism). In this case, each participating family member was interviewed with the Semi-Structured Assessment for the Genetics of Alcoholism (SSAGA), which uses both DSM-III-R alcohol dependence and Feighner criteria to define alcoholism (Bucholz et al 1994). Interviews with family members were used to document the family history information. Subjects were required to undergo a breath analyzer test, and a urine screen was performed on the day of testing. Subjects with positive alcohol or drug screens were excluded. None of the subjects in the sample were in withdrawal on the day of testing. Caffeine and tobacco users were not excluded.
ERP Paradigm and Recording
The subject was seated in a reclining chair in a sound-attenuated shielded room and fixated on the center of a computer screen 1 m in front of him. The subject was presented with 350 binaural tones through headphones at 103 dB SPL (10 msec rise/fall, 40 msec plateau) and an inter-stimulus interval of 1.5 sec, with 270 standard (1630 Hz), 35 target (1530 Hz), and 35 nontarget (670 Hz) stimuli. The target and standard stimuli were difficult to discriminate from each other, but the nontarget stimulus was readily perceived. The experiment concluded when all 350 stimuli had been presented.
The subjects were instructed that they would hear high, medium, and low tones and to press a button on a modified
computer mouse as quickly as possible after hearing the medium tone. Response time (RT) and error rate were recorded, with subjects told that speed was important but not at the cost of accuracy. Trials with RTs.1000 msec were rejected. Practice trials were presented initially with 18 stimuli that included repeated patterns of standard, target, and nontarget.
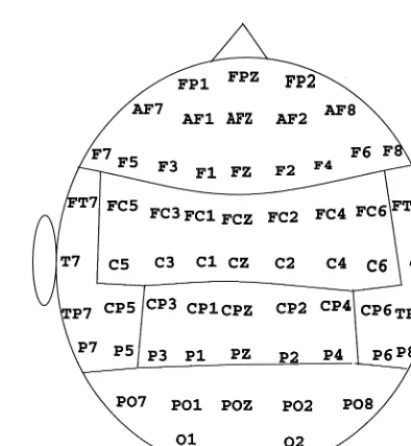
An electrode cap with 61 electrodes (ECI, Electrocap Interna-tional, Eaton, OH) was used such that the entire 10 –20 system and 41 additional sites were recorded as follows: Fpz, Afz, Af1, Af2, Af7, Af8, F1, F2, F5, F6, Fcz, Fc1, Fc2, Fc3, Fc4, Fc5, Fc6, FT7, FT8, C1, C2, C5, C6, Cpz, Cp1, Cp2, Cp3, Cp4, Cp5, Cp6, Tp7, Tp8, P1, P2, P5, P6, POz, PO1, PO2, PO7, and PO8 (Electrode Position Nomenclature, American Electroencephalo-graphic Society 1991). Scalp electrodes were referred to the nose, with a ground electrode on the forehead, and the imped-ances below 5 kohms. Both vertical and horizontal eye move-ments were monitored with electrodes that were placed supraor-bitally and at the outer canthus of the right eye. The signals were amplified with a gain of 10,000 by Ep-A2 amplifiers (Sensorium, Charlotte, VT), with a 0.02–50 Hz bandpass interfaced to a Concurrent 55/50 computer. The sampling rate was 256 Hz, with a 187.5 msec prestimulus baseline and epoch length of 1323 msec. Digital filtering (16 Hz low-pass) and artifact rejection (electromyogram, electro-oculogram, saturation.73.3mV) were performed off-line.
ERP Data Analysis
The P3a and P3b components were defined as the largest positive-peak within a latency window of 250 – 450 msec. Peak amplitude was measured relative to the prestimulus baseline, and peak latency was measured from the time of stimulus onset.
Figure 1 illustrates the regional grouping of component ampli-tudes that were employed for statistical analyses, which consisted of frontal, central, parietal, occipital, and left and right temporal regions. The mean amplitudes across electrodes within each region were employed as the dependent amplitude measures. Multivariate analyses of covariance (MANCOVA) were per-formed for the P3a comparisons between the two groups, with subject age used as a covariate even though the small group age difference was very unlikely to affect either amplitude or latency measures (cf., Anderer et al 1997; Polich 1997). For intragroup P3a and P3b assessment, multivariate analyses of variance (MANOVA) were employed.
Current Source Density Analysis
Scalp ERPs can reflect the average activity of multiple neural sources recorded at a distance so that they are neither reference free nor independent of volume conductor effects. These limitations imply that ERP components will be altered if the recording reference is noisy or changed, such that “spatial smearing” of potential amplitudes can occur as a consequence of differential volume conduction (Nunez and Pilgreen 1991). CSD maps were therefore constructed based on the ERP amplitudes using the grand mean derived from Laplacian transformations (Gevins et al 1991; Law 1991; Law and Nunez 1991; Perrin et al 1987a, 1987b). This method yields an accurate estimate of the local current density, because it acts as a spatial filter that enhances local over distant sources. Hence, CSD is a viable index for both current sources and sinks, because it reflects cortical activity such that positive current density corresponds to a source region where a local radial current is flowing through the skull into the scalp, and negative current density corresponds to current flow into the skull. Topographic CSD maps were constructed for both groups using the nontarget amplitudes measured at the average peak latency (Wang et al 1994).
For analysis purposes, CSD maps were additionally ob-tained for both subject groups using the bootstrap method (Srebro 1996). All the amplitude data from the two groups were pooled and treated as if they were one group and then randomly assigned to new groups, such that three pools with
n subjects each were created: 1) randomly selected only from
controls; 2) randomly selected only from alcoholics; 3) randomly selected from both groups. If the CSD scalp field topography shapes between the control and alcoholic groups are different, the correlation coefficient (Pearson’s r) com-puted between groups using the CSD value across electrodes within each of the topographic regions defined in Figure 1 will be zero. If the CSD scalp topography shapes are not different, the correlation coefficient will be significantly greater than zero. By repeating the random selection procedure 200 times, an empirical estimate was obtained for the variability associ-ated with the difference between the two correlations (one that keeps the groups separate, “alcoholic vs. control,” and one that pairs the groups randomly, “random-1 vs. random-2”). The Fisher’s Z transformation of R was applied to the correlations obtained from each sampling, and the Z values were assessed using a t test.
Results
Task Performance
The mean percentage of errors was 1.9%, with no
statis-tically reliable group differences found. Alcoholics
re-sponded significantly slower than controls (529.5 vs.
518.5 msec), with t(51)
5
4.2, p
,
.0001. Given the low
error rates and only a 10 msec group difference, however,
it is reasonable to conclude that task performance was
equitable for each group.
ERP Analyses
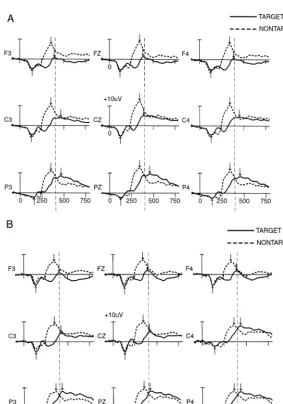
Figures 2a and 2b illustrate the grand average ERPs for
rare target and nontarget at nine key electrodes
represent-ing midline (Fz, Cz, Pz), left (F3, C3, P3), and right (F4,
C4, P4) sites for the control subjects and alcoholics,
respectively. Table 2 indicates the mean P3a amplitude in
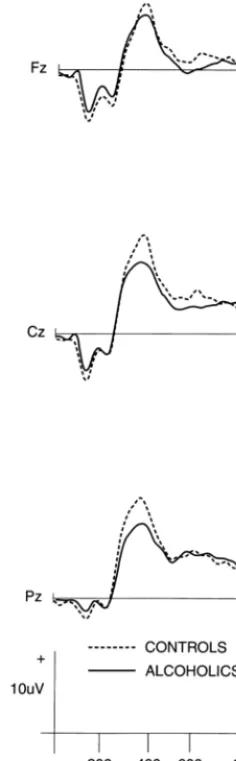
both groups at these nine key electrode sites. Figure 3
illustrates the mean P300 amplitudes from the rare
non-target (P3a) stimulus condition for each subject group.
Intra-Group P3a and P3b Assessment
The P300 data from the rare nontarget (P3a) and target
(P3b) were analyzed separately for each group using a
two-factor (2 stimulus types
3
4 electrodes) MANOVA to
determine whether the two groups differed with respect to
whether the three-stimulus paradigm produced similar P3a
and P3b outcomes in each subject group. Control subjects
evinced significantly larger overall P3a than P3b
ampli-tudes, F(1,24)
5
26.2, p
,
.001, and increasing
amplitudes from the frontal to parietal/occipital electrodes,
F(3,72)
5
3.7, p
,
.001. Amplitudes were larger
frontally and centrally for the nontarget compared to the
parietal maximum for the target stimuli to produce a
significant
stimulus
type
3
electrode
interaction,
F(3,72)
5
4.2, p
,
.01. P3a had consistently shorter
peak latency than P3b, F(1,24)
5
167.1, p
,
.001,
with no other reliable outcomes obtained (p
.
.50 in all
cases). Alcoholic subjects produced larger P3a compared
to P3b amplitudes, F(1,26)
5
7.1, p
,
.01, similar
increases across the midline, F(3,78)
5
3.7, p
,
.001,
and stimulus type
3
electrode interaction, F(3,78)
5
3.0, p
,
.05. P3a latency was again shorter than P3b,
F(1,26)
5
206.5, p
,
.001, with no other reliable
outcomes obtained (p
.
.75 in all cases). In sum, both
subject groups produced similar P3a and P3b amplitude
and latency patterns.
Nontarget P3a
(Stu-dents t test p
,
.0001). The adequacy of a covariate for
age was statistically evaluated. A simple regression
anal-ysis for age was performed to evaluate the effects of age
on both amplitude and latency of rare nontarget P3. For
amplitude, r
5
.4, p
,
.001 in alcoholics, r
5
.11, p
,
.001 in control subjects over all regions. In the frontal
region, r
5
0.13, p
,
.01 in alcoholics, r
5
0.17, p
,
.01 in control subjects. In the other regions, the rare
nontarget amplitudes were not significantly regressed on
age. These results indicated that the use of a covariate for
age was valid for amplitude over all regions and frontal
region. For latency, over all regions r
5
.14, F
5
4.8,
p
,
.05 in alcoholics, r
5
.2, p
,
.01 in control
subjects. In the other regions, the rare nontarget latency
was not significantly regressed on age. P3a amplitude
from the nontarget stimulus was assessed using a
two-factor (2 groups
3
6 regions) MANCOVA. Control
subjects demonstrated larger amplitudes overall than
alco-holics, F(1,51)
5
10.2, p
,
.01, with reliable regional
differences also obtained, F(5,255)
5
8.4, p
,
.001.
No group
3
region interaction was found (p
.
.10). P3a
latency was assessed with the same MANCOVA, but no
Figure 2. (A) Control subjects (n 5 25) event-related potential (ERP) grand averages for target, nontarget, and standard stimuli for nine electrode sites. (B) Alcoholic subjects (n 5 27) ERP grand averages for target, nontarget, and standard stimuli for nine electrode sites.
Table 2. Mean and SD of P3a Amplitudes (mV) at Three Midline (Fz, Cz, and Pz), Three Left (F3, C3, and P3), and Three Right (F4, C4, and P4) Electrodes for the Alcoholic and Control Group
significant outcomes were obtained (p
.
.40 in all cases).
Thus, the nontarget stimuli elicited different P3a
ampli-tudes for the control compared to alcoholic subjects,
although no specific regional differences were observed.
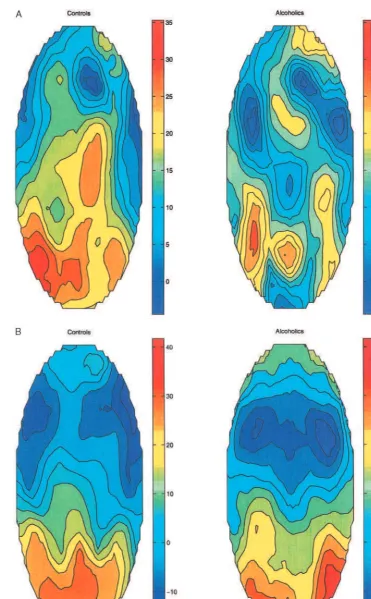
Current Source Density Analysis
Figure 4a and 4b illustrates the CSD maps for the
nontarget P3a in both groups. On visual inspection, both
groups showed more anterior distributions for the
nontar-get compared to the tarnontar-get. Control subjects manifested
stronger current densities than alcoholics for the nontarget.
As can be seen on Figure 4a, there were more sources and
sinks in the alcoholics than in the control subjects. CSD
maps appeared more organized in control subjects than
alcoholics for both targets (P3b) and nontargets (P3a), but
appeared most disorganized for the nontarget in
alcohol-ics. For the nontarget, alcoholics demonstrated
predomi-nant sources in one portion of right frontal, central, right,
left, and mid-parietal, and right occipital areas; sinks
occurred in right frontal, left central, and right temporal
regions. Control subjects demonstrated predominant
sources in the entire central, parietal, and occipital regions;
sinks occurred in the right frontal region. For the target,
alcoholics demonstrated predominant sources in the
pari-eto-occipital region; sinks occurred in right and
left-frontal-central region. Control subjects also demonstrated
predominant sources in parieto-occipital region; sinks
occurred in right and left frontal-temporal region. On
visual inspection, it appears that CSD maps for the target
(P3b) were more similar between the two groups than
CSD maps for the nontarget (P3a) with this paradigm;
however, the results of the bootstrap analysis method
(Tables 3 and 4) indicate that the distributions between
alcoholics and control subjects were significantly different
for both the nontarget and the target in all regions.
Discussion
The present study employed an auditory three-stimulus
paradigm to elicit the P3a and P3b components in
alco-holic and control subjects. Although the subject groups
demonstrated similar distributions of amplitude and
la-tency for the nontarget and target stimuli, P3a amplitudes
were smaller overall for the alcoholics compared to
control subjects. Different group CSD patterns were also
found, which suggests that neuroelectric mechanisms
un-derlying the P3a component were quite different for the
two groups. Previous studies, using active processing
paradigms, have found substantial group differences only
when the discrimination task was difficult (Biggins et al
1995; Rodriguez-Holguı´n et al 1999; Pfefferbaum et al
1991; Realmuto et al 1993). Because the auditory target/
standard discrimination required of the present study
elicited reliable group differences for the P3a from the
nontarget stimulus (cf. Comerchero and Polich 1998,
1999; Katayama and Polich 1998) it is reasonable to
conclude that ERP task difficulty is a critical variable for
demonstrating alcoholic versus control P3a effects.
Simi-larly, task difficulty has been found to be an important
variable in determining P3b differences in individuals at
risk for alcoholism (cf. Polich and Bloom 1999; Polich et
al 1994). Furthermore, visual or somatic stimuli have been
used to elicit P3a (e.g., Courchesne et al 1975; Yamaguchi
and Knight 1991), but the majority of clinical reports have
employed auditory stimuli because they are easy to
pro-duce, readily capture attention, and have provided much of
the basic data about P3a. Thus, this three-tone
Figure 4. (A) Current Source Density maps of P3a from the nontarget stimuli for control and alcoholic subjects (unit:mV/r2
/cm2
, r5
head radius). (B) Current Source Density maps of P3a from the target stimuli for control and alcoholic subjects (unit:mV/r2
/cm2
, r5
nation task provides a useful and reliable clinical device
for alcohol study.
P3a, Alcoholism, and Frontal Lobe Dysfunction
Although the precise location of the P3a generator is
unknown, the frontal cortex has been implicated, because
the response is markedly affected by frontal cortical
deficits: Patients with circumscribed lesions of
dorso-lateral frontal cortex have reduced P3a amplitudes, with
relative sparing of P3b (Knight 1984)—a result found for
P3a generated in the auditory, visual, and somatosensory
modalities (Yamaguchi and Knight 1991). A positron
emission tomography (PET) study using a three-tone
(novel) auditory discrimination task reported that P3a
amplitude was positively correlated with anterior cingulate
activity and negatively correlated with temporal activity in
normal subjects. Moreover, P3b amplitudes were
nega-tively correlated with posterior cingulate tracer uptake, but
positive correlations with P3b amplitudes were found in
various frontal and temporal regions (Ebmeier et al 1995).
P3a and P3b amplitudes have also been differentially
related to frontal and temporal neuroanatomical structure
sizes from MRI, because automatic and effortful attention
ERP manipulations correlated with frontal and parietal
gray matter volumes, respectively (Ford et al 1994).
Neuroimaging studies also support the hypothesis that
alcoholics exhibit general cortical and specifically frontal
lobe deficits compared to control subjects, perhaps
be-cause of excessive alcohol consumption. Computerized
tomography imaging has found cortical atrophy in
alco-holics and smaller P3b amplitudes than alcoalco-holics without
cortical atrophy (Begleiter et al 1980). MRI measures have
revealed volume losses in the diencephalon, caudate
nu-cleus, dorsolateral frontal cortex, parietal cortex, and
mesial temporal lobe in alcoholics (Jernigan et al 1991). In
addition, older alcoholics had less prefrontal gray matter
relative to a younger alcoholics, and the cortical white
matter volume deficit in the older alcoholics was
espe-cially severe in the prefrontal and frontal regions
(Pfeffer-baum et al 1997). PET measures have found decreased
local cerebral metabolic rate for glucose bilaterally in the
medial frontal area for alcoholics compared to normal
control subjects, with the severity of the clinical
neurolog-ical impairment significantly correlated with the degree of
hypometabolism in the medial frontal region (Gilman et al
1996). Furthermore, the local cerebral metabolic rate for
glucose was significantly decreased in a sagittal strip of
the medial frontal cortex in alcoholics, with a reliable
relationship between glucose metabolic rate in the medial
frontal region and Wisconsin Card Sorting Test
perfor-mance (Adams et al 1993)—a well-established index of
prefrontal
neuropsychological
function
(Shimamura
1995). Taken together with ERP studies, it is reasonable to
suppose that alcoholics demonstrate considerable
dysfunc-tion in frontal cortex and especially prefrontally.
Humans with prefrontal damage are susceptible to
proactive interference and perform poorly on
neuropsy-chological tests that require response inhibition
(Shi-mamura 1995; Stuss et al 1982). ERP and other measures
suggest increased distractibility and impaired gating of
inputs to primary auditory and somatosensory cortex in
frontal lobe damaged patients (Knight et al 1989; Woods
et al 1986; Yamaguchi et al 1990). Furthermore, animal
studies indicate that in addition to inhibition of
distracti-bility, the prefrontal cortex is also important for the early
selection of sensory inputs, such that damage to this area
results in disinhibition of input to primary cortical regions
(Knight et al 1989; Skinner and Yingling 1976;
Yamagu-chi et al 1990; Yingling et al 1976). In sum, varied
evidence suggests that frontal lobe deficits affect
informa-tion processing efficacy by disengaging the inhibitory
mechanisms normally involved in providing a cohesive
structure to incoming sensory events—a deficit pattern
that is highly consistent with the reduced P3a amplitudes
found for alcoholics compared to unaffected controls in
the present study.
Additional support for this perspective comes from a
comparison of go and no-go ERP paradigms in alcoholics
and subjects at high risk for alcoholism, which produced
Table 3. Mean Z Score Values from the Current Source Density Comparisons for Each Major Electrode Region in Nontarget P3
Frontal 2.82 2.15 14.6
Central 2.42 1.87 13.7
Parietal 2.60 2.01 14.1
Occipital 2.46 2.01 9.5
Right temporal 2.64 2.03 13.0 Left temporal 2.35 1.82 13.2
See Figure 1 for text and details.
aAll statistical outcomes obtained p,.0001.
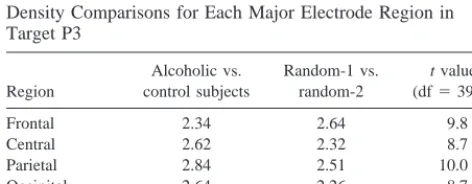
Table 4. Mean Z Score Values from the Current Source Density Comparisons for Each Major Electrode Region in Target P3
Frontal 2.34 2.64 9.8
Central 2.62 2.32 8.7
Parietal 2.84 2.51 10.0
Occipital 2.64 2.26 8.7
Right temporal 2.92 2.55 10.4 Left temporal 2.60 2.24 10.2
See Figure 1 for text and details.
reduced P3b amplitudes in both tasks (Cohen et al 1997a,
1997b), a finding that implies that inhibitory deficits may
develop in the thalamus in conjunction with other central
structures (Roberts et al 1994). This hypothesis is also
consistent with the claim that the positive-going P3
re-flects the activation of inhibitory processes (Born et al
1982; Rockstroh et al 1992; Schupp et al 1994; Woodward
et al 1991). Thus, alcoholism may be caused at least in part
by an increase in CNS hyperexcitability, which results
from the decrease in cortical inhibition (Begleiter and
Porjesz 1999).
P3a, Alcoholism, and Current Source Density
The most prominent current sources are apparent more
anteriorly for the nontarget compared to the target
stimu-lus in both groups. This finding agrees with the previous
potential distribution studies (Courchesne et al 1975;
Knight 1984). The difference in distribution of CSD maps
to the nontarget stimulus between control subjects and
alcoholics suggests that alcoholics have disturbances in
P3a generation. Although the frontal region is not the sole
generator of P3a (Knight 1984; Yamaguchi and Knight
1991) it is the most critical region associated with P3a
generation. Given the evidence for comprehensive
inter-cortical connections among sensory-motor and association
cortices (Kupferman 1995), damage to one domain
under-lying P3a generation could readily produce dysfunction in
the entire P3a generation network. Because imaging
stud-ies have found dysfunction in several brain regions,
including the frontal region in alcoholics (Adams et al
1993; Gilman et al 1996; Pfefferbaum et al 1997), the
difference in CSD maps may not be solely due to the
frontal lobe. It is suggested, however, that the frontal lobe
plays an important role in determining the difference in
CSD maps between alcoholics and controls.
Taken together, the lower amplitude and weaker sources
to rare stimuli coupled with the lack of topographic
specificity in the CSD maps of alcoholics compared to
control subjects, suggests that alcoholics respond in a
disorganized manner, perhaps reflecting an inefficiency
in brain functioning. This global pattern of
electro-physiological response suggests a lack of differential
inhibition in alcoholics, perhaps reflecting underlying
CNS hyperexcitability.
Collaborative studies on the Genetics of Alcoholism (H. Begleiter, SUNY HSCB, Principal Investigator, T. Reich, Washington University, Co-Principal Investigator). This collaborative study includes six different centers where data collection takes place. The six sites and Principal Investigator and Co-Investigators are as follows: Indiana University (J. Nurnberger, Jr., T.-K. Li, P.M. Conneally, H. Edenberg); University of Iowa (R. Crowe, S. Kuperman); University of California at San Diego and The Scripps Research Institute (M. Schuckit, F.E. Bloom);
Univer-sity of Connecticut (V. Hesselbrock); State UniverUniver-sity of New York, Health Sciences Center at Brooklyn (B. Porjesz, H. Begleiter); Wash-ington University in St. Louis (T. Reich, C.R. Cloninger, J. Rice). This national collaborative study is supported by the National Institute on Alcohol Abuse and Alcoholism (NIAAA) by U.S.P.H.S. grants NIAAA U10AA08401, U10AA08402, and U10AA08403. The superlative assis-tance of Arthur Stimus, David Chorlian, and Kongming Wang on this project is gratefully acknowledged.
References
Adams KM, Gilman S, Koeppe K, Brunberg JA, Dede D, Berent S, et al (1993): Neuropsychological deficits are correlated with frontal hypometabolism in positron emission tomogra-phy studies of older alcoholic patients. Alcohol Clin Exp Res 17:205–210.
Anderer P, Semlitch HV, Saletu B (1997): Multichannel auditory event-related brain potentials: Effects of normal aging on the scalp distribution of N1, P2, N2 and P3 latencies and amplitudes. Electroenceph Clin Neurophysiol 99:458 –72. Alexander JE, Polich J (1995): P300 differences between
sinis-trals and dexsinis-trals. Cogn Brain Res 2:277–282.
Alexander JE, Polich J (1997): Handedness and P300 from auditory stimuli. Brain Cogn 35:259 –270.
American Electroencephalographic Society (1991): American Electroencephalographic Society guidelines for standard elec-trode position nomenclature. J Clin Neurophysiol 8:200 –202. Baudena P, Halgren E, Heit G, Clarke JM (1995): Intracerebral potentials to rare target and distractor auditory and visual stimuli III. Frontal cortex. Electroencephal Clin Neurophysiol 94:251–264.
Begleiter H, Porjesz B (1995): Neurophysiological phenotypic factors in the development of alcoholism. Begleiter H, Kissin B editors. In: Alcohol and Alcoholism (Vol. 1); The Genetics
of Alcoholism. New York: Oxford University Press, 269 –293.
Begleiter H, Porjesz B (1999): What is inherited in the predis-position toward alcoholism? A proposed model. Alcohol Clin
Exp Res 23:1125–1135.
Begleiter H, Porjesz B, Tenner M (1980): Neuroradiological and neurophysiological evidence of brain deficits in chronic alcoholics. Acta Psychiatr Scand 62(suppl 286):3–13. Biggins CA, Mackay S, Poole N, Fein G (1995): Delayed P3a in
abstinent elderly male chronic alcoholics. Alcohol Clin Exp
Res 19:1032–1042.
Born J, Whipple S, Stamm JS (1982): Spontaneous cortical slow potential shifts and choice reaction time performance.
Elec-troencephalogr Clin Neurophysiol 54:676 – 688.
Bucholz KK, Cadoret R, Cloninger CR, Dinwiddie SH, Hessel-brock VM, Nurnberger JI Jr, et al (1994): A new semi-structured psychiatric interview for use in genetic linkage studies: A report of the reliability of the SSAGA. J Stud
Alcohol 55:149 –158.
Cohen HL, Porjesz B, Begleiter H, Wang W (1997a): Neuro-physiological correlates of response production and inhibition in alcoholics. Alcohol Clin Exp Res 21:1398 –1406. Cohen HL, Porjesz B, Begleiter H, Wang W (1997b):
Comerchero MD, Polich J (1998): P3a, perceptual distinctive-ness, and stimulus modality. Cogn Brain Res 7:41– 48. Comerchero MD, Polich J (1999): P3a and P3b from typical
auditory and visual stimuli. Electroencephalogr Clin
Neuro-physiol 110:24 –30.
Courchesne E, Hillyard SA, Galambos R (1975): Stimulus novelty, task relevance and the visual evoked potential in man. Electroencephalogr Clin Neurophysiol 39:131–143. Donchin E, Karis D, Bashore T, Coles MGH, Gratton G (1986):
Cognitive psychophysiology. In: Colos MGM, Donohin E, Porges SW, editors. Psychophysiology: Systems, Problems,
and Applications. New York: Guilford, 244 –267.
Driesen NR, Raz N (1995): The influence of sex, age and handedness of corpus callosum morphology: A meta-analy-sis. Psychobiology 23:240 –247.
Duncan-Johnson CC, Donchin E (1977): On quantifying sur-prise: The variation in event-related potentials with subjective probability. Psychophysiology 14:456 – 467.
Ebmeier KP, Steele JD, MacKensie DM, O’Caroll RE, Kydd RR, Glabus MF, et al (1995): Cognitive brain potentials and regional cerebral blood flow equivalents during two- and three-sound auditory “oddball tasks.” Electroencephalogr
Clin Neurophysiol 95:434 – 443.
Eckardt MJ, Rawlings RR, Graubard BJ, Faden V, Martin PR, Gottschalk LA (1988): Neuropsychological performance dur-ing treatment outcome in male alcoholics. Alcohol Clin Exp
Res 12:88 –93.
Ford JM, Sullivan EV, Marsh L, White PM, Lim KO, Pfefferbaum A (1994): The relationship between P3 amplitude and regional gray matter volumes depends on the attentional system engaged.
Electroencephalogr Clin Neurophysiol 90:214 –228.
Friedman D, Simpson GV (1994): ERP amplitude and scalp distribution to target and novel events: effects of temporal order in young, middle-aged and older adults. Cogn Brain Res 2:49 – 63.
Friedman D, Simpson GV, Hamberger M (1993): Age-related changes in scalp topography to novel and target stimuli.
Psychophysiology 30:383–396.
Gevins AS, Le J, Brickett P, Reuter B, Desmond J (1991): Seeing through the skull: Advanced EEGs using MRI to accurately measure cortical activity from the scalp. Brain Topogr 4:125– 131.
Gilman S, Koeppe RA, Adams K, Johnson-Greene D, Junck L, Kuin KJ, et al (1996): Positoron emission tomographic studies of cerebral benzodiazepine-receptor binding in chronic alcoholics. J Stud Alcohol 40:163–171.
Goldman PS, Goldman MS (1988): Experience dependent cog-nitive recovery in alcoholics: A task component strategy. J
Stud Alcohol 49:142–148.
Halgren E, Baudena P, Clarke J, Heit G, Liegeos Chuvel P, Musolino A (1995a): Intracerebral potentials to rare target and distractor auditory and visual stimuli. I Superior temporal plane and parietal lobe. Electroencephalogr Clin
Neuro-physiol 94:191–220.
Halgren E, Baudena P, Clarke J, Heit G, Marinkovic K, Devaux B, Vignal J, Biraben A (1995b): Intracerebral potentials to rare target and distractor auditory and visual stimuli. II Medial, lateral and posterior temporal lobe.
Electroencepha-logr Clin Neurophysiol 94:229 –50.
Jernigan TL, Butters N, DiTraglia G, Schafer K, Smith T, Irwin M, et al (1991): Reduced cerebral grey matter observed in alcoholics using magnetic resonance imaging. Alcohol Clin
Exp Res 15:418 – 427.
Johnson R (1988): The amplitude of the P300 component of the event-related potential: Review and synthesis. In: Ackles P, Jennings JR, Coles MGH, editors. Advances in
Psychophysiol-ogy: A Research Annual, Vol 3. Greenwich, CT: IAI, 69 –138.
Johnson R (1989): Developmental evidence for modality-depen-dent P300 generator: A normative study. Psychophysiology 26:651– 667.
Katayama J, Polich J (1998): Stimulus context determines P3a and P3b. Psychophysiology 35:23–33.
Knight RT (1984): Decreased response to novel stimuli after prefrontal lesions in man. Electroencephalogr Clin
Neuro-physiol 59:9 –20.
Knight RT (1990): Neural mechanisms of event-related potentials from human lesion studies. In: Rohrbaugh J, Parasuraman R, Johnson R, editors. Event-Related Brain Potentials: Basic Issues
and Applications. New York: Oxford Press, 3–18.
Knight RT (1996): Contribution of human hippocampal region to novelty detection. Nature 383:256 –259.
Knight RT, Scanbini D, Woods DL (1989): Prefrontal cortex gating of auditory transmission in humans. Brain Res 504:338 –342. Kupferman I (1995): Cognition and the cortex. In: Kandall ER,
Schwartz JH, Jessell TM, editors. Essentials of Neural
Sci-ence and Behavior. Stamford, CT: Appleton & Lange, 347–
363.
Law SK (1991): Spline generated surface Laplacians for improv-ing spatial resolution in electroencephalography. PhD Disser-tation, Tulane University, New Orleans.
Law SK, Nunez PL (1991): Quantitative representation of the upper surface of human head. Brain Topogr 3:365–371. McCarthy G, Luby M, Gore J, Goldman-Rakic P (1997):
Infrequent events transientry activate human prefrontal and parietal cortex as measured by functional MRI. J
Neuro-physiol 77:1630 –1634.
Nunez PL, Pilgreen KL (1991): The Spline-Laplacian in clinical neurophysiology: A method to improve EEG spatial resolu-tion. J Clin Neurophysiol 8:397– 413.
Perrin F, Bertrand O, Giard MH, Enchallier JF (1987a): Mapping of scalp potentials by surface spline interpolation.
Electroen-cephalogr Clin Neurophysiol 66:75– 81.
Perrin F, Bertrand O, Perrin F (1987b): Scalp current density mapping: Value and estimation from potential data. IEEE
Trans Biomed Eng 34:283–287.
Pfefferbaum A, Ford JM, White PM, Mathalon DH (1991): Event-related potentials in alcoholic men: P3 amplitude reflects family history but not alcohol consumption. Alcohol
Clin Exp Res 15:839 – 850.
Pfefferbaum A, Lim KO, Desmond JE, Sullivan E (1996): Thinning of the corpus callosum in older alcoholic men: A magnetic resonance imaging study. Alcohol Clin Exp Res 20:752–757. Pfefferbaum A, Sullivan EV, Mathalon DH, Kim KO (1997):
Frontal lobe volume loss observed with magnetic resonance imaging in older chronic alcoholics. Alcohol Clin Exp Res 21:521–529.
determinants of P300 latency from auditory stimuli.
Electro-encephalogr Clin Neurophysiol 63:251–259.
Polich J (1987): Task difficulty, probability, and inter-stimulus interval as determinants of P300 from auditory stimuli.
Electroencephalogr Clin Neurophysiol 68:311–320.
Polich J (1997): EEG and ERP assessment of normal aging.
Electroencephalogr Clin Neurophysiol 104:228 –243.
Polich J (1998): P300 clinical utility and control of variability.
J Clin Neurophysiol 15:14 –33.
Polich J, Bloom FE (1999): P300, alcoholism heritability, and stimulus modality. Alcohol 17:149 –156.
Polich J, Hoffman LD (1998): P300 and handedness: Possible corpus callosal contributions to ERPs. Psychophysiology 35:497–507.
Polich J, Ladish C, Burns T (1990): Normal variation of P300 in children: Age, memory span, and head size. Int J
Psycho-physiol 9:237–248.
Polich J, Margala C (1997): P300 and probability: Comparison of oddball and single-stimulus paradigm. Int J
Psychophysiol-ogy 25:169 –176.
Polich J, Pollock V, Bloom FE (1994): Meta-analysis of P300 amplitude from males at risk for alcoholism. Psychol Bull 115:55–73.
Porjesz B, Begleiter H (1996): Effects of alcohol on electrophys-iological activity of the brain. In: Begleiter H, Kissin B, editors. Alcohol and Alcoholism (Vol 2): The Pharmacology
of Alcohol and Alcohol Dependence. New York: Oxford
University Press, 207–247.
Porjesz B, Begleiter H, Bihari B, Kissin B (1987): The N2 component of the event-related brain potential in abstinent alcoholics. Electroencephalogr Clin Neurophysiol 66:121–131. Porjesz B, Begleiter H, Garozzo R (1980): Visual evoked potential correlates of information processing deficits in chronic alcoholics. In: Begleiter H, editor. Biological Effects
of Alcohol. New York: Plenum Press, 603– 623.
Posner MI (1992): Attention as a cognitive an neural system. Cur
Dir Psychol Sci 1:11–14.
Potts GF, Liotti M, Tuker DM, Posner MI (1996): Frontal and inferior temporal cortical activity in visual target detection: Evidence from high spatially sampled event-related poten-tials. Brain Topogr 9:3–14.
Realmuto G, Begleiter H, Odencranz J, Porjesz B (1993): Event-related potential evidence of dysfunction in automatic processing in abstinent alcoholics. Biol Psychiatry 33:594 – 601.
Roberts LE, Rau H, Lutzenberger W, Birbaumer N (1994): Mapping P300 waves onto inhibition: Go/no-go discrimina-tion. Electroencephalogr Clin Neurophysiol 92:44 –55. Rockstroh B, Muller M, Cohen R, Elbert T (1992): Probing the
functional brain state during P300-evocation. J Psychophysiol 6:175–184.
Rodriguez-Holguı´n S, Porjesz B, Chorlian DB, Polich J, Begle-iter H (1999): Visual P3a in male alcoholics and controls.
Alcohol Clin Exp Res 23:582–591.
Sanders AM, Nixon SJ, Parson OA (1989): Pretest expectancies and cognitive impairment in alcoholics. J Consult Clin
Psychol 39:1100 –1101.
Satomi K, Horai T, Kinoshita Y, Wakazono A (1995):
Hemi-spheric asymmetry of event-related potentials in a patient with callosal disconnection syndrome: A comparison of auditory, visual and somatosensory modalities.
Electroen-cephal Clin Neurophysiol 94:440 – 449.
Schupp HT, Lutzenberger W, Rau H, Birbaumer N (1994): Positive shifts of event-related potentials: A state of cortical disfacilitation as reflected by the startle reflex probe.
Elec-troencephagr Clin Neuraphysiol 90:135–144.
Segalowitz S, Barnes K (1993): The reliability of ERP compo-nents in the auditory oddball paradigm. Psychophysiology 30:451– 459.
Shimamura AP (1995): Memory and frontal lobe function. In: Gazzaniga MS, editor. The Cognitive Neurosciences. Cam-bridge, MA: MIT Press, 803– 815.
Skinner JE, Yingling CD (1976): Regulation of slow potential shifts in nucleus reticularis thalami by mesencephalic reticu-lar formation and the frontal granureticu-lar cortex.
Electroencepha-logr Clin Neurophysiol 40:288 –296.
Squires NK, Squires KC, Hillyard SA (1975): Two varieties of long-latency positive waves evoked by unpredictable auditory stimuli in man. Electroencephalogr Clin Neurophysiol 38:387– 401.
Srebro R (1996): A bootstrap method to compare the shapes of two scalp fields. Electroencephalogr Clin Neurophysiol 100:25–32. Steinmetz H, Staiger J, Schlaug G, Huang Y, Jankee L (1995): Corpus callosum and brain volume in women and men.
Neuroreport 6:1002–1004.
Stuss DT, Kaplan EF, Benson DF (1982): Evidence for the involvement of orbitofrontal cortex in memory functions: An interference effect. J Comp Physiol Psychiatry 96:913–925. Tamkin AR, Dolenz JJ (1990): Cognitive impairments in
alco-holics. Percept Motor Skills 70:816 – 818.
Tarbox AR, Conners GJ, McLaughlin EJ (1986): Effects of drinking pattern on neuropsychological performance among alcohol misusers. J Stud Alcohol 47:176 –179.
van Beijsterveldt CEM, Molenaar PCM, de Geus EJC, Boomsma DI (1998): Individual differences in P300 amplitude: A genetic study in adolescent twin. Biol Psychol 47:97–120. Wang W, Porjesz B, Begleiter H (1994): Surface energy, its
density and distance: New measures with application to human cerebral potentials. Brain Topogr 6:193–202. Witelson S (1989): Hand and sex differences in the isthmus and
genu of the human corpus callosum. A postmortem morpho-logical study. Brain 112:799 – 835.
Woods DL, Knight RT (1986): Electrophysiological evidence of increased distractibility after dorsolateral prefrontal regions.
Neurology 36:212–216.
Woodward SH, Brown WS, Marsh JT, Dawson ME (1991): Probing the time-course of the auditory oddball P3 with secondary reaction time. Psychophysiology 28:356 –368. Yamaguchi S, Knight RT (1990): Gating of somatosensory
inputs by human prefrontal cortex. Brain Res 521:281–288. Yamaguchi S, Knight RT (1991): Anterior and posterior
associ-ation cortex contributions to the somatosensory P300. J
Neu-rosci 11:2039 –2054.
Yingling CD, Skinner JE (1976): Selective regulation of thalamic sensory relay nuclei by nucleus reticularis thalami.